
Raffles forming Ascending Triangle and FlagRaffles (BSL) could break out soon
Disclaimer: This is not an advice to buy or sell!!


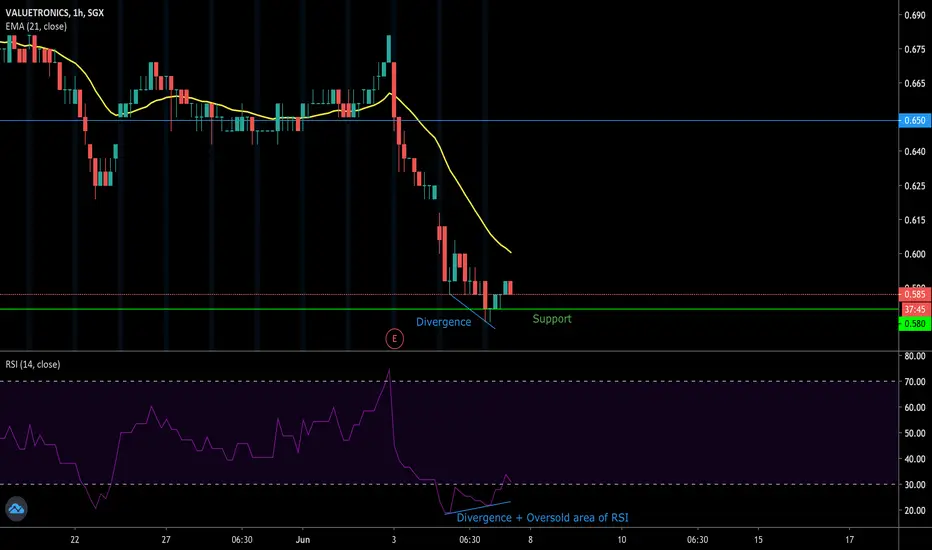
Could this be the end of Valuetronics sell down?Hourly chart shows a divergence with prices making lower lows while the RSI made higher high within the oversold region. Potential rally after the post-FY results sell down?
Potential Long for China Sunsine after breaking out from rangingPontential long for China Sunsine after breaking out from a range. Resistance turned support followed by a dojo at Support indicates weakening bears

SIA SGX Stock (The Pride Of Singapore?)View On SIA (4 JUNE 2020)
We are seeing a strong rebound in SIA for the past weeks and currently, it is at an important level of $4.30 region.
This is the make (or) breaks regions and it is getting a little late to buy in.
We may see some resistant at the region but as long as 3.65 is supported well, sooner or later we shall see $5 again
DYODD, all the best and read the disclaimer too.
Feel Free to "Follow", press "LIKE" "Comment".
Thank You!
Legal Risk Disclosure:
Trading foreign exchange or CFD on margin carries a high level of risk, and may not be suitable for all investors.
The high degree of leverage can work against you as well as for you.
Before deciding to trade foreign exchange you should carefully consider your investment objectives, level of experience and risk appetite.
The possibility exists that you could sustain a loss of some or all of your initial investment and therefore you should not invest money that you cannot afford to lose. You should be aware of all the risks associated with foreign exchange trading, and seek advice from an independent financial advisor.
DISCLAIMER:
Any opinions, news, research, analyses, prices or other information discussed in this presentation or linked to from this presentation are provided as general market commentary and do not constitute investment advice.
Sonicr Mastery Team does not accept liability for any loss or damage, including without limitation to, any loss of profit, which may arise directly or indirectly from use of or reliance on such information.


SATS - Bullish Adam & Eve Reversal?SATS has been staging several strong rebounds since late March which failed. However the stock fell on 29 May with a massive volume but without forming a new low from the March's low. There is a chance that the weak bulls have been flushed out once and for all and that the rebound that started 2 days ago is sustainable this time, especially when it appeared to have formed an Adam & Eve base formation. Time to stake it for some upside. Long @ 3.00 with initial stop just below 2.85 and looking to scale out @ 3.28-3.30 then 3.55 and perhaps even 3.80 if lucky.
Disclaimer: This is just my own analysis and opinion for discussion and is not a trade advice. Kindly do your own due diligence and trade according to your own risk tolerance. Thank you.

Astaka HoldingsThe Company was incorporated in Singapore on 28 July 2008 under the name of Westminster Travel Limited. The Group is a one-stop travel management and services group offering a wide range of travel products and services. It is principally engaged in the provision of corporate travel services and the wholesale of air tickets and hotel rooms. Its also provide leisure travel services. The Group’s business can be categorised into three segments as follows: Corporate Segment: Its corporate segment provides corporate business travel, MICE, corporate leisure travel and other travel related services and products to its corporate travel customer base. Air Tickets/Hotel Rooms Wholesale Segment: Its wholesale segment engages in the sale of air tickets and hotel rooms on behalf of its suppliers to its customers, which comprises other travel agents. Leisure Segment: It offers a range of travel products, including FIT packages, air tickets, hotel accommodation, and other travel-related products such as insurance, Eurail pass, Walt Disney tickets, cruises etc to both its retail and wholesale customers through its network of travel management and services offices.


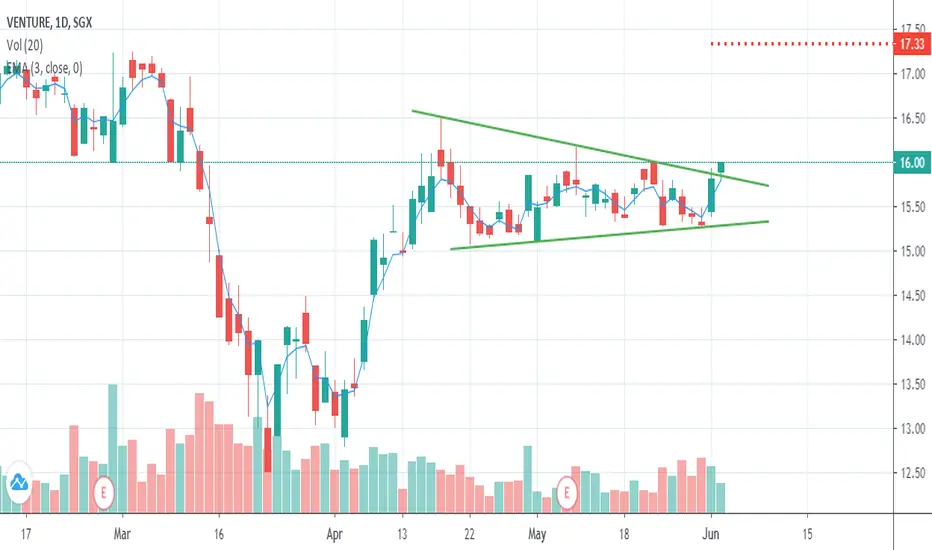
Venture Cup and Handle breakoutCup and handle pattern breakout.
Disclaimer: Not an advice to buy or sell.


UOB 50 - 200 SMA Death Cross?www.tradingview.com
UOB Weekly Chart:
1. 50 Day SMA / 200 Day SMA death cross imminent?
2. Further decrease in Chaikin Money Flow from -0.20 to -0.28 from May to June
3. Thin volume on 2nd June breakout above $20
4. Consecutive gravestone dojis on 3rd and 4th weeks of March. Although shadow length is rather small.

SIA: No catalyst for demandwww.tradingview.com
SIA latest headlines: 1st June 20'
- Majority of SIA directors chooses to let their rights mandatory convertible bonds (MCBs) lapse without exercising them, despite proposing the MCB rights issuance to shareholders as part of larger cash call in April.
- SIA to reinstate certain flights in June & July, subject to regulatory approvals. Reinstated services include: Adelaide, Amsterdam, Auckland, Barcelona, Brisbane, Cebu, Copenhagen, Hong Kong, Medan, Melbourne and Osaka
Daily Chart:
Fib Retracement: Resistance at 3.96 (38.2%) and 4.08 (50%) levels remains to be tested
Moving Averages: Price close at 3.88 above 14 Day SMA, against weekly price advance of approx 7% on light volume . (Bearish)
CMF: - 0.21 as of 1st June. No major catalyst likely for demand fill anytime soon. (Bearish)
Weekly Chart:
MACD: MACD and signal lines at around -0.60, well below 0 break line. (Bearish)
RSI: 28.80 as of 1 June 20'. Close to oversold territory (Value)
Money Flow Index: 33.39. Neutral with downward bias to oversell.
Personal take:
Best to steer clear of this counter for the near future, no prizes to infer lack of institutional demand as per SIA director's actions as a proxy.
Possible value when overselling enters it's final stages. 3.96 and 4.08 per share as resistance levels to watch going forward.
Hope SIA will be able to take to the skies soon. Miss travelling!

Comfort Delgro (Be Afraid. Be Very Afraid!)View On Comfort Delgro (1 JUNE 2020)
This counter has been downtrend since 2019 and it is kinda ridiculous to call for a SELL out of sudden.
Anyway, I'd like to take note of the HUGH volume that occurred last week due to the News.
So, I do not think it is good news for the counter and it shall not recover anytime soon as long as the price can't break above $1.70 region.
Let's see
DYODD, all the best and read the disclaimer too.
Feel Free to "Follow", press "LIKE" "Comment".
Thank You!
Legal Risk Disclosure:
Trading foreign exchange or CFD on margin carries a high level of risk, and may not be suitable for all investors.
The high degree of leverage can work against you as well as for you. Before deciding to trade foreign exchange you should carefully consider your investment objectives, level of experience and risk appetite.
The possibility exists that you could sustain a loss of some or all of your initial investment and therefore you should not invest money that you cannot afford to lose.
You should be aware of all the risks associated with foreign exchange trading, and seek advice from an independent financial advisor.
DISCLAIMER:
Any opinions, news, research, analyses, prices or other information discussed in this presentation or linked to from this presentation are provided as general market commentary and do not constitute investment advice.
Sonicr Mastery Team does not accept liability for any loss or damage, including without limitation to, any loss of profit, which may arise directly or indirectly from use of or reliance on such information.

SGX - opportunity to stake?SGX crashed spectacularly after announcing that they are loosing some MCSI index licenses. However it tested a longer term trendline at 8.13 and has been rebounding from there. Long @ 8.28 this morning with initial stop a few ticks below 8.13 (the recent low). WIth a view to take partial profits at 9.00 and trail the rest up.
Disclaimer: This is just my own analysis and opinion for discussion and is not a trade advice. Kindly do your own due diligence and trade according to your own risk tolerance. Thank you.

OCBC further price decline? www.tradingview.com
Looking for alternative interpretations!
Money Flow Index: 33.24, small room for further decline. Might also be biased towards 27th May distribution volume ex dividend. (Uncertain)
CMF: - 0.29 as of 29th May. Major sell off unlikely, limited room for major demand declines (Uncertain)
Moving Averages: Likely for 14 day SMA to cross under 50 day SMA (Bearish)
Fib Retracement: Resistance at 9.07 (38.2%) remains untested, period selected from 20th Feb to 23rd March for Fib Levels (Bearish)
MACD: MACD line crossed under Singal Line, unlikely to break above the 0 line into positive territory soon (Bearish)
Side note, Bollinger Bands look to be tightening, may have stronger price action soon, hopefully to lower price levels!
End May Events:
- Rising U.S-China Tensions over HK security legislation
- Protests emerging across U.S, George Floyd incident


