DBS Flag / PennantDBS is trading in the flag / pennant. Lookout for the break.
Disclaimer: Not an advice to buy/sell.

SIA time to short. This time it may be a downside. Dark cloud cover formation on Wednesday shows a clear indicator to short. Pennant formation more or less is confirmed.

SGX:5WH Potential Short Setup - Day 3 testing 20MA resistance?CCI overbought @ 100
9 April 2020 - Potential Short Setup
Entry at previous day low - 1 bid
Stop loss at previous day high + 1 bid

Valuetronic clear to sell now.
Refer to the above post.
On 3rd of April, we believe that Valuetronics Holdings rebound may continue to the 161.8% extension level and price did travel to the level at 0.595, short of 0.05 of our target price. The price did have some reaction by selling down on Monday and based on the technical, the stock is set to continue its downside:
1. The stock had a sell down at the supply level confluence with the 161.8% extension level of 0.530-0.435.
2. Price action indicate that the stock has completed the bearish flag.
3. Evening star formation at the top of the flag and 161.8% extension level.
4. Death cross is still valid with prices trending way below the 50 and 200 Moving averages.
5. Stochastic Oscillator shows an overbought crosses above the 80 overbought zone.

SGX Breaks out of the long term triangleSGX has broken out and has been very strong. While most stocks trading below 50% retracement levels from the previous highs, SGX has already taken out the previous high and now looks like headed higher.
Disclaimer: Not an advice to buy or sell.

WILMAR (F34) - Opportunity to BUYHey everyone, here's the analysis on Wilmar, if you found this insightful, please like and leave a comment on ideas you would like to see next!
Summary:
As illustrated by the yellow dotted lines, I am expecting a drop in current price to zone 2 at the 3.22 area highlighted in green, before moving higher to our resistance zone between 3.73 - 3.81.
Action:
Buy Limit: 3.22
Stop Loss: 3.00
Take Profit: 3.73
Analysis:
Zone 2 is in line with a key level on the weekly chart and the 38.2% retracement. If current price holds well above zone 2, it could rally to zone 3 highlighted in red, between 3.73 - 3.81. The resistance zone 3 is a key breakout zone, hence we will not play a move beyond that.
Disclaimer: There is a very high degree of risk involved in trading and investing. Past results are not indicative of future returns. Trading BEAN and all individuals affiliated with this site assume no responsibilities for your trading and investment results. All contents featured here are solely for educational purposes and ARE NOT investment or trading advices. Please do your own due diligence and trade at your own risk.

UOB (U11) - Key levels to BUYHey everyone, here's my analysis on U11:
Summary
Price could drop lower to zone 1 between 13.18 - 14.24 before a bounce.
Action:
Buy Limit: 13.18 - 14.24
Analysis:
3 of the green zones highlighted above are support zones where we could see a bounce in price. Currently, given the situation that we are in with the Covid-19 outbreak yet to reach its peak, I lean towards seeing a further drop in price from its current level to zone 1 at 13.18 - 14.24 before a bounce, as illustrated by the yellow dotted lines. If price breaks below the key zone at 13.18 - 14.24, it is likely to test zone 2.
Disclaimer: There is a very high degree of risk involved in trading and investing. Past results are not indicative of future returns. Trading BEAN and all individuals affiliated with this site assume no responsibilities for your trading and investment results. All contents featured here are solely for educational purposes and ARE NOT investment or trading advices. Please do your own due diligence and trade at your own risk.

Take some risk on the counter trend tradeValuetronics has sunk Low and in light of a potential bearish flag, we see some buying action after today’s bullish Engulfing Pattern at 38.2 retracement level. However do take not this is A COUNTER TREND TRADE. So exercise some caution

Venture Corp (V03) - Key levels to BUYHey guys! Here's my view on V03:
Summary
I will place a BUY limit at the second support zone 9.93 - 10.58.
Currently, we are seeing a nice bounce from the 1st Support Zone and it could push up to the 1st resistance zone at 16.45 - 17.00 before a drop to our 2nd support zone.
Action:
Buy Limit: 9.93 - 10.58
Stop Loss: 8.50
Take Profit: 20.47
Analysis:
Nice bounce off the 1st support zone now and it could rise further to the first resistance zone in red before a drop.
IF price breaks the 1st support zone , it is likely to push lower to our 2nd support zone where I will look to enter a BUY limit there.
Disclaimer: There is a very high degree of risk involved in trading and investing. Past results are not indicative of future returns. Trading BEAN and all individuals affiliated with this site assume no responsibilities for your trading and investment results. All contents featured here are solely for educational purposes and ARE NOT investment or trading advices. Please do your own due diligence and trade at your own risk.

Hong Fok (A Short Covering Rally is taking place)View On Hong Fok (6 APR 2020)
After the huge fall in 2019, this little use-less counter is finding some value and it is making a comeback.
We can say it is a short-covering rally.
It can rise to 0.65 or even toward 0.69.
Do not short as it may drift higher first (or) you can go in the LONG side with great caution.
DYODD, all the best and read the disclaimer too.
Feel Free to "Follow", press "LIKE" "Comment".
Thank You!
Legal Risk Disclosure:
Trading foreign exchange or CFD on margin carries a high level of risk, and may not be suitable for all investors.
The high degree of leverage can work against you as well as for you.
Before deciding to trade foreign exchange you should carefully consider your investment objectives, level of experience and risk appetite.
The possibility exists that you could sustain a loss of some or all of your initial investment and therefore you should not invest money that you cannot afford to lose. You should be aware of all the risks associated with foreign exchange trading, and seek advice from an independent financial advisor.
DISCLAIMER:
Any opinions, news, research, analyses, prices or other information discussed in this presentation or linked to from this presentation are provided as general market commentary and do not constitute investment advice.
Sonicr Mastery Team does not accept liability for any loss or damage, including without limitation to, any loss of profit, which may arise directly or indirectly from use of or reliance on such information.

DBS (D05) - Key levels to BUYHey guys! Here's my view on D05:
Summary
I will place a BUY limit at the second support zone 11.52 - 12.40.
Action:
Buy Limit: 11.52 - 12.40
Stop Loss: 9.90
Take Profit: 16.90
Analysis:
Price is testing the 1st support zone now and we could see a bounce to our resistance zones highlighted in red.
IF price breaks the 1st support zone, it is likely to push lower to our 2nd support zone where I will look to enter a BUY limit there.
Alternatively, you can also look to play the bounce at current price to our first resistance zone before waiting for another entry at the 2nd Support Zone.
Disclaimer: There is a very high degree of risk involved in trading and investing. Past results are not indicative of future returns. Trading BEAN and all individuals affiliated with this site assume no responsibilities for your trading and investment results. All contents featured here are solely for educational purposes and ARE NOT investment or trading advices. Please do your own due diligence and trade at your own risk.

UOB Buy at $17.96, SL at $17.12 with TP1 $19.96 and TP2 > $25 UOB is at 12M support and showed a strong reversal pattern at W bullish engulfing pattern.

Ausgroup - Potential Double Top Long bearish candle
Double Top pattern
Oil price drop due to OPEC & non OPEC disagreement - Potential drop to next level @ 0.2
Feel free to share your thoughts comments box. Note: This is not financial or investment advise. It will be good to always understand the risks involve in trading. Always trade with stop loss in place. Thumbs up if u like the analysis :)

SGX:SIA - A very long descending triangleI dont like where SGX:C6L Singapore Airlines is heading. This is a very very very long descending triangle. SIA might have bottomed here or it might be facing tougher times ahead. I am leaning toward the latter and I would not catch a falling knife right now. Until there's a clearer picture, i would stay away.

Genting Singapore Limited - AnalysisSTOCK IN FOCUS: GENTING SING
As the pandemic situation continues, tourism-related companies are greatly affected. Travel advisories, bans and even country lock-downs see a stark drop in local and tourist traffic, and revenue for the retail and hospitality sector. Genting Singapore PLC had been involved in the development, and currently operating 2 Integrated Resorts in Singapore. With noticeable absence of foot traffic, we can expect revenue to drop. A pick-up of tourism is linked to the recovery not only of healthcare aspect of the pandemic situation, but also a recovery of countries' economies.
Price has melted from the descending triangle and looks to continue melting with the ongoing situation. We could see price levels reach GFC crisis levels, ranging from 0.325 to 0.470.
Price YTD: down 33% (from 0.930 to 0.620)
Price from end Jan'20: down 28% (from 0.865 to 0.620)
Dividend yield FY'18: 5.65%
Dividend yield FY'19: 5.65%
I believe dividend yields will fall for FY'20 but it could be a good hold as I believe that this stock has potential to climb as tourism picks up in future, and possibly with plans to expand.


DBS - AnalysisSTOCK IN FOCUS: DBS
A huge meltdown in global markets has sparked risk-off sentiment throughout, and many stocks are being heavily sold-off. Be it blue-chip or penny stocks, majority are affected and are selling at a discount.
DBS is a blue chip stock in the SGX, and with the recent sell-off - down around 29% (from end Jan' 20) , price could reach the $16 range ( down 38% from Jan' 20) to retouch the rising trend line. If the global rout continues, we could see price break down the rising trend line and possibly reach the indicated price levels. Otherwise, we could see a bounce after a retest of the trend line.

DBS - rooms for further decline?Based on past decade trading pattern, if history is a good indication, then possibly this counter has yet to reach the bottom in order for the next run up.
Feel free to share your thoughts comments box. Note: This is not financial or investment advise. It will be good to always understand the risks involve in trading. Always trade with stop loss in place. Thumbs up if u like the analysis :)
Thank you

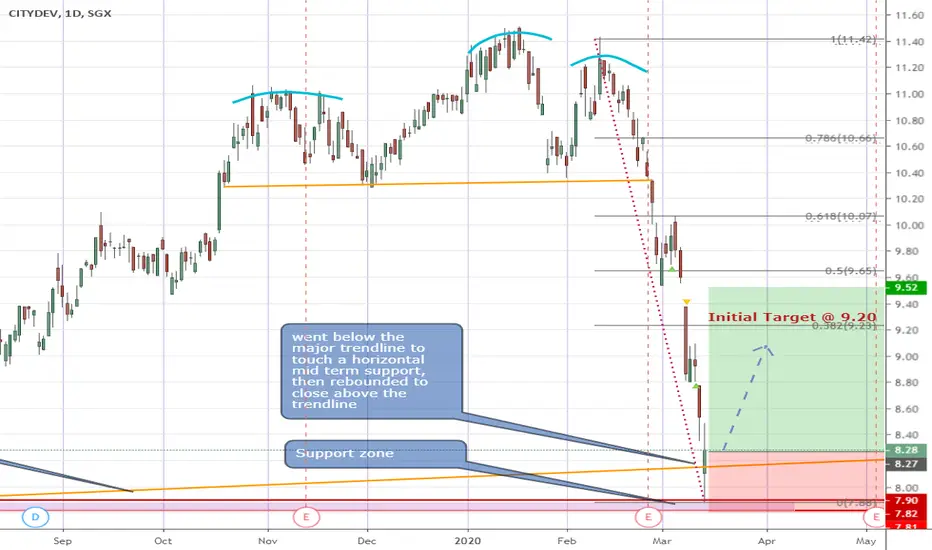
CityDev - Time to Long again?Citydev broke down form a bearish H&S formation just 2 weeks ago and with the extremely bearish market sentiment this week, slammed into a support area (horizontal mid term support plus a long term trendline) and closed just above the supports. Looking to long it next week just above today's close at 8.28 with a Stop a few pips below the last low at 7.88 and then trailing my stop upwards as it heads towards an initial target of 9.20 (38% fib retracement up).
Disclaimer: This is just my own analysis and opinion for discussion and is not a trade advice. Kindly do your own due diligence and trade according to your own risk tolerance. Thank you :)
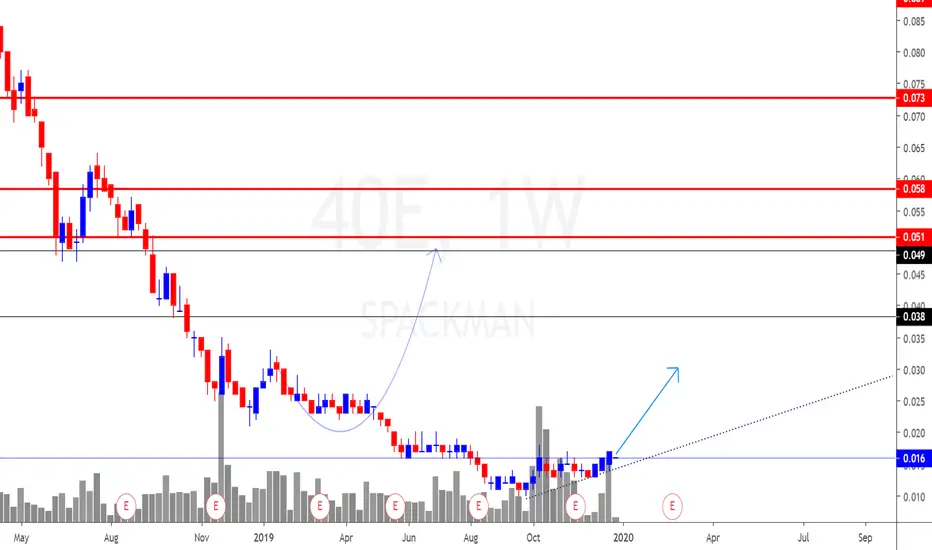
Spackman (The rise is nigh?)View On Spackman (30 Dec 2019)
We are dead wrong on this counter and finally will there be a light at the end of the tunnel?
It apparently so!
The following is our analysis on 14 Jan 2019.
I will not be typing too many words but please take a look at this counter.
It is trying to break out up after a prolonged slide.
-------------
Our Analysis
-------------
LONG (entry is valid as long as the price is above 0.02)
TP1 0.038 (Already Hit, Take TP and wait again)
TP2 0.049
TP3 0.063
TP4 0.075
DYODD, all the best and read the disclaimer too.
Feel Free to "Follow", press "LIKE" "Comment".
Thank You!
Free Telegram FX/Stock analysis at your fingertip @ t.me/sonictraders
Looking for a good CFD broker? Go to cmc.mk
Looking for a good MT4 broker? Go to bit.ly
Follow our Trading View, @ bit.ly
Visit our Webby @ bit.ly
Like our FB @ bit.ly
Legal Risk Disclosure:
Trading foreign exchange or CFD on margin carries a high level of risk, and may not be suitable for all investors.
The high degree of leverage can work against you as well as for you.
Before deciding to trade foreign exchange you should carefully consider your investment objectives, level of experience and risk appetite.
The possibility exists that you could sustain a loss of some or all of your initial investment and therefore you should not invest money that you cannot afford to lose. You should be aware of all the risks associated with foreign exchange trading, and seek advice from an independent financial advisor.
DISCLAIMER:
Any opinions, news, research, analyses, prices or other information discussed in this presentation or linked to from this presentation are provided as general market commentary and do not constitute investment advice.
Sonicr Mastery Team does not accept liability for any loss or damage, including without limitation to, any loss of profit, which may arise directly or indirectly from use of or reliance on such information.
SembCorp Marine SGX Stock (Can Swing to 50c-70c Region) View On SembCorp Marine (12 MAR 2020)
This company share price is in the free fall recently and it may continue to drop further as we do not see any bullish momentum/candle at the moment.
It can swing to 50c to 70c region soon since that region is considered as a strong support.
Let's see
DYODD, all the best and read the disclaimer too.
Feel Free to "Follow", press "LIKE" "Comment".
Thank You!
Legal Risk Disclosure:
Trading foreign exchange or CFD on margin carries a high level of risk, and may not be suitable for all investors.
The high degree of leverage can work against you as well as for you. Before deciding to trade foreign exchange you should carefully consider your investment objectives, level of experience and risk appetite.
The possibility exists that you could sustain a loss of some or all of your initial investment and therefore you should not invest money that you cannot afford to lose.
You should be aware of all the risks associated with foreign exchange trading, and seek advice from an independent financial advisor.
DISCLAIMER:
Any opinions, news, research, analyses, prices or other information discussed in this presentation or linked to from this presentation are provided as general market commentary and do not constitute investment advice.
Sonicr Mastery Team does not accept liability for any loss or damage, including without limitation to, any loss of profit, which may arise directly or indirectly from use of or reliance on such information.

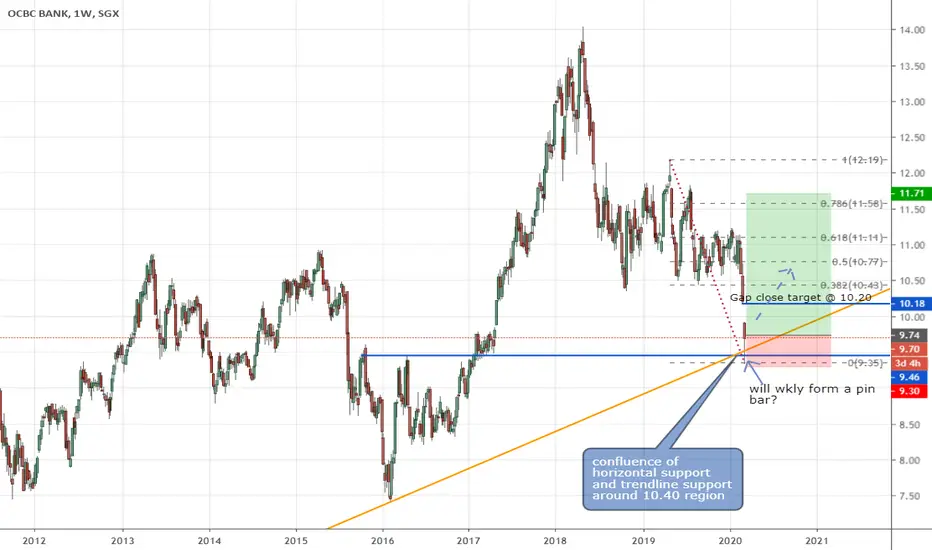
OCBC Bank - time to nibble?The banks have been selling off due to a lower interest rate environment which now gives rise to the opportunity for some short or swing trade at smaller risk levels.
OCBC Bank hit into a long term trendline support as well as a med term horizontal support this morning and is now bouncing off these supports. I will be going long with a stop just below this morning's low of 9.35 and is looking to take partial profit at the gap close 10.20 or swing for higher with trailing stops.
Disclaimer: This is just my own analysis and opinion for discussion and is not a trade advice. Kindly do your own due diligence and trade according to your own risk tolerance. Trade safe! Thank you.
CityDev - from a Short to a Long now?CityDev suppassed the H&S target on the way down yesterday and hit just 0.15 short of a mid term Trendline support. The market is likely ripe for some rebound (after yesterday's "black for swan" event!). However with the SL just below the trendline @ 9.70, which is a little farther away then I am comfortable, I would only put in half position @ 9.00 and if I don't get stopped out I would be looking to scale out along fibo levels on the way up.
Disclaimer: This is just my own analysis and opinion for discussion and is not a trade advice. Kindly do your own due diligence and trade according to your own risk tolerance. Thank you.
