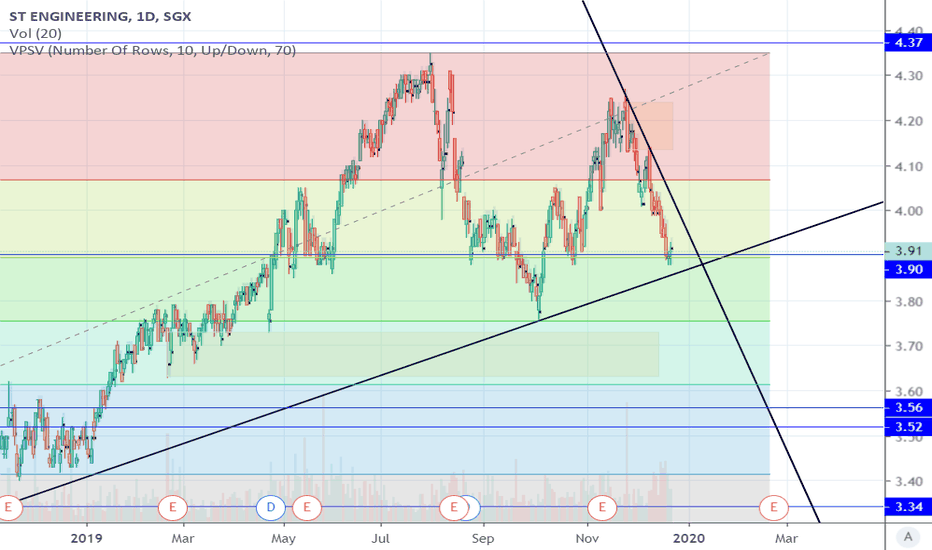
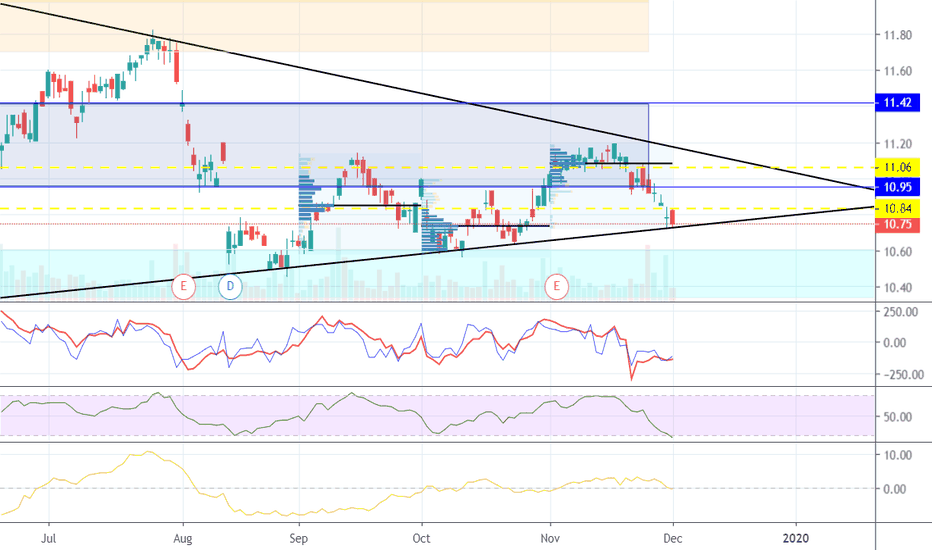
YZJ - Potential non ideal - Gartley Bullish PatternPotential Gartley Bullish Pattern on daily chart may have form. However, the ranges of XD is away from the ideal 0.786 nor D is in the ideal 1.27 fib range.
This is not financial advise.
Note: It will be good to always understand the risks involve in trading. Always trade with stop loss in place.
P5 Capital - Potential Boom - Ascending Triangle P5 Captial Holdings Ltd is an investment holding company. Since July 2019, the stocks is on the rise. The stock price is highly volatile over the past months. On a higher time frame, it is in the descending broadening channel. In shorter time frame, it shows potential triangle breakout towards higher price.
Technical indicators are positive in short time frame.
Do you think this rise to $0.04 and pull back to $0.025? Let me know in the comments section! :)
Note: This is not financial or investment advise. It will be good to always understand the risks involve in trading. Always trade with stop loss in place. If you like the analysis, please click on "thumbs" u; "like" button. Thank you.
Long Comfortdelgro TP 2.34 to 2.36
Entered 2.27
Hit a strong support at 2.26 and reject
near low end of channel
hit trendline and reverse
short term trade
oversold
good dividend stock
Negative
long term is still looks downwards
inflationary environment is not good for transport stocks in general due to higher fuel cost
SGX (Buckle Up!)Updated View On SGX (10 Jan 2020)
Recently SGX is meeting some bump in it uptrend move.
I believe it is pretty normal to have a pullback as it rose too fast to sustain.
It will swing back a little lower first and it shall rise again.
I expect $9.07-$9.20 will be some tough resistants to break.
DYODD, all the best and read the disclaimer too.
Feel Free to "Follow", press "LIKE" "Comment".
Thank You!
Legal Risk Disclosure:
Trading foreign exchange or CFD on margin carries a high level of risk, and may not be suitable for all investors.
The high degree of leverage can work against you as well as for you.
Before deciding to trade foreign exchange you should carefully consider your investment objectives, level of experience and risk appetite.
The possibility exists that you could sustain a loss of some or all of your initial investment and therefore you should not invest money that you cannot afford to lose. You should be aware of all the risks associated with foreign exchange trading, and seek advice from an independent financial advisor.
DISCLAIMER:
Any opinions, news, research, analyses, prices or other information discussed in this presentation or linked to from this presentation are provided as general market commentary and do not constitute investment advice.
Sonicr Mastery Team does not accept liability for any loss or damage, including without limitation to, any loss of profit, which may arise directly or indirectly from use of or reliance on such information.
IFAST - Bearish Reversal with slow accumulation phraseUsing Bollinger Band and the combination of the Relative Strength Index (RSI) above will help us to better time our entry and exit points. RSI is a momentum indicator that measures the magnitude of recent price changes to evaluate overbought or oversold conditions in the price of a stock. A reading close to 70 can be interpreted as overbought or a bullish trend reversal. While a reading of 30 can be interpreted as oversold indicating a bullish trend reversal.
In August 2019, we have seen signs of oversold in the RSI indicator hovering below 30. The lower limit Bollinger band has been a helpful supporting line supporting and stabilizing the price between $0.99 to $1.03. This stock has been going into accumulation phrase with buyer slowly buying stock in slow motion through the time and sales. We do not see opportunity in doing short-term scalping for sideway range movement as the range is small. We might see a breakout soon, as the Bollinger bandwidth getting smaller and smaller which is also known as Bollinger band squeeze. With a Bollinger band squeeze, there will be a potential breakout ahead. In this case, we will favor a strong upward move with the oversold RSI confirmation. The entry price will be between $1.01 to $1.04 with a first level take profit of $1.20. We will set a stop limit @ $0.96 to limit potential downside risk in case there is a heavy selldown that invalidate our analysis.
OCBC - SL @ 2ATRLaggard Stock among the 3 local Singapore Banks: DBS, OCBC and UOB.
Cleared the 1st hurdle (above moving average, cloud and downtrend resistance line). '
Will it be able to clear 2nd hurdle (maintain above the 1st hurdle, clear the 11.19 level and the next downtrend resistance line)?
Bull run - Wave 3 of Wave 5?Suspected wave 3
Wave 1 to 2 - retracement of 0.618
Wave 3 - reaching 1.618 to 2.168 range (under monitoring); wait for Wave 4 entry.
3 EMA crossover (22, 55, 100) = positive
E.W invalid if Wave 4 retrace > wave 1
RSI entering > 70 (potential range RSI - 70 to 90; high risk - past history shows up to 90 for AEM; either wave 3 continue or wave 4 in progress)
Trade with stoploss measures. Please support with thumbs up if you like the analysis. Thank you for your support. :)
COSCO SHIPPING SG (F83)Last trading price at S$0.315.
Currently the price at major support line which is located at $0.320, if the price stable at this level, $0.43 will be the first target.
Momentum kicked in last month with positive volume, we shall see some bullish movement from this level.
Target price - $0.43, $0.48, $0.60 and above
Cut loss - below $0.27
Disclaimer: Analysis or results above are solely based on personal opinions. Trade at your own risk.
View on Singtel (21/11)Bigger picture still bullish .
Unless price break below 2.97
Maybe a new HH to hit 3.65 in the long run.
Disclaimer:
The information contained in this presentation is solely for educational purposes and does not constitute investment advice. We may or We may not take the trade.
The risk of trading in securities markets can be substantial. You should carefully consider if engaging in such activity is suitable to your own financial situation.
We,Sonicr Mastery dot com is not responsible for any liabilities arising from the result of your market involvement or individual trade activity
<TradeVSA> Premium Alerts Buy Signal 10:30am - 18 November 20191. 7029, MASTER
2. 8176, ATAIMS
3. 3565, WCEHB
4. 5142, WASEONG
5. 5165, HOKHENG
6. 0005, UCREST
7. 0196, QES
8. 0001, SCOMNET
9. Z59, YOMA STRATEGIC HOLDINGS LTD
10. 544, CSE GLOBAL LTD
Disclaimer
This information only serves as reference information and does not constitute a buy or sell call. Conduct your own research and assessment before deciding to buy or sell any stock


