


V03.SGX_Bearish Reverse Trade_ShortENTRY: 17.50
SL: 18.04
TP: 16.96
- ADX>25
- Daily RS +ve
- Daily FFI +ve
- Weekly RS -ve
- Weekly FF -ve
- Weekly timeframe shows lower highs and lows.
- Reversal to uptrend since 28 Oct 2022 and currently seems to reach the peak.
- This is a reverse trade.

Nanofilm, chasing the momentum (MZH)(SG Market)This is pure chasing of momentum. It seems like the resistance at 1.400 is broken with sufficient volume backing it. Volume increased on both buying days, denoted by the green arrows.
We do have a significant selling volume on 04 Nov 2022, hence the first TP is at 1.680.
If the price managed to break above 1.680, then this would signify that 04 Nov 2022 is a selling climax and the bottom is in. However, we do not want to assume things too soon, hence a small long position is safer to chase the 1.680 price target. If the price shows strong support beyond the 1.680 level, we can add additional positions.
This is a counter-trend trade against a restrictive macro backdrop. As such, this trade is considered contrarian. If you are already prematurely bottom picking various other trades, you may want to skip this

DBS rallies ahead of tomorrow's earnings reportThe stock has been performing well ahead of its earnings reports, thanks to the news that DBS will be the bank to utilise MaxxDigital – a digital asset platform that provides risk and FX solutions for institutions. Whilst Singapore’s regulators continue to clamp down on crypto trading for retailers, Singapore wants to become a digital-asset hub within the financial sector – and this could be the first step of many which help them do just that.
DBS rose 3.6% on Friday following the announcement and has extended those gains to around 6% at the time of writing from Friday’s low.
According to Reuters, 13 analysts recommend DBS stock for a ‘buy’ (4 of which are a strong buy) with 4 holds and no sell recommendations. The stock currently trades at 34.58 and has a median price target of 39.11 (+13%).
DBS Daily Chart:
The daily chart shows that DBS performed a strong breakout (with high volume) from its sideways range after prices found support at the 200-day and 50-day EMA’s. And that suggests it could be part of the bullish trend from the July low. However, there are a couple of warning signs that it may need to retrace a little before continuing higher.
A bearish pinbar formed on Monday with low volume, and yesterday’s price action struggling to convincingly push higher. Gap resistance, $35 and the monthly R1 pivot point are nearby and RSI (2) is overbought - which can indicate a near-term turning point. With that said, the RSI(14) is over 50 and trending higher with prices, which is another reason we suspect any move lower is part of a retracement before prices head for the high around 36.30.
Of course, earnings can be full of surprises and we may need to see DBS beat estimates for it to trade directly higher. Otherwise – assuming earnings is not too disappointing – it could help with a desired pullback, where we would seek bullish setups around the monthly pivot / prior breakout range.

Rejected at 200. consolidation for a while ?Rejected at support.
Will fill the gap before moving on.


BS6.SGX_Bullish Breakout Trade_LongENTRY: 1.27
SL: 1.16
TP: 1.35
- ADX>25
- Daily RS +ve
- Daily FFI +ve
- Weekly RS +ve
- Weekly FFI +ve
- Moving averages are aligned.
- First breakout from range on 22 Sep 2022 with volume before retracement to resistance-turn-support area (1.03) and rebounded with volume on 6 Oct 2022.
- Breakout today from ascending triangle pattern.
- Entry today based on breakout and >3% rebound off 10EMA with volume.
- Watch out for earnings in coming days.

Incentives to get out of the house Read this latest news here
Of the biggest comfort and relief to most people (including me) , I think it would be taking off the mask when we are outdoors ! We have been wearing it for 2 over years , a long time ........
People will flock to the bars, restaurants, hotel cafeterias, etc to resume their usual life once again and business in this sectors will roar again. And the private hire car business , taxis services will be in demand again. Those who drink are not going to drive and they would need the service.
Visits to friends' place will increase to 10 , that would increase the number of social visits on weekends for extended families.
From chart wise, it has broken out of the bearish trend line, so no rush , wait for a pull back and start to accumulate slowly......
p/s: 1.33 price level has proven to be a very strong support so I doubt it is going to break below that.

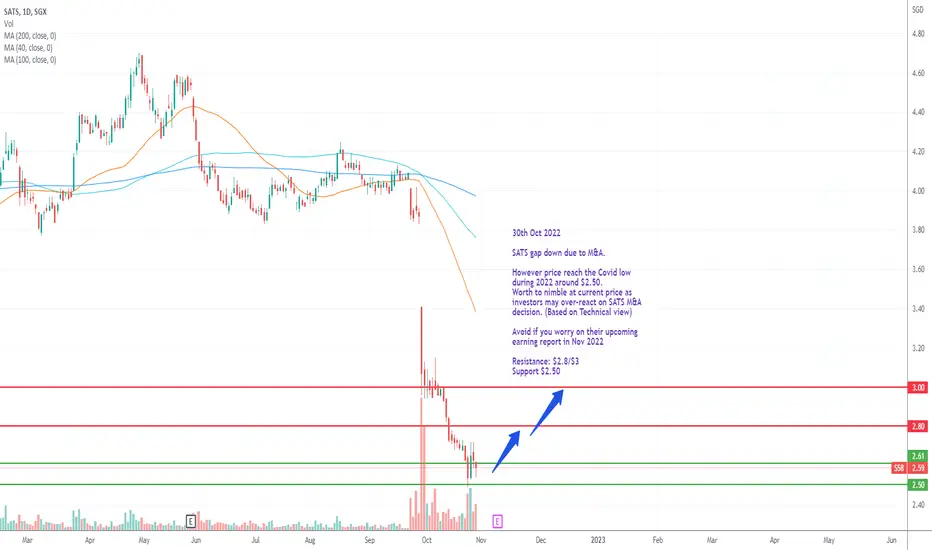
SATS Bias more on upside from chart perspective30th Oct 2022
SATS gap down due to M&A.
However price reach the Covid low during 2022 around $2.50.
Worth to nimble at current price as investors may over-react on SATS M&A decision. (Based on Technical view)
Avoid if you worry on their upcoming earning report in Nov 2022
Resistance: $2.8/$3
Support $2.50
E28.SGX_Bearish Pullback Trade_ShortENTRY: 0.840
SL: 0.965
TP: 0.805
- ADX>25
- Daily RS -ve
- Daily FFI -ve
- Weekly RS -ve
- Weekly FF -ve
- Moving averages are aligned.
- Breakdown on 13 Oct 2022 and tried to pullback in the next 2 days with resistance from support-turn-resistance area (0.900) and 10EMA.
- Entry based on today breakdown, >3% from 10EMA and engulfing red candle.


AEM - Could attempt a risky buy AEM shows strong selling momentum this morning but with the volume creeping up. It is likely that there will be a short covering. As such, we could initiate a buy and aim for the 1st target at 3.91


ST Engineering with more room downwardsLook like a bearish trend with more room downwards.
Support at 3.2, 3.0, 2.75 respectively and eventual target at 1.85.
As usual trade with caution.

BS6.SGX_Bullish Breakout Trade_LongENTRY: 1.03
SL: 0.97
TP: 1.09
- ADX>25
- Daily RS +ve
- Daily FFI +ve
- Weekly RS +ve
- Weekly FFI +ve
- Moving averages are aligned.
- Breakout from 52wks high today with volume .
- Entry today based on breakout.

YZJ FIN - Reversal is coming ?Sign of Strength in the chart:
1. Reversal with high volume
2. Volume increase above support level
Disclaimer
This information only serves as reference information and does not constitute a buy or sell call. Conduct your own research and assessment before deciding to buy or sell any stock

YZJ - Breakout from SupportSign of Strength in the chart:
1. Bullish signal with volume
2. NS signal with Pullback
Disclaimer
This information only serves as reference information and does not constitute a buy or sell call. Conduct your own research and assessment before deciding to buy or sell any stock

DBS (Weekly) - Bull Signal Back to the chartSign of Strength in the chart:
1. Reaccumulation with Bullish Signal
2. Strong uptrend
Previous Bullish Signal gained +46% and +18%
Disclaimer
This information only serves as reference information and does not constitute a buy or sell call. Conduct your own research and assessment before deciding to buy or sell any stock

BANYAN - Reversal with PullbackSign of Strength in the chart:
1. Reversal with Bullish Signal
2. Pullback with NS signal
Disclaimer
This information only serves as reference information and does not constitute a buy or sell call. Conduct your own research and assessment before deciding to buy or sell any stock

OCBC - Expect another Round ?Sign of Strength in the chart:
1. Gap up with Reaccumulation
2. Bullish signal in the chart
Disclaimer
This information only serves as reference information and does not constitute a buy or sell call. Conduct your own research and assessment before deciding to buy or sell any stock

