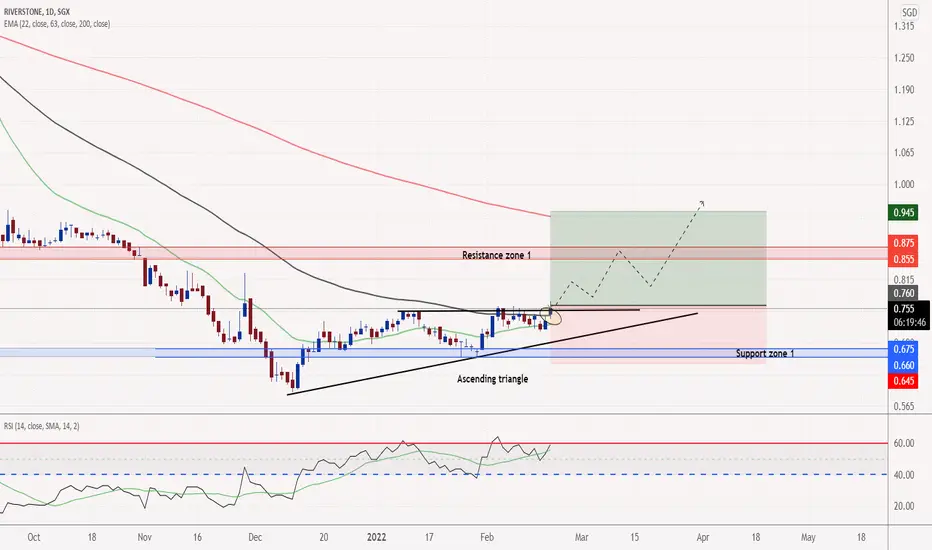
Long Riverstone! Three bullish golden cross spotted! Ascending triangle is poised for a break-up. However, 0.855 resistance zone must be carefully looked out for!
HRnet (SGX:CZH) - Return of the 5th impulse waveSince completion of the double three corrective wave, the return of the bullish trend is ongoing with recent price action suggest that the inverted head and shoulder is likely to be confirm after Thursday strong bullish candle close.
Ichimoku shows initial tenkan/kijun-sen crosses. Once kumo twist for the bulls. All is set for a bull run.

<TradeVSA> Stopping Volume in SGX !Sign of Strength in the chart:
1. Reversal with Green Market Stages
2. Climatic Volume with Sign of Strength
Disclaimer
This information only serves as reference information and does not constitute a buy or sell call. Conduct your own research and assessment before deciding to buy or sell any stock


Semcorp Industry, not really a strong buySemcorp Industry got its happy ending after divorce from its toxic marriage with Sembcorp Marine. Price has been up ever since. In fact, we had a previous buy call back in April 2021. It hits our TP level of 2.20 back then, and it is now trying to re-test the resistance at 2.30 again.
Whether it can break the resistance or not, we cannot say. However, as long as the price is maintained above the support level of 1.63, Sembcorp Ind remains bullish. It could consolidate for months or years before it can break out, nobody knows. Hence holding power is important because there is no analysis that can predict time. There is also another major resistance at the 2.50 level, which makes it less attractive to other available options out there.
On the bright side, it does have a dividend yield of 3.0% at its current price. So you're not really "losing" for holding if the price goes sideway for a prolonged period
Verdict: If you wish to buy, make sure you can hold. I, personally will look for better options.

rise up
SINGAPORE (May 6): Sunningdale Tech, the precision plastic manufacturer, reported 1Q2020 earnings of $2.4 million, up 205.3%.
Excluding the impact from foreign exchange, retrenchment costs, and other items, Sunningdale’s core net profit would have been $0.3 million for 1Q20, down 86.3% y-o-y.

PropNex (OYY:SGX): Earnings OptimismAnalysis Forecast:
Expect to Retest Resistance at S$2.20
Analysis is For:
Swing Trading - Generate Portfolio Alpha
Supporting Technical Observations:
1. Sign of Strength (large volume on buy up day)
2. Fund Flow Index (FFI) Turned Positive
3. Stochastics Bullish reversal
Stop Loss
If PropNex breaks below S$1.90, expect trend continue to consolidate or turn bearish

DBS Group Breaking 3-year High? Analysis Forecast:
Expectations of Breaking 3-year High Towards S$33.00 area
Analysis is For:
SG Market
Position Trading (Momentum)
Single Stock Tactical Allocation
Supporting Technical Observations:
1. Price is developing bullish character
2. Fund Flow Index (FFI) improving
3. Performing relatively stronger than STI (market index)
4. Developing Bullish Character
Stop Loss
If DBS breaks below S$29.45, expect further mark down

Vicom out of the woodAfter 2 years of bearish trend, this stock has finally broke out of the bearish trend and is now sitting quite nicely at the support level around 2 dollars. This is not a fast moving growth stock so investors with short term objectives might not find it attractive. Again, I have emphasised the importance of having a global portfolio of both growth and defensive stocks.
Can you imagine a football team of only strikers and no defenders ? There will be time when the opponent bypass the strikers and it would be too late ..........

Stable, good dividends Company to investThere are so much hype about the global inflation stories ongoing every day that could create too much noise for investors.
I find financial institutions with good dividend payout, stable cashflow and a proven business model attractive as a form of defensive play. Great Eastern happens to be one of them.
After 2 long years of downtrend, it has now settled at the resistance turn support level at 20.48.
I expect price to continue going up slowly and nicely over the years.

A speculative play - Medtechs InternationalWithin 2 days of the new variant , OMICRON virus being spotted , the news splashes everywhere. Here , in the Stock market, some stocks are raking in abnormal returns on this piece of news.
Meddtecs International which makes personal protective equipment soared more than 80% within the last 2 days .It has now retreated to 0.415 level and if more bad news, rumours start to fly or more cases of people contracting OMICRON or death ensues, then , we can expect this stock to continue climbing......

Feeling the pinch of INFLATIONMany people are feeling the pinch of inflation - from food to transport to clothing and almost everything you wanted in your life.
Below are some of my own suggestions to beat this extra costs of living :
1. Go meatless - be it faith based or for the sake of health, there are sufficient research to prove that going on a meatless diet is good for our human body. Err... but the costs of veggies are high as well. Yes, but when compared to meat, it is lower and you can have a lot of different varieties to compensate.
2. Get fit - Find an exercise that you really like doing. Not just that but one that you can do it alone ,especially during this Covid pandemic. I find swimming, running , walking in the park good exercises to do. I can do it at my own free time and very affordable (swimming in SG). When you are fit, you help defray the costs of medical costs especially symptoms like flu, cough and fever.
3. Spend less, Invest more - When I say spend less, I am referring to your wants. There are going to be temptations , no doubts about that and it will corrupt and influence your mind on your purchases. Limit yourself to that. Spend more time researching on the good stocks you want to invest in. Save more money so that when rainy days come, you have a buffer and also able to participate in the market when opportunity arises. When market corrects, your capital appreciation on paper is going to suffer, so you would need strong dividend companies (offering 5-8% yoy) to tide you through.
Hope this is helpful to some of my followers !

OYY.SGX_Downtrend Line Breakout Trade_LongENTRY: 1.92
SL: 1.59
TP: 2.21
- ADX>20
- RSI>50,RSI<70
- Daily RS +ve
- Daily FFI +ve
- Daily MACD +ve
- Weekly RS +ve
- Weekly FFI -ve
- Weekly MACD -ve
- Reached high on 15 Jul 2021 and retracing since then.
- 6 Oct 2021 breakout of downtrend line with high volume.
- Today break above HVN and another downtrend line with high volume.
- Showing buyers in control since Oct 2021 with high volume green days and retracement under lower volume.

Ascott TrustWith more Vaccinated Travel Lanes opening and moving from pandemic to endemic, I would see that Ascott recover.
Confirm uptrend if price breaks above 1.15 prive level. First Target 1.32, Second Target 1.59
U.S. trading at all time high and hence, do trade with caution as usual.

F83 Cosco long and tp at 0.485Cosco is a logistics company backed by China Cosco, a SOE. With increasing profits, improving balance sheets, improving COVID situation in South East Asia, the company shares may potentially appreciate further.

Idea - Bukit Sembawang - long ideaEarnings tomorrow
Looking to buy at market - good yield and low P/E
Operating income continue to grow, balance sheet continue to strengthen and the ROIC is above 10%
Book value 5.73 per share, has been growing over past 3 years
SGX:B61

look forward to selllook to sell and due for multiple falls. Traders on side could watch. I would believed more are buying plying up on it and perhaps im wrong that it may rally higher but for now im betting on a sell.

look forward to upsideSGX:V03 sell and buy at 18.29. This selling will not have more sellers above after completion, if the price stops at 18.29 and does not fall below i would say is a chance to long.

BSL_Long on low volume dry upBIC on Wkly + Daily
Exceptional low volume on 7 Oct 21
Entry: $1.47
SL: $1.36
TP1: $1.66

BSL.SGX_Range Breakout Trade_longENTRY: 1.47
SL: 1.38
TP: 1.62
- ADX>20
- RSI>50,RSI<30
- Daily RS +ve
- Daily FFI +ve
- Daily MACD +ve
- Weekly RS +ve
- Weekly FFI +ve
- Weekly MACD +ve
- Retraced to 38.2-50% fib level since breakout in Jul 2021 with lower volume.
- Breakout of range and HVN on 30 Sep 2021 and moving with higher volume since then.
- Today shows possible selling dry out with extremely low volume.

SIA amongst 8 STI components in UPTREND, next target $7.05SIA gapped up to hit an intraday high of 5.62 on 111021 and is now in a multiple timeframe uptrend.
Long Term BASEFORMING since 150321
Medium Term UPTREND since 111021
Short Term uptrend since 041021
PIVOT 5.22
long positions above 5.22 for 7.05 and 8.65
Short positions below 5.22 for 4.80 and 3.58

AIY.SGX_Retracement Trade_LongENTRY: 9.55
SL: 8.91
TP: 10.10
- ADX>20
- RSI>50,RSI<70
- Daily RS +ve
- Daily FFI -ve
- Daily MACD -ve
- Weekly RS +ve
- Weekly FFI -ve
- Weekly MACD -ve
- Retraced to 61.8% fib level, and rebounded on 8 Oct 2021 with volume.
- Looks like volume dry up today after yesterday selling volume, which is a possible bullish sign.
- Earnings on 21 Oct 2021 to watch out for which should be good based on the numerous news they accumulated over the months.

SIA VTL : Singapore Airlines looks for $5.72The short term charts are long $5.05 on the dailies on 041021 with a target of $5.72, the week supertrend resistance in the near term.
A break of $5.72 above will confirm the recovery bounce on the Monthly Charts that seeks to move back to $7.05, the break down level since 3rd August 2018 putting SIA into a 3 year downtrend.
Long Term BASEFORMING since 150321
Medium Term BASEFORMAING since 100521
Short Term uptrend since 041021
Pivot 4.84
Long positions above 4.84 for 5.72 and 7.05
Short positions below 4.84 for 3.32
