The fate of private education in SingaporeAs a parent living in fast-paced Singapore, it is relatively a common practice to have private tuition or enrichment programs for your school going kids.
With the recent clampdown in the China education sector, would we see a similar pattern happening in Singapore ?
To be fair, the 3 listed companies are not so much into enrichment programs but more towards academic courses like IT , math and so on.
Would you want to invest in these companies ? DYODD

<TradeVSA> Re-accumulation Completed with NS Sign of Strength in the chart:
1. NS Signal as Support
2. VCP setup
3. Pocket Pivot
Disclaimer
This information only serves as reference information and does not constitute a buy or sell call. Conduct your own research and assessment before deciding to buy or sell any stock

potential bottom on Nation's internet provider Singtel Looks like a deep bottom for Singtel.
Reversal forming..

SGX: Tianjin ZX Cup & Handle FormationI have no loyalty to any specific market. I only pledge allegiance to the market with high opportunities to make profit. Tianjin ZX looks like completed a cup & handle formation. If it can break 1.10 , based on the depth of the cup, 1.38 could be a possible price objective.

my first foray into Union Gas, taking adv of recent discountssee day chart
pls do your own due diligence
increased revenue, low debt, expansion into acquistion, making forays into Cambodia markets

[Analysis] iFast (AIY)(SG) Bullish but, plan for averaging downDespite the recent 19% retracement from the All-Time High of 9.680 to a low of 7.80, iFast is still extremely Bullish in terms of a long-term trend.
As investors or even mid-term traders, one's strategy should always account for such a level of retracement.
The current support level is at 7.770 to 8.00. If you are looking to purchase at a lower price than the current price, this is the level that you should be looking at. When dealing with uptrend stocks, it is never wrong to buy in at the current price because you do not want to risk missing out on an entry when it suddenly rallies to a high price. However, most investors mistake putting up all the funds available and not accounting for a possible retrace. If the price does retrace, you will want to take advantage of the lower prices by averaging down. This assumes that your risk on all of your positions (including averaging down) is within your tolerance.
The next support level is at 5.500-6.500.
Beyond 5.500 is bear territory, and you should not hold beyond that. Hence you can work out your risk and entry strategy using 5.500 as a cut-off price.
I personally like to go the 40-40-20 route.
40% of the allocated fund at the current price
40% of the allocated fund to average down at first support
20% of the allocated fund to average down at second support (lesser weightage as chances if price reaching that level is not high)
If the price goes below 5.500, you have to ensure you are within your risk tolerance for 100% of your position.
"Plan the Trade"
"Trade the Plan"!

<TradeVSA> SGX - Clear Sign of Distribution with Red PentagonSign of Weakness in the chart:
1. Red Pentagon high volume
2. Price drop 20/40ma with high volume
3. No demand
4. No reversal with Sign of Strength
Disclaimer
This information only serves as reference information and does not constitute a buy or sell call. Conduct your own research and assessment before deciding to buy or sell any stock

OYY.SGX_Range Breakout and Retracement Trade_LongENTRY: 1.98
SL: 1.80
TP: 2.20
- ADX>20
- RSI<50,RSI<70
- Daily RS +ve
- Daily FFI +ve
- Daily MACD -ve
- Weekly RS +ve
- Weekly FFI +ve
- Weekly MACD +ve
- Accumulation signs today from consolidation zone after retracement

Ascott Trust is cheap and give 3,98% Dividend todayThis REIT has a stable sidewards trend in the last years with a dividend return of more than 4% for a long time.
In corona the dividend lowered and even now gives 3,98%:
pasteboard.co
A rise back to higher levels, with about 0,03 SGD per Quarter or 0,12 SGD, should be possible, which would open the possiblity to 12% of dividend yield return.
Grow of real estate assets is financed with new shares, so the stock price is very stable sidewards without any growth. All profits goes directly in dividend... and bookvalue is stable at about 1.12
pasteboard.co
So the current price is near book value, which make it a good price right now.
pasteboard.co
My assumptions are that the dividend on this stock will raise again, which make it even right now an affordable REIT.
The company is stable and has a good outlook.
So I give this stock a long

Mercurius: Holding at a cluster zoneLonnnnnggggggg long time ago, a call was given for this stock and it went as high as 0.105. It has now retraced down to a cluster zone, if it holds properly. Might get back to the expected price target. (This is a long term trade)


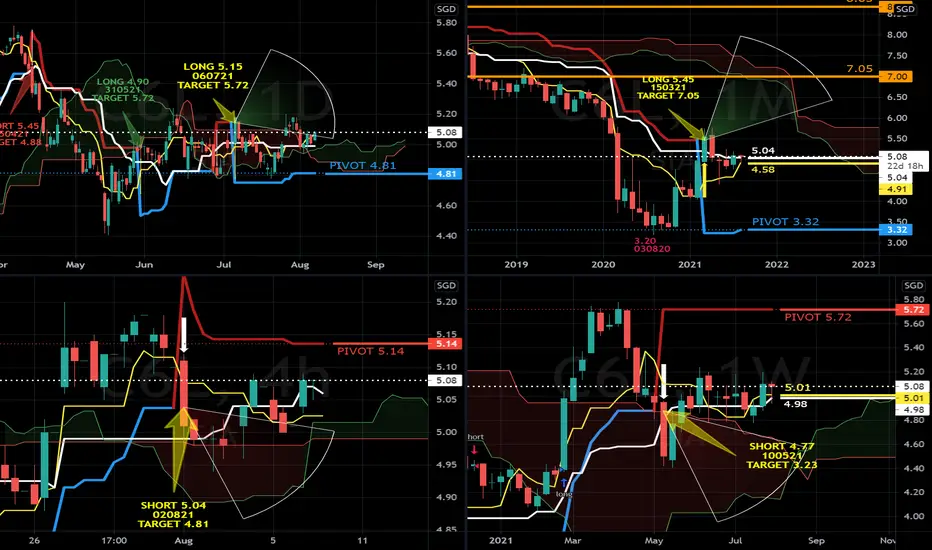
SIA targets targets $5.72Long Signal at $5.15 on 060721 holds valid as long as the daily supertrend pivot at $4.81 supports the range. The short signal on the weekly charts on 100521 at $4.77 will be negated if $5.72 is broken and held to the upside. A break of $5.72 will test $7.05, the breakdown level of SIA shares since 030815.
Long Term BASEFORMING since 150321
Medium Term BASEFORMING since 100521
Short Term uptrend since 060721
PIVOT 4.81
Long positions above 4.81 for 5.72 and 7.05
Short positions below 4.81 for 3.32
COSCO BUY when it breaks out of bull flagBUY when it breaks out of bull flag. With shipping prices staying elevated, this could be a good inflation hedge. Cosco is also adopting technology in its operation and should allow it to compete in the new era.

SGX - Sarine Tech - Further Upside to 0.925Breakout with Further Upside to 0.925 level.
Trade with Caution

<TradeVSA> VCP setup in ISDNSign of Strength in the chart:
1. Reaccumulation with VCP
2. Pullback with NS (Weekly chart)
3. Pocket Pivot
Disclaimer
This information only serves as reference information and does not constitute a buy or sell call. Conduct your own research and assessment before deciding to buy or sell any stock

BN4 KEPPEL > MA Support > LONG1) Daily Chart Mas upthrend
2) 3x tested 200MA
3) Wait for confirmation candle
Entry:5:29
TP: 5.6

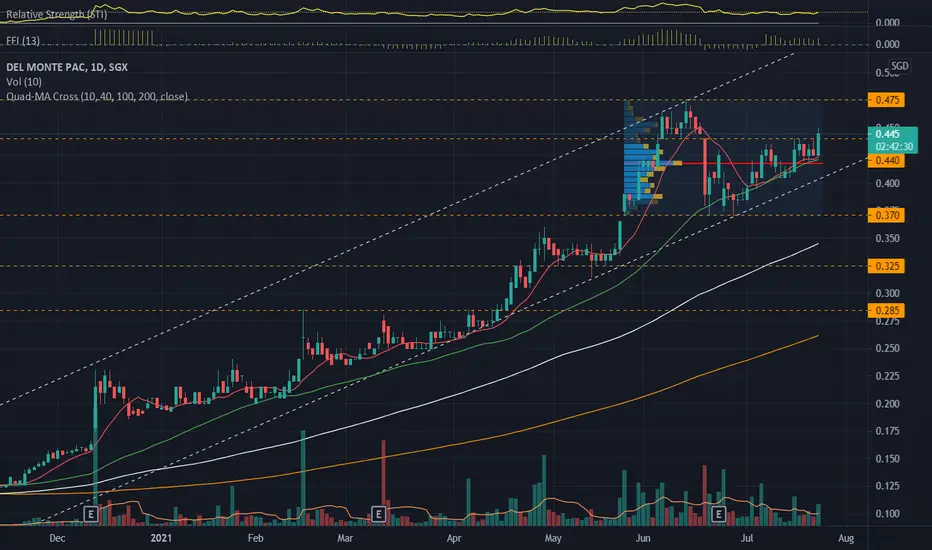
D03.SGX_Breakout and Retracement Trade_LongENTRY: 0.440
SL: 0.395
TP0: 0.475
TP2: 0.540
- ADX>20
- RSI<50,RSI<70
- Daily RS +ve
- Daily FFI +ve
- Daily MACD +ve
- Weekly RS +ve
- Weekly FFI +ve
- Weekly MACD +ve
- Ranging since 25 May 2021.
- Within the ranging, showing possible buyers in control with 3 green candles with high volume and retracement with lower volume.
- Currently above HVN
- MAs are aligned
[Analysis] SATS... is recovery on its way?From a long-term perspective, the low during Apr 2020 covid19 marks a higher low and creates major support at 2.50-3.00 level. Since then, prices have rebounded more than 60% and eventually hitting the resistance of 4.60.
The price is now retracing lower and forming (seems like) a bullish flag on a smaller time frame.
We have a few things to take note of here.
1) The major resistance at 4.50-5.00 will not be broken anytime soon. Price will be met with supplies/selling at this zone. In the short/mid-term, this will be the target price.
2) Price is currently retracing, and we do not know how far it will retrace.
3) Anything below 2.50 is considered bearish, as we will be breaking the higher low.
As such, your best approach to taking this counter will be buying as close to the major support as possible, so you have room for profits. You can split your entries into two buy levels. One will be at 3.50, and the other will be at 3.00. This will ensure you will at least get one position in should the price decide to recover midway.
Needless to be said, you want to be out of this trade if it broke down below 2.500.
2021 FY earnings will be a key decider.

<TradeVSA> GKE Pullback with NS SignalSign of Strength in the chart:
1. Long period re-accumulation
2. Upbar overtake UT high volume
3. Pullback with NS signal
Disclaimer
This information only serves as reference information and does not constitute a buy or sell call. Conduct your own research and assessment before deciding to buy or sell any stock

Kimly observed to have some 'life' Buying Volume building up for 1 month. Showing signs of positive trending. First target as shown.

[Analysis] SIA, Too big to Fail?Struggling airlines have always been the target of bottom picking from Traders; simply because "It's cheap now!"
But is the risk worth it?
There is a saying in the stock market "Buy Low, Sell High".
Sadly though, the reality is usually "Buy high, sell higher" or "Buy low, sell lower"
We have seen from examples such as Sembcorp Marine that traders who chose to buy at $1.00 or even $0.500 because it is cheap, are facing rights issues and paper losses.
SIA is a national carrier. The government will not let it fall. But, they will only support it so much it keeps it alive. This means there is a high probability for future financing events such as more rights issues, new shares replacement, perpetual bonds, etc.
This would mean SIA is indeed too big to fail but, it will have a very very hard time seeing its glory days of $14/share ever again.
Too big to fail does not equate to higher share prices. In fact, it could continue to plunge in order to raise money to keep it alive.
Major resistance is at 7.00. We do not believe SIA will ever go back to pre-covid19 prices anytime in the next 5 years.
If you wish to have some stakes in SIA, you may do so in a safer way by proxy of STI ETF.

Long GKE 595long consolidation and major resistance break with higher relative volume
-things to note
-small cap , at 111mil SGD (small cap)
-Volume 32,822,700
-Avg. volume 4,420,133
- as of 31/3/2021 Short shares at 616.8k
-float: 85,145,000
- earnings arnd 27th July

DBS Long Breakout on volume.look to accumulate 30.60 and below.
risk takers consider chase on open 7/7/21
