ITX-LONGTERM VIEW 2k18 - BUYHey there!
My idea behind this chart is, the possibility to profit of an long term trade, by buying on the lowest of it's points.
Since the low of the ITX Chart is yet by approx. 26,7-27,9, it may be the best Idea to buy at These Points and sell at About the end of the year, by beginning of the winter Season. ( When Inditex companies Show their first buyable items for the winter Season).
DM me for further Information.
Best Regards,
Egzon Shabani


CORRECTIVE STRUCTURE in SANTANDER - Daily ChartHey Traders,
Another good opportunity in the Spanish Stocks. Looking for these moves in Santander Bank. Check last analysis I did in 2016 here on TV. It is attached :)
-
Hola Traders,
Otra oportunidad en Valores Españoles. Buscando estos movimientos en e Banco Santander. Chequead mi último análisis de TV en 2016. Esta aquí adjunto :)
Carlos

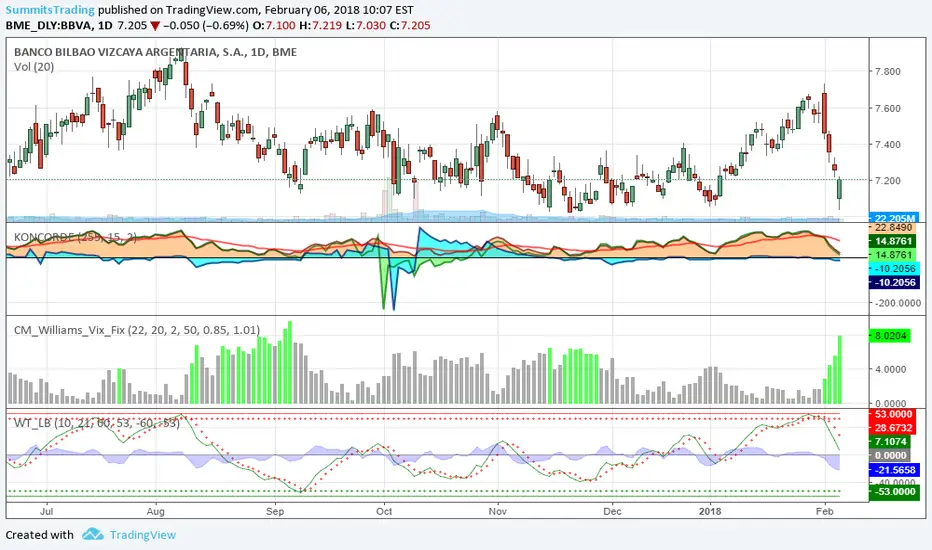
BBVA Bear FlagTaking a look at the 4h chart we see that the price action has found resistance at the 50 Ema as it crosses the flag formation. From here we should test the bottom of the bear flag, if support isn't found there, intense selling will occur taking the price action to the target of 5-5.1.

BBVA is BBVA is making an inverse cup and handle formation, If this pattern plays out, we should expect to reach the 4.7 target around september-october where the rising support trendline (in black) is. This trend line has been spot on on giving targets, it connects the 3 lows from 2009, 2012 and 2016. There has also been a recent bear flag which projects a target at 5-5.1. We might get a small rally from there, although I believe 4.7 will be eventually reached.

THE BIG INDITEX - Daily ChartHey Guys,
As simple as this. Either Black (Plan A) or Red (Plan B).
-
Hey Chicos,
Tan simple como esto. O Negro (Plan A) o Rojo (Plan B).
Carlos

Falling knife at ITX, Long. At 23,93 there is an 0.382 fib retractement level from 2002. There also an AB=2.618*CD matching that level so I expect some rebound to the T1, 28.93 and T2 31.99.
I have taken some long position. Let's see next week.
GL


Compra por Maximos Historicos de CELLNEX TELECOM BME:CLNX
Accion del selectivo español con un rotura de sus Maximos Historicos, le colocamos STOP sobre 19.00 para controlar el riesgo.

Bullish breakout for NH Hotels, SpainRecent earnings release surprised to the upside and created a break-away gap that has not filled. In tandem with below patterns, paints a very bullish picture.
- Long-term view shows a 5-year ascending triangle (blue lines) that has broken out and retested.
- Medium-term view shows an 18-month inverted head & shoulders pattern (pink line) also broken out and retested.
Targets are 8.30 and 10.00 for the medium vs. long-term patterns respectively.

2-year cup'n'handle retested - ready to move upFairly clean cup'n'handle consolidation in an uptrend.
Broke out >6 months ago, and has now done a hard retest (on extreme US market drops). Looks like stops have swept aside.
Looks ready for a move up.
Minor descending wedge could be used an entry trigger.


BBVA Looking For New Highs.The share price has been 37 weeks on a lateral trend. It seems the bulls are gaining momentum and a visit to the €7.95 level is more than likely. A strong support can be found in 7€. I am LONG. Targets at: €7.95, €8.28 and a final €9.35.
Good luck fellow traders

FERROVIAL. New Opportunity To Follow The Trend.As mentioned in a previuos post about Ferrovial, a new hike of the share price was likely. After a first bullish leg, the share price has moved back towards a strong support. Long trading strategies are advisable again, with stop loss below €17.98.
Good luck fellow traders

CaixaBank returning up after elections in CatalunyaThe situation in Catalunya seems to return slowly to the normality, and so CaixaBank, going up to touch 4.51 first and then towards the historical maximum of 5.
Stay tuned!


Perfect paternBME:AZK
Take position on limit order 8.8
Stop loss 7.8
Take profit (50%) 9.81
+ Trend following

Perfect Patern !BME:AZK
She looks like a model :) , Momentum, pivot, volume, nice break out...
Limit order at 8.8 waiting for the break out confirmation;
Stop loss at 7,8
First take profit at 9,8 (50%) and then trend following to the moon

Ferrovial Do Not Disapoint Technicals The spanish construction company share price has been consolidating around €18-€18.50 in order to try to climb new highs. The first target can be expected at €19.49, €19.90, and then €20.79 and €23.38. Stops below €17.69.
