LONGLONG - ANALYSIS MADE BY ANALYSGUIDEN GIVES TARGET PRICE 24KR.
Goldman buying 1.5% of the stocks 7th of september.

Cibus, where will you go?OMXSTO:CIBUS
Hi guys,
I'm new to stock market. Trying out to see how the trendlines will work out: thinking 1´ it will follow trendline 1, if that is broken, 2, if that is broken then trendline 3. Hoping for a continued bull case for the near future.
See you in future!
Yours sincerely,
StockmarketNEWbie


CTM Analysis on daily and weekly timeframeTrend change confirmed above 29.20
The ascending triangle is broken in an upward trend
Targets at Fibonacci levels at 38.20 and 50
Potential for huge rewards!
Good luck!

Hexagon analysis on daily and monthly timeframeLong positions can be taken due to:
- Stock is above 200 periods moving average
- Inverse head and shoulder broken and in play
- Broadening wedge on monthly broken. Which is a very strong indication to take a long position
Long term target around between 825 and 850 remains in place

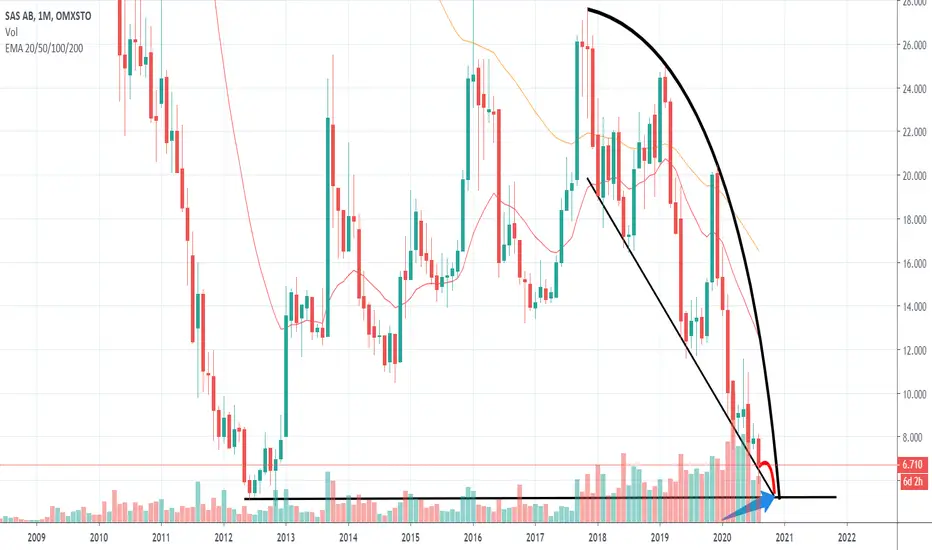
SAS - will not touch it, until...Will not touch any airline stock at the moment. Saying that, Ill keep an eye out for the 2012 low in June at about 5 Krone. Until then atleast I will stay away.
LIME - Lime Technologies, ugly hammer reversalCurious about LIME Technologies.
I think this is still a business which has huge potential, but with Covid19 Lime must be suffering as well and there financial numbers won't be great this year.
The hammer candle on the last daily close shows a potential reversal.
Furthermore we have TD Sequential signals in the weekly.
Let's find a longterm entry on LIME, maybe after all the turmoil about elections and covid19 is over.
Happy Trading!

Köp av SintercastVäntade på köp i Sintercast och följde trendlinje
Köp på 140kr
Stop loss 136kr
Håller på medelsikt


Electrolux B analysis on the daily timeframeElectrolux trend change confirmed to bullish based on the 123 trend change criteria on 8th July 2020. That also marks as the ascending triangle break.
Entered the trade on 27th July upon re-test completion of the ascending triangle. The overall ascending triangle target is 228.
My first target is at 198, which is just below the area of resistance.
18th August cup and handle pattern break suggesting a strong continuation trend
TARGETS:
198,214, 228
Stop loss:
147

Swing trade for MuntersStabile company Munters with positive earnings. Going for a trade after break out over 66 if we get a buy signal. Target idea of close to channel roof.
Not necessarily a parabolic rise.

Seems like FING_B builds an inverted head and shoulders!Hi!
This is my first analysis posted online, so don't be hard on me :)
After breaking an uptrend we entered a turbulent zone which looks like an inverted head and shoulders. If it is so it could take up to 60 days to close the right shoulder with 40% profit. As inverted head and shoulders is a bullish pattern we could expect price jump to 30kr (50% more from head and shoulders) a stock after its finished. Based on the dip of the head.
Any feedback is welcome!


A NICE OPPORTUNITY TO GO SHORT ON THE 15M CHARTAfter the bulls did finish their buy orders, now the bears are taking over. Wait for my signal when to get out of your selling positions!

ONCO keeping an eye on breakout.ONCO has been consolidating for quite a while. The reason I'm looking at it now is because it has just found support on the daily cloud (not on the chart displayed) and just arrived at the bottom of the weekly cloud. So now let's see if it will enter the weekly cloud.
Once it does, I see a bullish scenario unfolding.
I've drawn 2 potential scenarios;
Scenario ORANGE:
- We get into the cloud and test the bottom of the cloud.
- We fill the gap at 119.70
- We test the bottom of the large triangle one more time.
- Then we break above the cloud and the triangle, retest the triangle and off we go!
Scenario GREEN:
- We break straight into the cloud and through.
- Retest the cloud and then break the triangle upward with a retest.
So let's see what will happen!


ABLIVA TA - Swedish
Min syn på ABLIVA AB i nuläget.
Vi är i en ackumulerande trend som ses mha undre trendlinjen. Ett bryt neråt med mycket volym är något som kan vara farligt eller som @framgangsjakten nu kallar de shit and fly eller liknande 😂 där vi får ett bryt av den undre trendlinjen och sedan retest på den nyskapade resistansen.
Fortsätter ligga kvar för rapport om ca 2 veckor som kan ge den mer chans volymmässigt där vi ser hur den reagerar trendlinje messigt. Fortsätter vi sriga långsamt som vi gör är det bara att flytta sin stoploss alt ha en flytande som följer kursen som är ett väldigt bra sätt där man både har bra money/risk management men även har chans till en bra RRR. (Risk reward ratio).
Ej rekommendation endast min analys och hur jag tänker!
Ha en fin vecka! ☺️💯


