Swedbank stock trading ideaThis is my Second trading Idea in Swedbank stock, I think its possible to see 200+ in price soon. I could be wrong but my last Swedbank trade idea went perfect but I did not make any serious money on the trade because I pulled out to early and my warrants
i kept was in the money and it happen that final strike price ended just outside the cash then another big drop. I guess I have a lot to learn about trading, what instrument to use and plan ahead how to maximize wins and minimize losses.
I have tracked the reports of Swedbank many years back and I don't see any real danger yet, the danger I was looking for was if there is a increase in delay payments, there is but its not even close to a bad number yet. it did peak in 2016 but not anywhere close numbers of crash 2007/2008 (this number also lagging if i understand correctly)
So that leaves me thinking there is value to get in going long for a while.
I bought this 1 day before dividend and i used warrants.


FingerPrint Cards AB -SHORTToday's trading day have differently been to the downside and the bears. Might see the price drop even further - It just now might be a good short Chance

FingerPrint Cards - Update on LONG positionFingerPrint Cards has just now broken through the 21-period EMA, which shows a nice bull-strength. Compared to MACD which also rises in the same tempo as the price, but let's wait for the volume too. I would still wait for more confirmation. Properly if the buyers/bulls show strength and they can push the price up to 15.030. I would differently consider it as a good place to go LONG.


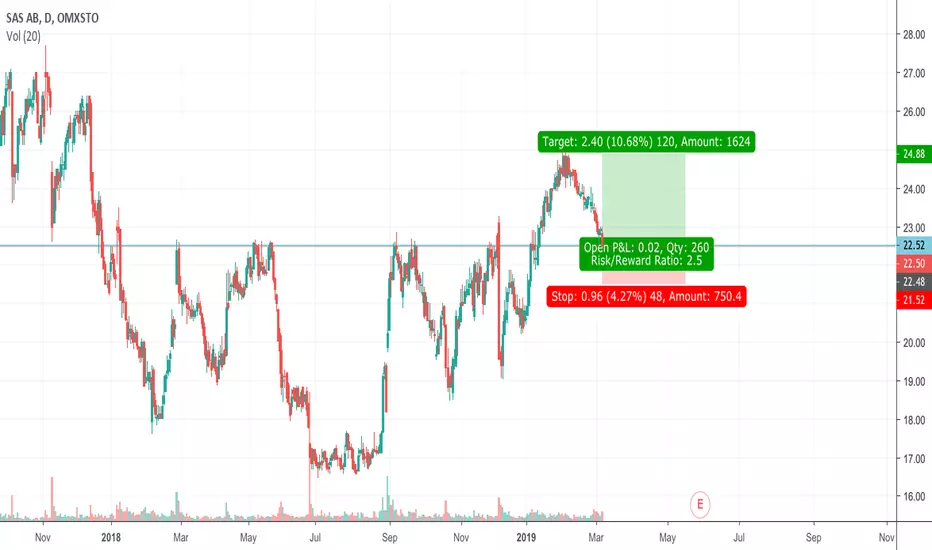
Going back up?I love the swing in this stock. I swings quite a lot, so there is tons of money to make of it. I think we will being heading back up to test 75, if it breaks, then look out 95.
I will set my stop loss close to the asking price since big drops have accrued.

Fingerprint Cards Ab - LONGFingerprint Cards (FING-B) has in a long time followed the trend-wave. If the price has enough momentum to trade up and over the EMA 21-period and have a closing candle above the EMA.
A long position in the price of 15.000 and a S/L beneath the EMA. If the price can move up over the EMA, the bull-buyers will have enough strength to raise the price.

Fingerprint Cards LONGGo LONG in FIngerprint if price brakes thought the EMA 21-period, with a closing candle above the EMA.

CLSNotice the trendshift in swedish stock CLS with significant volume increase during last week closing on ATH last friday. Strong triggers in april. Keep an eye on this one!


Cup & Handle Formed, wait for breakoutLooks like we have a classic cup and handle formed.
We had Volume dry-up on the way down and in the bottom of the cup and shaked the weak hands out. Then followed by lots of volume on the way up and dry-up again through the handle of the cup.
To minimize risk we need to to wait for volume to increase and break the resistance at the high of the cup and then the pattern will be complete.
Control your risk, have tight stops and targets in mind before entering a trade.
Disclaimer; this is not a trading advice, do your own due dilligence.

#clasohlson $clasFantastik move ahead ether we go straigth up ore down thru a fakeout as displayd in the pic.

Current range, plausible long into a shortMeh, just go with the trend.
We'll short the moneylaundering people soon, friend.


aiming for the fifth wave to completeI think this is what's happening on Amazon stock. SO I think we can expect another minor wave up to complete the five wave structure
Based on Elliot wave


Divergences in SHB, interesting short case. We can now se divergences in the 1h timeframe, i'm short in this case.
