ABBN - ShortABB broke the lower boundary of the trend channel. Rebound to the channel possible with target in the marked resistance area
________
🚀 Follow for daily posts
🎯 About my posts: They are kept self-explanatory in order to avoid overcomplicating and confusion. Mostly price signals and trend analysis combined with chart patterns.
Disclaimer: This is not an investment advice

Lonza - LONN• Strong correction in the last days
• Nice support at 644.6/652
• In the middle of the correction period there is a small flag which marked the midpoint of the move
• Does the support hold at 644.6/652 or do we see a further correction to the next support at 610.40/623.8?
• In my point of view an interesting level to build up a small position and waiting for the next earning publications on January 26

FHZN - The power of elliot waves Dear subscribers, lets come together for an educational article featuring the zurich airport. SIX:FHZN
We have published some articles about the Zurich Airport in the past and suspected back then a more bullish structure than this one which we are publishing now.
The Zurich Airport company operates and manages the eponymous Zurich Airport in Switzerland, which is the international transportation hub for the entire country. The company has an excellent management and the government of Zurich itself holds almost 38.38% of all shares. Therefore, Zurich Airport can always rely on government support and enjoys a good reputation.
In addition, the company is increasingly expanding into emerging markets and now owns Hercilio Luz Airport (FLN) in Florianopolis Brazil. For the future, it is therefore clear that the company is increasingly driving its presence abroad and expanding its business model.
However, the zurich airport stock provides an excellent example to introduce traders who are not familiar with the Elliot Wave method of analysis.
The stock has originally been around since 2000, but on Tradingview we only have access to the market data since the beginning of 2010, but this makes little difference to the current movement, as a huge 1-2 wave setup was also formed during the period 2000-2010.
Technical explanation of the Elliot wave structure:
The stock has experienced a huge price increase since 2012, which was supported based on a huge 1-2 (Orange) wave setup. From this structure, a large wave 3 was established, which additonally established a complete impulse of its own (dark green). After completing a short correction in wave 4, the stock first formed an impulse (light green) and ended the year-long bull market with a final impulse (turquoise)
Since then, we have seen a very hard downward impulse, which reached its absolute peak in early 2020 due to the Corona crisis. Since the last low at just under $83, the stock has been rising again in what we categorized as a wave B (yellow). Now, a wedge has formed over the last two years, which strengthens our assumption of a corrective B wave.
Finally, a breakout can be expected within the year 2022 and the stocj will correct with high probability back to 80$.
Disclaimer:
According to legal regulations, Mornau-Research is not a certified or legally recognized financial advisor and any transactions based on published content are at your own risk.
Mornau-Research cannot be held liable for any losses whatsoever according to the legal regulations in it's country of residence.
===============================================================================================================
If you have questions related to a specific stock or the Elliot Wave theory, feel free to contact us.

LOGN Falling WedgeI believe we have gotten out of a Falling Wedge, which could predict bullish price action for the following year.

UBSG Wyckoff AccumulationI believe the UBSG price has been contained in a Wyckoff Accumulation Range since 2008 and we could see a breakout to the upside in the next few years.

to keep in the portefoliothis is at the most up historic on this stock so keep in the portefolio or buy if you don't make

.666 it's either up or down from hereThe company has great products but is not selling well. The chart shows a moment of decision is up on us.

STRN breakout from multi-year downtrendStop if below 24 for 2 consequitive days. Target top of range (54). Now 26.

LOGN looking like bottoming out hereLOGN for a few days hugging trendline. if true will aim to close the gap at 87 before EOY. if trendline breaks look at the bottom trendline of pitchfork.

Weekly OutlookOn the Weekly Time Frame perspective, on FB, my bias is not clear, but i may consider a Long, based on the current price at the breaker block.
For past few weeks the Facebook INC stock value have been crashing, should we expect a further crash?
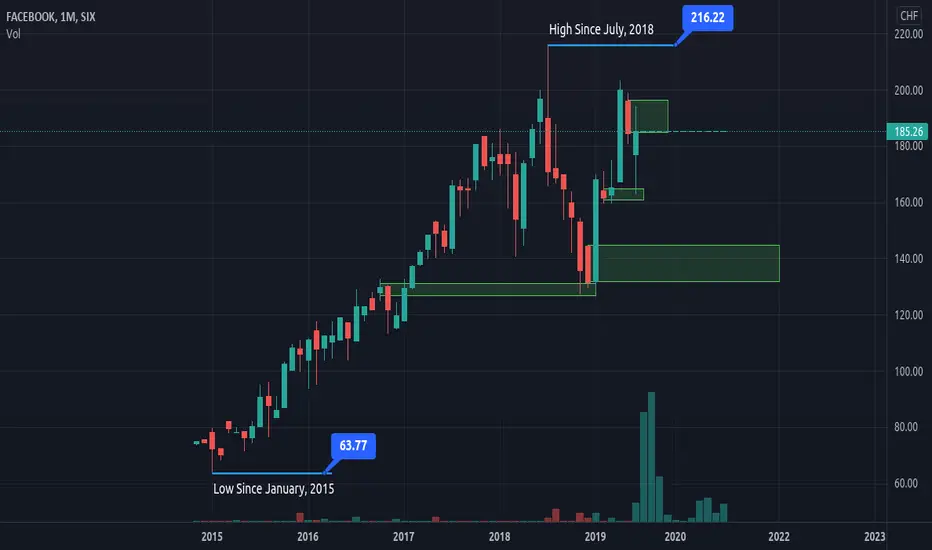
I perceive a resistance to be formed at the All time high(216), which may cause a fall in the price FB stock, I won't say a minor decline in price.
I'll rather go into lower time frame to take a trading decision.

Monthly OutlookThe social networking company Facebook, Inc. held its initial public offering (IPO) on Friday, May 18, 2012. The IPO was the biggest in technology and one of the biggest in Internet history, with a peak market capitalization of over $104 billion.
The low (63.77) at January, 2015, is due to the data provided by the Broker.
Facebook grew really fast, unlike other Technology Companies that grew gradually and steadily, thus it the stock falls fast as well, due to stock exchange, technical, economic activities and other factors.
If the stock can ever get to 138, I don't mind buying the dip and hold for a decade, lol.
MBTN: This may really just be the beginning...For more information about Meyer Burger, check out reddit.com/r/meyerburger

STMN Daily TimeframeSNIPER STRATEGY
This magical strategy works like a clock on almost any charts
Although I have to say it can’t predict pullbacks, so I do not suggest this strategy for leverage trading.
It will not give you the whole wave like any other strategy out there but it will give you huge part of the wave.
The best timeframe for this strategy is Daily, Weekly and Monthly however it can work any timeframe above three minutes.
Start believing in this strategy because it will reward believers with huge profit.
There is a lot more about this strategy.
It can predict and also it can give you almost exact buy or sell time on the spot.
I am developing it even more so stay tuned and start to follow me for more signals and forecasts.

UBSG Daily TimeframeSNIPER STRATEGY
This magical strategy works like a clock on almost any charts
Although I have to say it can’t predict pullbacks, so I do not suggest this strategy for leverage trading.
It will not give you the whole wave like any other strategy out there but it will give you huge part of the wave.
The best timeframe for this strategy is Daily, Weekly and Monthly however it can work any timeframe above three minutes.
Start believing in this strategy because it will reward believers with huge profit.
There is a lot more about this strategy.
It can predict and also it can give you almost exact buy or sell time on the spot.
I am developing it even more so stay tuned and start to follow me for more signals and forecasts.

LOGN Daily TimeframeSNIPER STRATEGY
This magical strategy works like a clock on almost any charts
Although I have to say it can’t predict pullbacks, so I do not suggest this strategy for leverage trading.
It will not give you the whole wave like any other strategy out there but it will give you huge part of the wave.
The best timeframe for this strategy is Daily, Weekly and Monthly however it can work any timeframe above three minutes.
Start believing in this strategy because it will reward believers with huge profit.
There is a lot more about this strategy.
It can predict and also it can give you almost exact buy or sell time on the spot.
I am developing it even more so stay tuned and start to follow me for more signals and forecasts.

GEBN Daily TimeframeSNIPER STRATEGY
This magical strategy works like a clock on almost any charts
Although I have to say it can’t predict pullbacks, so I do not suggest this strategy for leverage trading.
It will not give you the whole wave like any other strategy out there but it will give you huge part of the wave.
The best timeframe for this strategy is Daily, Weekly and Monthly however it can work any timeframe above three minutes.
Start believing in this strategy because it will reward believers with huge profit.
There is a lot more about this strategy.
It can predict and also it can give you almost exact buy or sell time on the spot.
I am developing it even more so stay tuned and start to follow me for more signals and forecasts.

UBS Group AG (UBSG.vx)We can found a technical figure Triangle in the Swiss company UBS Group AG (UBSG.vx) on a daily chart. UBS Group AG is a Swiss multinational investment bank and financial services company founded and based in Switzerland. UBS client services are known for their strict bank–client confidentiality and culture of banking secrecy. The Triangle has broken through the support line on 09/09/2021. If the price holds below this level, you can have a possible bearish price movement with a forecast for the next 12 days towards 14.595 CHF. According to the experts, your stop loss should be around 15.485 CHF if you enter this position.
Risk Disclosure: Trading Foreign Exchange (Forex) and Contracts of Difference (CFD's) carries a high level of risk. By registering and signing up, any client affirms their understanding of their own personal accountability for all transactions performed within their account and recognizes the risks associated with trading on such markets and on such sites. Furthermore, one understands that the company carries zero influence over transactions, markets, and trading signals, therefore, cannot be held liable nor guarantee any profits or losses.

Novartis AG (NOVN)The Swiss-based drugmaker missed consensus expectations on both earnings and sales in the first quarter, the results were hurt by a historically weak cough and cold season. Novartis’ cornerstone innovative medicines division turned in with sales +4%. Stock is currently pegged to underperform the broader market and our 18-month projections reflect below-average upside potential. But as said in the chart, a "buy and hold" strategy give a 3.50% dividend yield in CHF.

Sell Short Bellevue Group AGI now open here a little short position as -not yet confirmed- rsi-divergence is in developement, OBV is decreasing and MACD also suggested a sell order two days ago.
Stoploss is placed just above the previous high.
Will keep this updated!

Working with anglesWorking with angles is something I see myself doing more often lately, meaning they have proven some reliability to me over time. When exactly is still quite intuitive and this publication is also an idea to further explore by other traders and so develop a competitive edge, and therefore should remain secret how to apply in further detail.
Here I look at Swiss company Nestle which always has been a high performer, at least since last recession. It price made a double bottom over the course of 2006-2009 with a top in December 2007.
From that 2009 onwards it delivers a good opportunity for bullish investors. When I see it touching an imaginary trendline I draw a line using the "Trend Angle" drawing tool. Often I discover that certain angles persist although with an offset up or down in price. Here I have drawn a 23 and 22 degree trendline with almost 10 years between them.
Long persistent trend angles objectively tell me something about strength and trend line reliability. For example, it would add weight to my decision for going short or long at this point in time.
Not saying I would go short here. This is where you can add your variables to make your own decision as a trader.

ROG Breakout. Broke its all time high.Good news combined with a perfect breakout at 357. Just needs a bit more volume.


COMET (COTN) LongCOMET (COTN) breakout on Cup & Handle and VCP in handle. Bullish candle on BO with follow through. Long.
