
PTTGC with H&S Pattern and WTZ2PTTGC with H&S Pattern and WTZ2. I wait for AO signal for confirmation on the next bar. If the next bar can break out the entry level, it's interesting. If the next bar break out with gap, it's more interesting. Good Luck!

Chart Pattern Review | Diamond Top / Bottom ReversalDIAMOND TOP / BOTTOM:
> A trend reversal pattern indicating the end of up or downward trend - slightly off head & shoulders pattern
> Price increased and declined sharply with significant volume forming a diamond shape
> A mix of expanding and contracting triangle or wedge, often confused with a more popular head & shoulders
> Timing could range from days to months
Key characteristics:
> The price should trending downward then forming a broadening pattern.
> The price pattern increased and decreased sharply before squeezed for rebound
> Timing ranging from days-weeks-or months - a strong long-term reversal pattern
> Most trends will begin with a breakout gap and be followed by several runaway gaps.
Trading Tips:
> Price range determines the target reversal
> TP1 @ the size of the diamond extending the breakout or breakdown distance.
> TP2 can be targeted between 1.0 / 1.618 fibonanci retracement.
> TP3 @ key moving average support / resistance within extended range.
> Putting the chart together with a price oscillator like VWAP / CVD for a better early breakout or breakdown catch.
> Price oscillator can monitor the overall likelihood of a high probability trade and confirming strength/momentum as well as spotting false breakout/breakdown trades.
Always trade with affordable risk and respect your stoploss, nothing 100%
Good Luck!

PTT : A long side way down to nowhere!!PTT has a long down trend since it historical high.
I will wait until end of first half 2024.

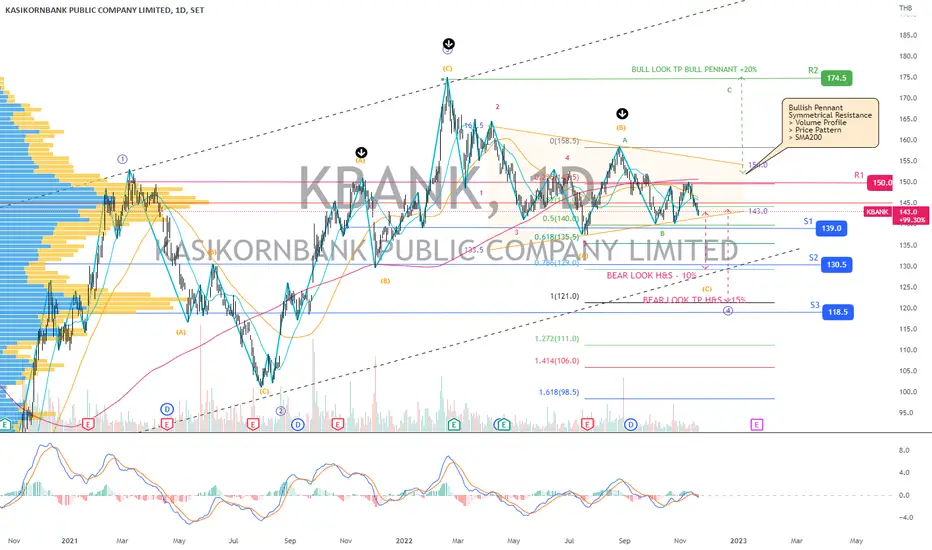
KBANK | Wave Analysis | Bearish Projection Diagonal 4-wavePrice action and chart pattern trading
> A 2 conflicting pattern with a bearish move from the larger Head & Shoulders pattern and a bullish one with current bull pennant.
> The larger HS pattern could be overshadowing the smaller pennant pushing the price lower - SMA20 dead crossed SMA50.
> A strong symmetrical resistance; upper volume profile, price resistance, and SMA200.
> This 4-wave diagonal projection is based on the unsuccessful breakout scenario with an upcoming C leg downtrend extension 0.786 - 1.0 approximately - 10 - 15% downside.
> A bullish scenario is based on the successful breakout of bull pennant and SMA200 targeting the previous 3-wave high with a +20% upside.
> Indicator: bearish MACD signal crossing below the signal and baseline
Always trade with affordable risk and respect your stoploss!
PTT | Wave Projection | Bullish Flag - Bullish Divergence Price action and chart pattern trading:
> A possible upcoming short term rebound B-wave of mega bullish flag 2-wave ABCDE triangle correction
> The price made LL last week from 34 baht support, assuming minor 5-wave of A leg to 32.75 baht then a strong buy back signal with bullish engulfing candlestick.
> Entry signal @ breakout recent resistance 33.75 baht
> Stop @ the current low 32.75 baht -3%
> Target 0.618 - 0.786 retracement 36-37 baht +8-10%
> RRR: 2.5:1


SCB | Wave Projection | ABC Target Bullish Pennant +22%Price action and chart pattern trading:
> The price during last few weeks squeezed just under EMA200D with a series of bullish candlestick pattern
> A possible ABC uptrend wave with bullish pennant pattern target +22% at TP3 1.618 fibonanci extension.
> Support @ S1 -7% and S2 -10% downside
> Risk reward ratio: 2:1
> MACD squeezed momentum under the baseline
Always trade with affordable risk and respect your stoploss

WFX Fair price 5.00-5.6WFX Fair price 5.00-5.6, Add to our list, Wait and See how bid offer do everyday

TU | Wave Projection | Bullish Dragon Pattern +25%Price action and chart pattern trading setup:
> A bullish dragon pattern with an uptrend ABC wave currently making a pullback to the rising channel support at the volume profile point of control
> The price is below key dynamic support SMA200 and SMA50 which is considered a downtrend movement or could just be a false break dump and pump
> Entry @ SMA50 and SMA200 breakout zone once the price recovered
> Stoploss @ B wave position -7% downside
> Target @ 1- 1.618 extension dragon head & shoulder zone
Always trade with affordable risk and respect your stoploss


31 Oct 2022 - SET COM7COVID-19 affect that catalyst all WFH gadgets has nearly to an end. COM7 is starting correction period in which it "might" be drawn down to below 20 THB

BBIK and Bullish Flag + WTZ3BBIK is my previous year favorite IPO stock. I have traded the stock on big move after IPO day and took large profits before it went sideway. In this year, when looking at its annual financial statement, you will see lots of cumulative profits. I've waited for price pattern and my favorite setup for strategic entry. The target price is reasonable to be traded. However, don't forget to limit your risks well before trading. Good Luck!

WHA | Wave Projection | ABCDE Rising Triangle TargetPrice action and chart pattern trading setup:
> The key level to watch for the price now almost reaches the upcoming channel resistance and minor ABC pattern T1 zone.
> Take partial profit recommendation, most likely to retest the triangle neckline or breakdown making E wave dump and pump pattern.
> Entry @ neckline pullback zone 0.382 and S2 @ 0.618 SMA200D zone
> Target @ T2 Major ABC Target and Inverse Head & Shoulders +25%
> Stoploss @ SMA200D zone -8%
> Risk reward ratio: 3:1
Always trade with affordable risk and respect your stoploss

SET - BBL 28 Oct 2022SET - BBL is key player under banking section. Through conservative management style and high NPL provision, their REV and Earing grow firmly not only from domestic but also from offshore investment in indonesia as well.


CFRESH TendencyCFRESH Tendency passed distribution and seem going to be downtrend due to over break last line of uptrend.

AMATA TendencyAMATA tendency. Going uptrend and target around 24
This is only my opinion not advise.

WHA and WTZ1/WTZ2 (Multi-Setup) + AO in the ZoneWHA has consolidated in several months with wide rage of sideway. Today, it just broke out the range with distinct volume and AO in the zone signal. I apply WTZ1 together with WTZ2 in multi-setup for fibo. measurement as the target while AO signal can enhance the competitive entry. However, don't forget to limit your risks and calculate position size well before trading. Good Luck :oP

HMPRO | Wave Projection | Complex Inv. Head & Shoulders BreakoutPrice action and chart pattern trading setup
> A possible bullish uptrend ABC scenario with complex inverse head & shoulders pattern with SMMA50D as its neckline BREAKOUT!
> The candlestick pattern is consolidating just above the breakout area which possibly retest its neckline next week before price push higher.
> Entry @ B1: PULLBACK retesting neckline within area of candlestick consolidation B2 @ breakout as follow buy.
> Target: Inverse head & shoulders T1 is fibo 1.0 extension and T2 just below 1.618 ext. zone + 12 - 18%
> Stoploss: right shoulder zone - 7 - 8%
> Risk reward ratio: 1.5 - 2: 1
> Indicator: RSI > 60 bullish channel and breakout MA
> The key fundamental analysis found that this coming high season after Thailand major flooding could trigger a boost in revenue and profit in upcoming Q4 company performance.
Always trade with affordable risk and respect your stoploss.
