
CKPIt is another interesting stock at this time. In the future, it can grow even more. There is an opportunity to expand from the increasing demand for electricity with the current weak baht It is an opportunity for foreign investors to come in to seek growth in the Thai stock market.

SCC | Elliott Wave Projection | Head & Shoulders Target BottomPrice action and chart pattern trading
> TFM head & shoulders pattern after a possible major 4-wave downtrend 0.618 retracement with ABC correction formation
> Target H&S bottom @ the next key level down SMMA200 month as a strong support - possible retesting previous 4-wave zone during covid outbreak.
Always trade with affordable risk and respect your stoploss, nothing is 100%.

DDD (POTENTIAL BUY LEVEL) ***BULLISH SENTIMENTThis is just my basic MONTHLY charting.
I have marked what I see as the POSSIBLE bottom (support).
I see overall DOWNTREND with reversal.
I have marked my potential BUY LEVEL for LONGS//CALLS.

Can this develop to Wyckoff pattern? Can this develop to Wyckoff pattern?
What do you think?
------------------------------------------------
Background: Ratchthani Leasing Public Co., Ltd. is engaged in the provision of hire purchase and leasing services. The company operates through three reportable segments: New car, Used car and Others. It also offers after-sale services, processing of renewal of car registration, compulsory insurance, and refinancing.
Source: Tradingview
------------------------------------------------
Analyst-consensus (as of 26/08/22):
Year______'2022F' '2023F'
Average EPS: 0.34 0.38
Average Div%: 4.46% 4.90%
Average Traget: 5.06
Source: www.settrade.com
------------------------------------------------
Disclimer:
The Content is for entertainment purposes only,
you should not interpret any such information or
other material as investment, financial, or other advice.
You alone assume the sole responsibility of evaluating the merits and risks
associated with the use of any information or other Content on the IDEA before
making any decisions based on such information or other Content.

SET - SPRC RUNTREND BY hoonklingklingSPRC BUYING AT THE TREND AND RUNTREND TIL END ROUND
----
TOOLS TO MAKE PROFITS
1. UPTREND
2. Support and resistance
3. Volume analysis
4. SET RUNNING IN THAT DAY
5. Double Bottoms ( Bullish )
6. Risk Reward Ratio
7. Time Cycle
8. MACD 12 26 9
My Mindset when buying stock
Be disciplined when it's time to buy
Everything come with price , and price of profit is risk to lose your money without risk you never get the profit
DOUBLE PROFIT ON SPRC AND THE 3rd PROFIT WILL COME SOON 😋😋💸💸
----
HOON Kling Kling

SET - AGE RUNTREND BY hoonklingklingAGE BUYING AT THE TREND AND RUNTREND TIL END ROUND
----
TOOLS TO MAKE PROFITS
1. UPTREND
2. Support and resistance
3 Volume analysis
4 SET RUNNING IN THAT DAY
5 Symmetric triangle ( Bullish )
6 Risk Reward Ratio
My Mindset when buying stock
Be disciplined when it's time to buy
Everything come with price , and price of profit is risk to lose your money without risk you never get the profit
Waiting for next buy at the trend na kub 😋😁
----
HOON Kling Kling

PSL | Wave Analysis | Target C-Wave H&S Bottom PatternPrice action and chart pattern trading
> Pattern Head & Shoulders with a possible target downtrend C-wave 0.786 fibo zone extension of previous A-wave
> Current moving uptrend minor 4 wave correction with limited downside at SMMA200W as the target.
> Long Entry @ local channel breakout once completed minor 5-wave
> Key resistance SMMA50W

PTTG This is good opportunity! In Timeframe 1 Week : I founded Bullish divergence
And I check TF : 1D This is first Lower Low in 61.8 Fibo and order in demand Zone

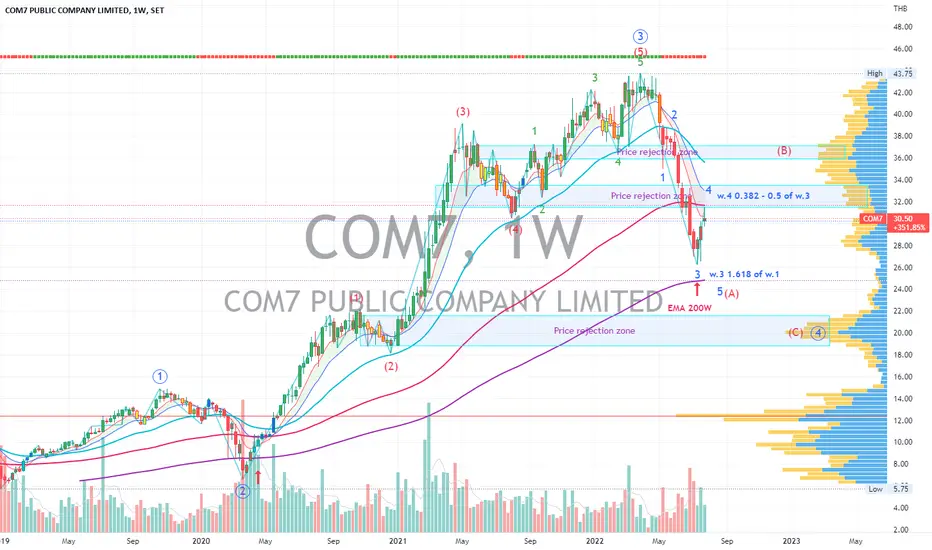
COM7 | Elliot Wave Correction Target Projection - EMA200WPrice action and chart pattern trading
> Possible making its uptrend to 4-wave of the 1st A-wave correction, expecting a retracement of 0.382 - 0.5 of 3-wave
> EMA100 W and EMA 200 W are the key dynamic support and resistance of the current movement.
> The final 5-wave of A could be retraced back at EMA200 W.
> Wait for daily timeframe reversal pattern near EMA200W support line for long entry
COM7 | Elliott Wave Projection | Target Inv. Cup&Handle BreakoutPrice action and chart pattern trading setup:
> A possible inverted cup&handle pattern ABC correction
> stock price once again testing its support and probably making another pullback one more time
> Target handle pullback @ 0.382 - 0.236 Fibonacci zone
> Target downtrend C wave @ inverted cup&handle breakout @ 0.786 - 1.0 fibonacci extension of A wave
> Stoploss can be placed at the upcoming pullback wave 4 correction -12%
> Risk reward ratio: 2.5:1
Always trade with affordable risk and respect your stoploss, nothing 100%

Elliott wave 1 Elliott wave 1 Flat graph by Nantich The traingle
Turtle and rabbit
One day a rabbit was boasting about how fast he could run. He was laughing at the turtle for being so slow. Much to the rabbit’s surprise, the turtle challenged him to a race. The rabbit thought this was a good joke and accepted the challenge. The fox was to be the umpire of the race. As the race began, the rabbit raced way ahead of the turtle, just like everyone thought.
The rabbit got to the halfway point and could not see the turtle anywhere. He was hot and tired and decided to stop and take a short nap. Even if the turtle passed him, he would be able to race to the finish line ahead of him. All this time the turtle kept walking step by step by step. He never quit no matter how hot or tired he got. He just kept going.
However, the rabbit slept longer than he had thought and woke up. He could not see the turtle anywhere! He went at full speed to the finish line but found the turtle there waiting for him.

M : SET IndexIt broke symmetrical triangle already.. may retest support again and if it holds then interesting to collect
is famous restaurant in Thailand...
doesn't matters how eco, be like,,, thai ppl just love eating

CH and AB=CD / IPO Type 1CH is an annual IPO stock of SET. I usually apply IPO pattern accordingly my research for Thai Stock market. For this stock in hourly chart, it's IPO Type 1 and suitable to apply AB=CD setup for trading. Once again, don't forget to managing your risks before trading.

DDD and WTZ2I often use the simple trade setup, WTZ2, as my basic strategy. However, calculation risks and position size is always mandatory for me. Especially this stock, RRR is competitive for my trading. Enjoy trading!

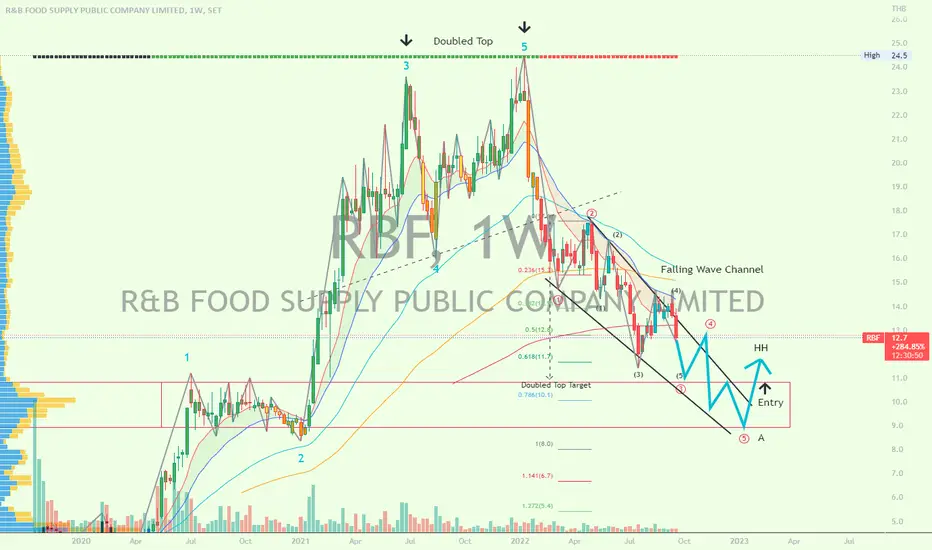
RBF | Wave Analysis | Target Projection - Ending DiagonalPrice action and chart pattern trading
> Falling wave channel pattern, possible downtrend 3-wave ending diagonal pattern
> Target doubled top zone previous wave 1 - 2 as price rejection is expected, followed by tight candlestick consolidation.
> Entry @ downtrend channel breakout from the consolidation, MACD and RSI bullish signal
> there are other strategies you can use, including using indicators and using patterns like triangle, ABCD , XABCD, and head and shoulders .
Always trade with affordable risk and respect your stoploss, nothing is 100%.
PRM | Elliott Wave Analysis | B-wave Buy on dip trading setupPrice action and chart pattern trading:
> Falling wedge correction wave with strong breakout uptrend if you didn't catch the first uptrend, here is the setup for buying the dip.
> status MACD dead-crossing the signal line, possible correction is coming.
> 1st Entry @ strong POC support near 6 baht or SMMA25 zone
> 2nd Entry @ falling wedge retest zone about 0.618 retracement
> Target B wave uptrend near 2-wave downtrend or 0.618-0.786 retracement zone also equals to the target of the falling wedge with a + 30-40%% upside.
> Stoploss @ slightly below the 2nd entry zone -10% downside.
> Risk reward ratio: 3:1
Buying the dip is an important strategy you can use to trade the financial market. Apart from the dollar cost averaging and Fibonacci retracement, there are other strategies you can use, including using indicators and using patterns like triangle, ABCD, XABCD, and head and shoulders.
Always trade with affordable risk and respect your stoploss, nothing is 100%.

PTG and WTZ2PTG and my favorite trade setup, WTZ2, is interesting. I apply AO signal for competitive entry with limited risks as usual. Good luck for trading.

TKN | Wave Analysis | Possible Upcoming Impulse 3-Wave ForecastPrice action and chart pattern trading setup
> Wave pattern: 2-Wave Triangle ABCDE - possible upcoming wave E before rising impulse 3 wave.
> Entry: Support level SMMA50 and SMMA20 @ 0.618 and 0.786 retracement zone
> Target: 3 -wave triangle breakout plus distance of the triangle channel 1.272 extension zone of main 1-wave +15-20%
> Stoploss: Lower triangle support zone -7-8%
> Risk reward ratio: 3:1
Always trade with affordable risk and respect your stoploss


Possitive on ORthe electric car charging stations will make it possible in the future.
the momentum increasing and the foundation has consolidated for a certain amount.

KAMART and Triangle PatternKAMART has been consolidating in triangle pattern for several weeks. Normally, when the stock breaks out the pattern, 75-125% of the height of triangle is expected to be a simple target. However, calculating your own risks is still recommended. Good Luck!

