SET:PROEN LONG. Await clear breakout from consolidation zoneOpportunity to long SET:PROEN . Stock has undergone significant accumulation since IPO. Price is currently in uptrend, above VWAP from IPO. Await a breakout + a surge in volume traded as a trade confirmation. Stock has just been removed from SET surveillance list, allowing for margin accounts to participate in the action -if any ;)
Listed Shares: 316M
Free Float = 25.52% // Shares Free float = 80.64M shares (1,241 minority shareholders)
Total shares traded in range from IPO = ~1,900M shares
Current Market cap @9.20 THB = 2.91B THB (03/05/22)

BGRIM| Wave Projection - Corrective ABC Ending DiagonalPrice action and chart pattern trading setup
> Wave projection - corrective ABC ending diagonal Wave 4 at 0.5 - 0.618 of wave A, ranging from 36-41 baht.
> Final wave 5 to complete Wave C projected at 0.786 - 1.0 of Wave A, 23 - 30 baht range.
> Entry @ Falling Wedge breakout after completing wave C
> Target at Wave B position
> Stoploss at wave C lowest position
Always trade with affordable risk and respect your stoploss

TAKUNII thinkTAKUNI is in the accumulation phase ( we see that volume profile is distributed in around 1.5-1.8) and I believe that TAKUNI is going to sell off and If It doesn't fall below the trendline , It will be a good chance to enter the trade. Enter zone 1.96,1.86,1.69 separately


GULFI think GULF is going up and forming a triangle , and at this point I think it's good position to enter the trade. the price to take profit is 51.75 ( trendline, suggest to take 50% of your position) and if It break trendline let the profit run to 59 bath, stop loss at 47.50

AMANAH longI think AMANAH is growing up because of higher income
-> look at graph , It has been through accumulation period and break the trend line as picture above so I think it's gonna go up

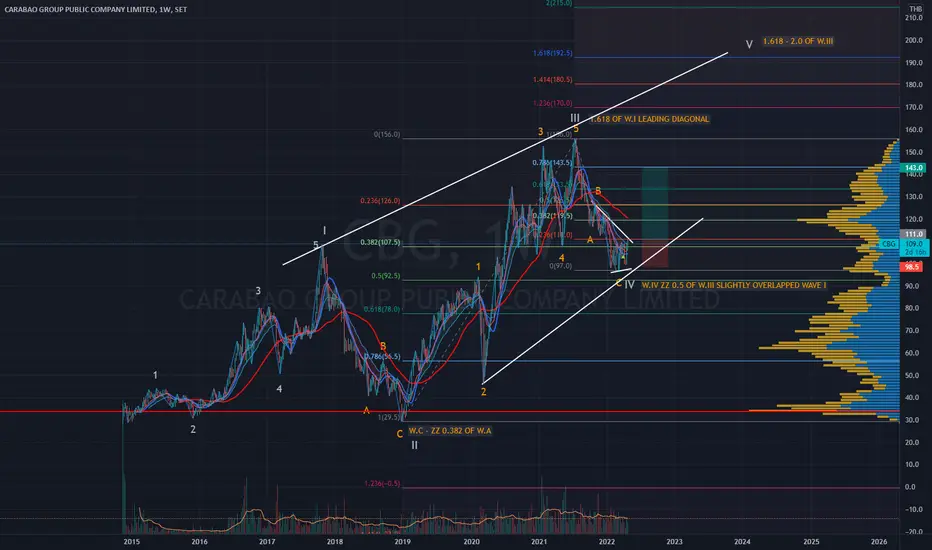
CBG | Leading Diagonal Wave IV Projection CyclePrice action and chart pattern trading setup - Entry at descending triangle breakout
> Wave Projection based on the weekly timeframe - the leading diagonal wave IV zigzag family is in the range 0.382-0.5 retracement of W.III slightly overlapped W.I
> Wave III extended 1.618 of W.I exactly and W.V is estimated at 1.618 - 2.0 of W.IV at 192 - 215 baht.
> 1st target medium term trade target at 0.786 - 1.0 retracement of W.III +30% upside
> Stoploss at the lowest point of W.IV - downside -12%
> Risk reward ratio 2.5:1
The contracting/expanding diagonal concept is not Elliott's original work but with enough incidence today, some of us are convinced of its validity.
7UP and WTZ27UP 25.04.2022
Trade Setup : WTZ2
Trading Plan : Entry=1.28/Stop=1.18/TP=1.78/RRR=5.0
Calculate and manage your risks well before trading.

Just hold on alittle bit more!!BGRIM seems to be almost done on correcting big wave 3 (blue). Currently, we are in wave 4 which doing a complex correction Flat-X wave-Zigzag (W-X-Y). Then, if we look closer at the last leg of wave Y, we still miss the fifth wave to complete the whole wave. So after looking carefully, the graph depicts the interest price area to buy. That price would be nothing else but at the extortion gap that happened in May 2018. However, as I show in the illustration, the price will go up a bit and then continue to dip down, I still need the confirmation of where the price end to finalize the buying area. (Not financial adviser, just share my POV.)

KEX : The waterfall : SET INDEXKerry Express.. I'm feeling sorry for those who jumped in its IPO
Everything is on the chart (I personally don't think it will reach the ground)
Just do good MM /DCA and then be patient it takes time to grow !
(they have interesting business plan/structure though even there're many competitors
but most Thai people do online shopping than going to the shopping malls nowadays)
.
Trade safe n fun!

SCGP : SET INDEX (WATCHLIST) Everything is on the chart,
.
Btw.. KEX found its bottom
see link below
Trade safe n fun!

PSL | Detailed Elliott Wave Projection - Bullish Scenario Price action and chart pattern trading
> A more detailed project of Elliott Wave presents an alternative bullish scenario.
> An Impulse ZZ family has possibly presented a wave 2 intermediate position going up making wave 3 on the way.
> 1st target at wave 1 position, 2nd target at wave 3 at 1.213 - 1.618 zone and final target at wave 5 at 1.618 - 2.618 extension zone
> Stoploss at the lowest position of wave 2 with downside risk at 10 - 15%.
> RR at 2:1 for short term and 3:1 for medium term trade.
> The extended target of Primary Wave 5 is projected with 1.618 - 2.618 retracement of primary wave 4 at 33.5 - 40.5 for your run trend lot.
Always trade with affordable risk and respect your stoploss.

PSL | Elliott Wave Projection Standard Zigzag Correction ABC Price action and chart pattern trading
> Estimated Elliott Wave standard ZZ correction ABC - impulse C at 0.786 - 1.0 of wave A but can be truncated or failure
> Making the Elliott Wave main cycle W.II at 0.382 Fibonacci retracement of W.I starting point
Note: projection in TF4H and TF1H can be different i.e. W.B position is projected as new Wave 1 cycle.
Always trade with affordable risk and respect your stoploss!
Good Luck

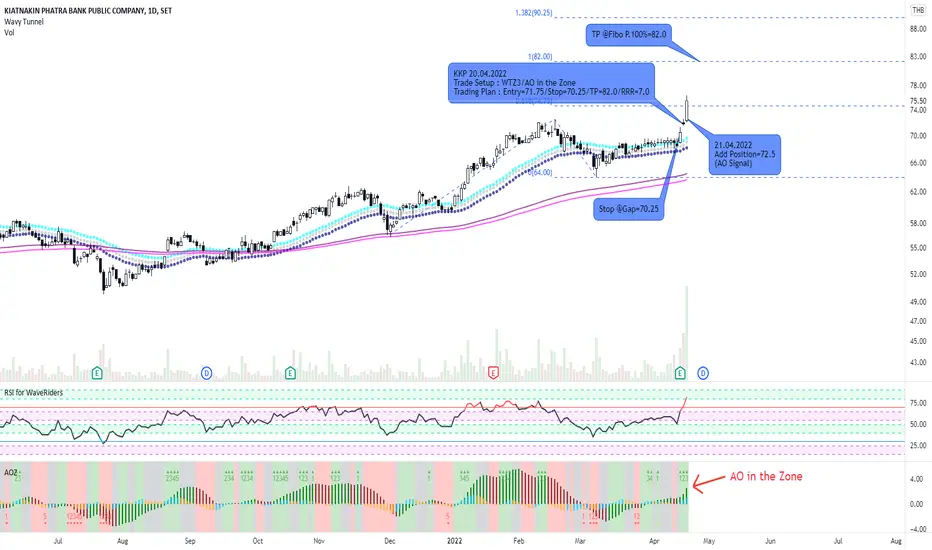
KKP and WTZ3 KKP is an uptrend stock. Normally, it's easy to trade with profits in the uptrend product if you can wait and take action properly. I apply AO signal and gap theory for making the trading plan with highly possible rewards with limited risks. Take it easy and simple for trading. Good Luck
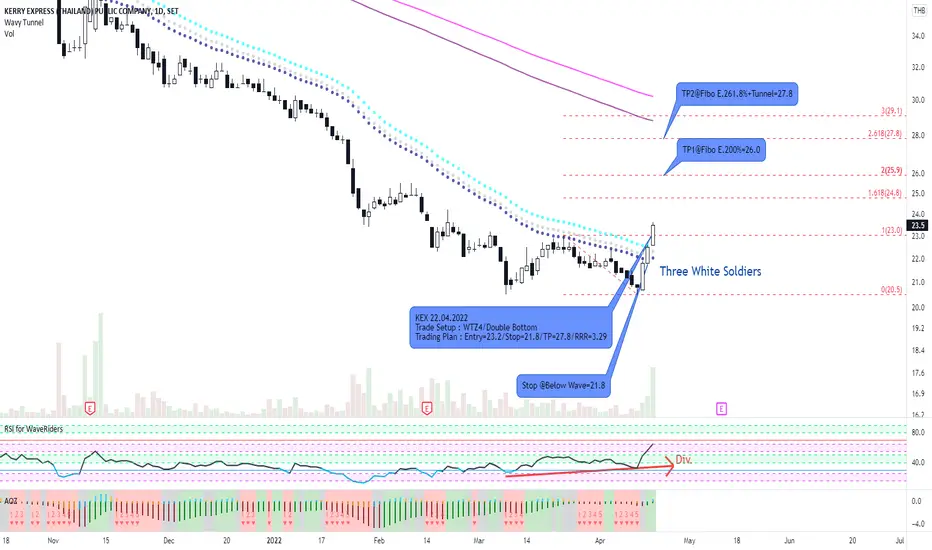
KEK and WTZ4 with Dbl. BottomWho like trading stocks from the bottom may like this basic pattern (Double bottom and Price Pattern Signal). I apply WTZ4 for making trade setup and trading plan as illustrated on the chart. Calculate your risks before trading. Good luck.
TTA | Elliott Wave Projection - Impulse Intermediate Wave 3Price action and chart pattern trading
> Elliott Wave Projection - Intermediate Wave 3 Impulse at 1.213 - 1.618 of Wave 1, assuming that Wave 2 intermediate is here and recent Wave C at the lowest position of this downtrend.
> Wave 5 intermediate is projected at 2.213 - 2.618 of Wave 1 closed to the previous Wave 5 zone.
> Stoploss at W.C position risk 10%
> RR 3:1 for medium-term trade
Always trade with affordable risk and respect your stoploss.

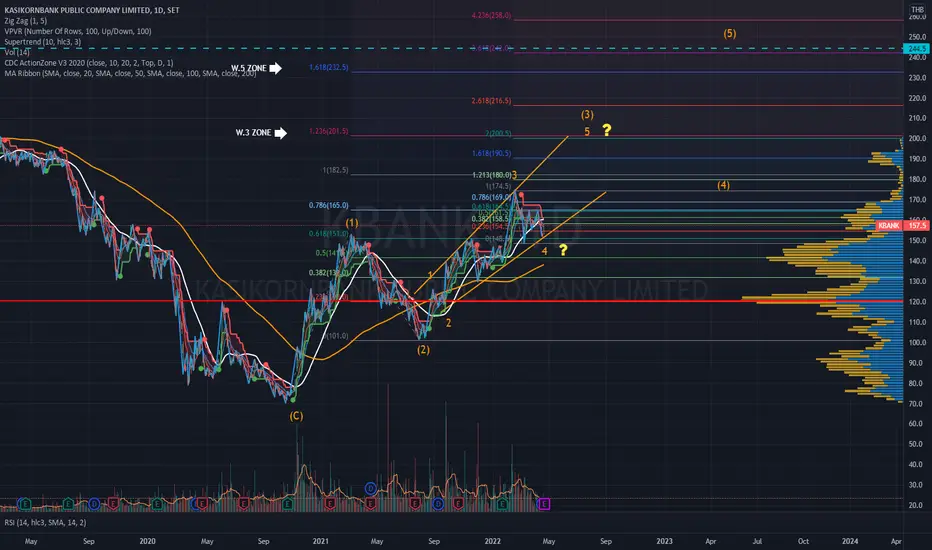
KBANK |Elliott Wave Projection - Impulse Wave 3 IntermediatePrice action and chart pattern trading - rising wedge
> Elliott Wave Projection - Impulse Wave 3 Intermediate is upcoming at 1.236 zone extension of Wave 1, assuming Wave 4 minor is here and Wave 5 minor is estimated at 1.618 - 2.0 can be impulse or diagonal.
> Entry at the pullback swing wave 4 support zone, stoploss at SMA50, RR 3:1 for medium-term trade.
Always trade with affordable risk and respect your stoploss

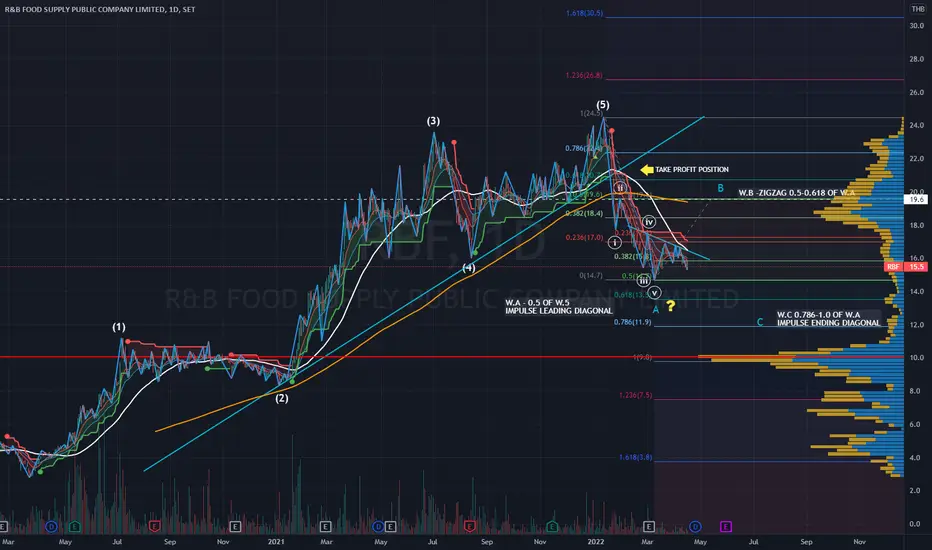
RBF | Elliott Wave Projection - Corrective Wave BPrice action and chart pattern trading
> Elliott Wave projection of corrective Wave B - Entry @ downtrend line breakout of consolidation
> Target Wave B Zigzag at 0.5 - 0.618 retracement of Wave A
> Stoploss at the lowest point of Wave A impulse wave 5 position
> Risk reward ratio at 2:1 for short term trade
Always trade with affordable risk and respect your stoploss
TU | Elliott Wave Projection - End of Wave 4?Price action and chart pattern trading
> Elliott Wave Projection of the primary wave 4 coming to an end of sharp declining DOUBLE ZIGZAG Correction?
> Wave Y coming to 1.236 to 1.618, then Wave 4 would slightly overlap Wave 1 position and expected a possible small sideway breakout consolidation for a buy entry.
> If Wave 4 is coming to the end as described, Wave 5 is projected at 1.236 - 1.618 retracement of wave 4.
Always trade with affordable risk and respect your stoploss

BANPU | Elliott Wave Projection | Minor Wave 5 TargetPrice action and chart pattern trading
> The big question mark is Wave C correction is relatively too short in nature of a standard zigzag correction.
> Assuming the correction is done, the current minor leading diagonal target Wave 5 is projected at 1.236 - 1.618 retracement of the current minor wave 4.
Always trade with affordable risk and respect your stoploss

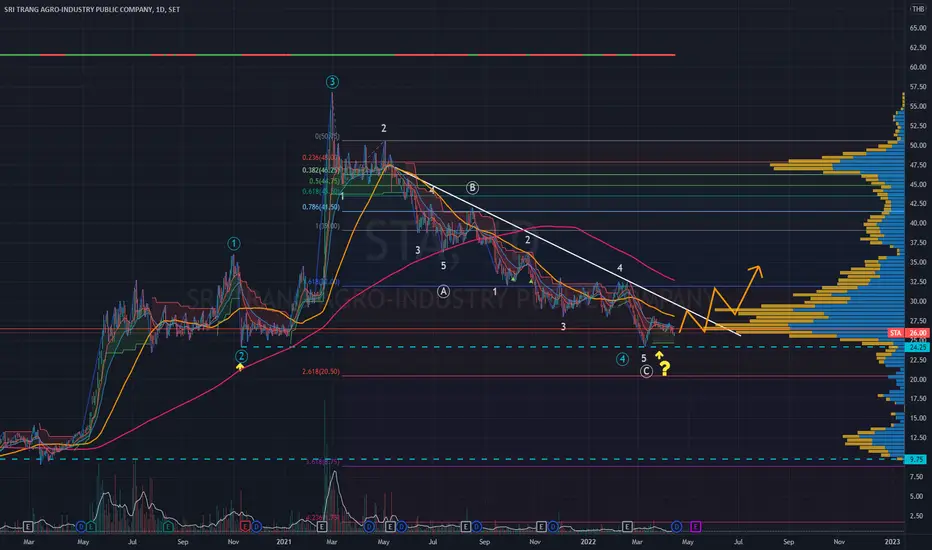
STA | Elliott Wave Projection | ZZ Correction ABCPrice action and chart pattern trading setup
> Leading Diagonal Family now the zigzag primary wave 4 can not go lower than wave 2 (slight overlapped maybe possible practically.)
> If wave 4 is a failure, the current wave would be reset to wave 2 and projected wave 3 would become wave 1.
> Wave 4 is always zigzag family - sideway breakout is optional as a combination with flat
> Wait for confirmed new wave breakout before entry at wave 2 or wave 4 minor
> 1st target for long can be set at 0.5 to 0.786 retracement top of wave 3
> The Final target at wave 5 always ends beyond wave 3 at 1.236 or 1.618 wave 4 retracements.
> Recommended risk reward ratio at 3:1 for medium and long term trade.
Always trade with affordable risk and respect your stoploss.