ZIGA SET Island ReversalI bought 4.9 with SL tp at previous top.
An island reversal is a price pattern on bar charts or candlestick charts that, on a daily chart, features a grouping of days separated on either side by gaps in the price action. This price pattern suggests that prices may reverse whatever trend they are currently exhibiting, whether from upward to downward or from downward to upward.

SCC moving upwards. LONG. TP: 475.00 if it breaks through 405. Long SCC, strong support, accelerated upside with MA 50 crossing MA 200. Resistance at 405, after that it's takeoff.

ESSO | Bullish ABCD Harmonic | Double Bottom BreakoutESSO | Thailand SET Index | Energy Sector | Oil Refinery | Price Action & Chart Pattern Trading
> Bullish ABCD Harmonic | Double Bottom Breakout with breakaway candlestick
>Entry @ BREAKOUT position
> RSI strong bullish signal ribbon above 50
> MACD golden cross above baseline
> Fundamental factor - high season for oil and refinery price
Trade with affordable risk ratio 3:1
Always respect your stop-loss
Good Luck

BAY (TH) - ELLIOT WAVE ANALYSIS- We can easily spotted a Zigzag correction on the chart - Intermediate (A)(B)(C)
- Intermediate (C) seems to be a 5th wave failure pattern, where price should retrace back to at least 100% of the whole wave (@51)
- TP no.2 is set at @71 - 61% retracement of the Intermediate Zigzag pattern.
- There is a possibility that we can see a new high in this bull run, but at this moment things remain uncertain.

TIDLOR | Triangle Breakout | Entry-Pullback Shooting Star candleTIDLOR |Thailand SET Index | Financial Sector | Price Action Trading
Chart Pattern: Pennant Triangle Breakout
>Price Action: Entry Zone @ Pullback - shooting star candle
>Stop-loss Zone just 3-5% below the VOLUME PROFILE - POINT OF CONTROL LINE
>EMA10 and EMA20 crossing up EMA50 main dynamic resistance.
Indicator:
> RSI & MA bullish signal
> MACD golden cross uptrend just below baseline 0
Always respect your stop-loss
Good Luck &
Happy New Year

STA | Super Powerful 3-DRIVE Harmonic Pattern-1st break 36 weekSTA | Thailand SET Index | Agricultural Sector | Price Action & Chart Pattern Trading - The 1st Breakout
> Super Powerful 3 Drive Harmonic Pattern in Week Timeframe total 36 weeks / 250 days. I totally admire the attitude of patience for the time and embracing what comes next with this kind of powerful pattern
> Entry @ Breakout Zone to confirm the reversal pattern
> RSI, MACD bullish crossing signal line
Below link for version Banker Smart Money, fund flow, and BBD Indicators
Trade with affordable risk ratio 3:1
Always respect your stop-loss
Good Luck

SICT Daily - Most active Volume At Open Market
- Uptrend
- Price Action
- Low Risk
- High Return if ATH

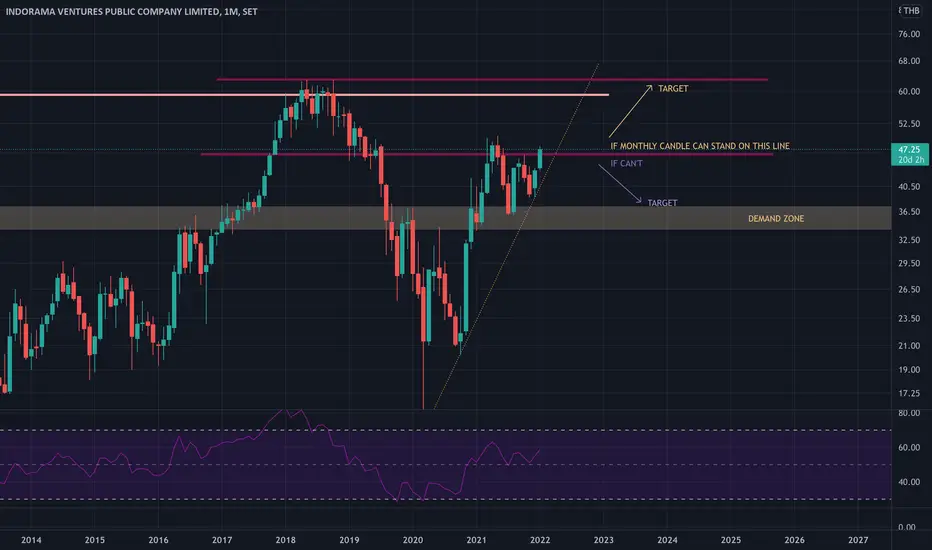
IVL : (SET INDEX)Everything is on the chart
Feel free to comment / feedback
Trade safe, always place the stop loss
TY
Mil
SDC | Powerful 3-Drive Harmonic | ENTRY@BREAKOUT SDC |Thailand SET Index | Price Action & Chart Pattern Trading
> Confirmed a powerful 3-drive Harmonic Pattern | Strong Breakout Anticipated | Wait for confirmed candlestick | Beware of Dump & Pump
Trade with affordable risk ratio 3:1
Always respect your stop-loss
Good Luck

IMH | Triangle Breakout - Target Entry Position IMH | Thailand MAI Index | Service Sector | Price Action Trading
Price Action | Strong momentum bullish BREAKOUT
Chart Pattern | Descending Triangle
Possible uptrend from wave 4 to 5
Indicators:
> RSI - Bullish but not overbought
> MACD - Golden cross ribbon - crossing up 0
Always respect your stop-loss
Good Luck

SIMAT | Bullish Wedge Breakout | Entry @ Pullback PositionSIMAT | Thailand SET Index | Price Action & Chart Pattern Trading
> Falling Wedge Reversal Pattern - Breakout with strong momentum candlestick
> Entry @ Pullback position - strong resistance volume on top of breakout candlestick
> RSI bullish cross up MA line above 50
> MACD bullish signal crossing up baseline 0
Trade with affordable risk ratio 3:1
Always respect your stop-loss
Good Luck

SKY | Ascending Triangle Breakout Position | Entry @ Pullback SKY | Thailand SET Index | ICT Sector | Price Action & Chart Pattern Trading
> Upcoming ASCENDING TRIANGLE BREAKOUT - Entry@Pullback position | strong momentum breakout anticipated
> RSI bullish signal above 50
> MACD bullish golden cross above baseline
Estimated TARGET POSITION above +20%
Strong DEMAND SUPPORT line for STOP ZONE
Trade with affordable risk ratio 3:1
Always respect your stop-loss
Good Luck

PIMO maybe pumping in few weekIf the price is not be lower than now, it'll be c-failure and coming with strong pumping but if I wrong stop loss at 3.5 about 6%


BCH | Tea...or Coffee? | ENTRY @ BREAKOUT | Demand cross EMA200BCH | Thailand SET Index | Health Care Sector | Chart Pattern Trading
> Cup and Handle - Estimated 33% target upside with 88 days and 61 candles
> Price Action: Entry @ Breakout to confirm the pattern - Key resistance at 21 or Demand Support Line above EMA200
> RSI bullish signal above MA line crossing up 50
> MACD golden ribbon crossing up the baseline
Good Luck

ABM | Triangle Breakout | Target ENTRY PositionABM | Thailand SET Index | Energy Sector | Chart Pattern Trading
> Chart Pattern: Symmetrical Triangle Breakout
> Price Action: ENTRY position @ Breakout with strong momentum crossing up above VOLUME PROFILE POINT OF CONTROL
> Indicator: MFI Bull momentum above 60, RSI > 50 golden cross MA line, MACD crossing up signal line above baseline 0.
Trade with AFFORDABLE risk ratio 3:1
Trust in SYSTEM indicator
Always respect STOP-LOSS
Good Luck
DP

TU | Descending Breakout | Tweezer Top Entry @ Pullback / RetestTU | Thailand SET Index | Food Sector | Chart Pattern & Price Action Trading
Descending Triangle Breakout with Bearish Tweezer Top Candlestick pattern - Wait for Entry @ Pullback at retest position
Double Bottom & Top
RSI strong bullish signal
MACD about to cross the baseline 0
Trade with affordable risk ratio 3:1
Always respect your stop-loss
Good Luck
DP

WAVE | Ascending Triangle Breakout | Elliott 3rd Wave ResistanceWAVE | Thailand SET Index | Media Sector | Chart Pattern Trading
Let's challenge ourselves to catch it before breakout once forming a tight consolidation candlestick pattern below the key resistance of Elliott Wave 3.
Chart Pattern: Ascending Triangle
Price Action: Speculative buy before the breakout
Indicator:
RSI and MACD bullish golden cross above baseline.
Trade with affordable risk ratio 3:1
Always respect your stop-loss
Good Luck
DP

Update KBANK: Jan 8, 2022My first condition is bullish bias but the secutity price have to move and break resistance zone between 151 - 153 THB and stand on that zone with strong buyer force or large buying volume, then this security can hike up to target price around 180 THB. In another way, the price cannot break the resistance zone and stand on that zone then security price will drop to at least 123 THB.

GEL | Parallel Channel Breakout | Target Entry@Pullback GEL | Thailand SET Index |Construction Material Sector | Price Action Trading
Chart Pattern: Falling Parallel Channel Bullish Reversal
Price Action: Bullish Breakout Entry at PULLBACK position
Target estimated for short-term / long-term shot
Indicator:
> Support line just above EMA200
> RSI bullish signal above MA line
> MACD golden cross above baseline 0
Trade with affordable risk ratio 3:1 at least
Always respect your stop-loss
Good Luck
DP

SIRI : Everything is on the chart,
Actually I really like the CEO.. He's skillful, great executive vision and very well-management
If I didn't do this technical analysis then I'd think it could grow a lot faster
but this is the normal speed of real estate sector i guess.. .
For the time line its only estimation. I could be faster
Fundamental is great, the company is investing in crypto/digital asset
more info DYOR

Thai SET impact from covid19 delta and omicron bad omensBBL ; price plummetted after fear started , when situation got to the worst, price already go up for days, as many can speculate the end of delta wave
at a point, price open gap up, which favor strategy of short and DCA buy back over weeks
gap up 23 aug , dropdown wks=... not quite gap down, more gradual price downtrend, downswing = 9, upswing= 11
kbank ; gap up 23 aug , dropdown wks=4, downswing = 9, upswing= 13
TMB bank (TTB) ; gap up 23 aug , dropdown wks=4, downswing = 17, upswing= 20+ up to now(jan22)
siam cement company (SCC) ; same time gap up but last only 2-3 wks then down for 14 wks, now on uptrend for 4 wks but will see extent of omicron impact
siam cement's paper&packaging company (SCGP) since ipo in 2020 it soared up and up, its theme of online shopping play important role in covid-era. So contradicting price fall
when others went up in late august & start 6 wks downtrend. jan 2022 might start another down trend, as we already had 13 uptrend candles (TD sequential 13)
but will SCGP be seen as covid-defensive stock might limit its downside
From my humble, non-expert, nooby personal opinion, Thai's bluechip stocks could be in danger of omicron impact.
Fundamentally ; afternoon of 5th Jan 2022, SET start falling, without apparent drop but retrospectively ,we guessed insider who seen omicron rising selling a chunk. 6th is public awareness of both us interest rate amped up & earning yield gap in downtrend, Thailand’s institutional side sells twice as much as foreign investor with 3x local investor buying the SET at 1660.
growth of income/profit from SET100/SET50 depends on both domestic economy & tourism alike which both of which would be crippled by this covid19's wave
Technically ' Thai's SET50 index plummetted 8 of last 8 times it hit resistance/support of 979- 999.

AWC and WTZ1 SetupBefore expecting WTZ1 trade Setup, we could take this opportunity to speculate AWC testing the upper range due to closing above POC of VP with gained volume. I made the 1st plan for trading preparation. If it can break out the upper range, we will make another plan for this stock. Good Luck
