"KBANK" wait for buy
117 level is recommend to Buy .
Time CY Day 144 bar .
if FIBO at 78.6 can support .
If not , It will be down trend !!!

APURE and Buy on DipAPURE has been rallied on uptrend during recent weeks. I made another entry by applying buy on dip setup after the first one was triggered last week. POC of VA. and Fibo. R.61.8% was measured for the first target. Don't forget to managing your risks well before trading. Good Luck!

SAMART and WTZ2After descended for several weeks, SAMART is likely reversely moved in early uptrend. I apply WTZ2, one of my favorite setup, for trading in short uptrend. The rewards comparing with risks is competitive. Good Luck!

DEXON and Dbl. BottomDEXON and Dbl. Bottom pattern. I apply AO signal together with TD setup for strategic signals. The setup offer competitive rewards with small risks. Good Luck!

IIG and TD ReinforcementIIG has the reversal pattern of TD Reinforcement in daily chart and also TD Buy Setup in weekly chart. We can apply both chart for trade setup with competitive rewards. However, don't forget to manage your risks well before trading. Good Luck!

TTB TP: 1.60Better banking outlook is good for TTB since the merger because it is still laggard compared to the sector. Target price expected between 1.60-1.80

CBG and WTZ4CBG has moved in downtrend for several months before bullish divergence and other reversal signal appear. I apply WTZ4, one of my favorite setup, for trading strategy. The setup sometimes offer competitive rewards depending on chart patterns. However, don't forget to managing your risks well before trading. Good Luck!


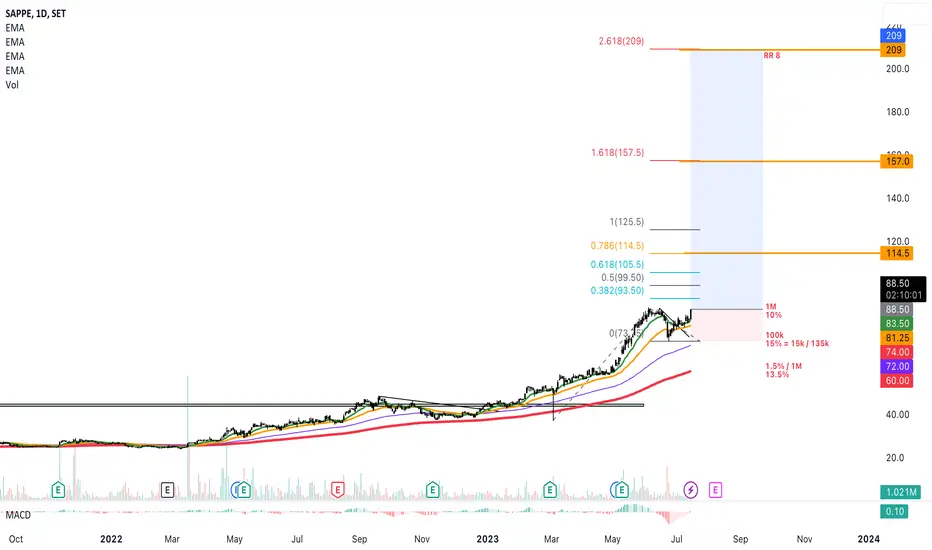
SAPPE (THAI STOCK) 14 FRIDAY JUL 2023The price of SAPPE is very strong. I notice that it created strong up trend since breakout of 2021 trend line.
The price been in strong up trend since then. even the news about inflation and war cannot affect the price of this stock.
Currently, the price is forming bullish flag pattern and wait for break out
TIPCO Completed Rounded Bottom Wave 4 Towards Wave 5 CompletionAccumulation which started since 2021 is come to completion with the completed rounded bottom. Market is trading above the Year Open and have been consistently edging higher on a series of Higher Lows weekly candles. Bullish above 9.50 towards 11.5 (4 years High), breaking which will open further rise to 12.4/5.
A daily/weekly close below 9.30 will invalidate the bullish idea.

A High tight flag?XO has impressively gone up double in just a couple of months, responding the good news that the company has successfully penetrated the US market for the first time.
The chart seems to be forming a High tight flag pattern. The price although did a break on 3rd of July, until today it has gone sideway instead of continuing the bull run. Considering volatility, I don't see a good contraction here but a noticeable long red candle on 21st June 2023 with massive volume (distribution?).
I gave it a pass this time, and monitored closely...

Coming back? probably not yet...HTC pulled back to SMA50 on 23rd June 2023; however, without strength. It was both in the first and second week after the pulling back the price closed below SMA50. Therefore, It's likely that HTC will continue its downward trend.

SFLEX looking good as a big head and shoulder First, Fundamentally, this stock just got JV with one of the Asean's biggest stock in packaging industry like SCGP. This could possibly be a new S-curve for SFLEX. The latest quarterly earning is +204.69%, ROE 8.60%, Freefloat 50.60% (note that its next 2 quarters could also got positive earning due to low base profit on the last year).
Technically, this stock got a big head and shoulder awaits to be breakout. Also, its tf week is looking good for the new uptrend wave.
Let's hope for a good one ^^

"WP" the next "XO" and "SKY" ??No need much to said, the stock (WP) close higher than EMA200 in TF day for the first time, with Buy Signal and First day Uptrend bias. It's looking pretty similar to earlier Big Bull of this year like SKY and XO (you guys can type both of this stock in SET to check them out). Just trader with a good stoploss and if it really a Big Bull just ride along with it!!

BE8 and Harmonic Pattern with TD Buy SetupMost Thai stocks have TD signal after panic sell in last week which are competitive entry for several trade setup. I apply TD Buy Setup together with Harmonic Pattern for BE8. We can have short term trading for rebounding. However, don't forget to managing risks before trading. Good Luck

TIPCO breaks accumulation & does a retesting.Tipco breaks out a symetrical triangle and does a retesting. If it can go up, it might be possible to touch a resistance at 13.5-14 THB.

Wice breaks a down trend line.WICE can break a down trend line with a higher low. So, we can set a trading strategy as LONG position and set a target at the resistance level around 9 THB.
Moreover, if it can break 9 THB, we can expect a target profit by using a combination between FIBO extension and Fixed range analysis. These two methods can give us a resistance level of price to be set as a target profit.

LEO reboundsLeo does not show a new lower low but higher low. RSI shows a bullish divergence. So, this might be a time to hold a BUY position and we can set a target profit around the latest resistance level at 7.25-7.50 THB. This strategy is very simple but so effective.
In addition, if Leo didn't show a lower low of 5.85 THB and runs a price range around 5.85-7.50 THB, this might be an accumulation phase. But this assumption will be confirmed when the price breaks 7.50 THB.

Just forecastLow risk, high reward. The last support is 8.80, in the case of break down the title will be change to high risk, low reward. :)

LEO and TD Buy Setup together with Expected Dbl. BottomIf you are a reversal trader, this stock at the current price might be interesting. I apply TD Buy Setup together with expected Dbl. Bottom. However, I recommend to wait for Bullish divergence in RSI and Awesome oscillator which almost confirm. Don't forget to managing your risks well before trading. Good Luck.

ICHI and TD Buy Setup at TunnelICHI price has been declined for several days and hit at significant support level. I apply TD Buy Setup together with Wave Tunnel for competitive trade setup. The setup provides high rewards with acceptable risks. However, managing your risks before making the order is still recommended.

Malee breaks out a symetrical triangle.Malee can break out a symetrical triangle that is an accumulation phase. Applying Fibo projection can help to see the current price is in the Pivot zone above the accumulation phase.
For my trading, I hold a BUY order at 7.30 THB and be expected that the price can go up to Fibo projection at level 100% or 11 THB.

JTS can break a down trendline. It seems to be a time to hold a BUY position for JTS after it can break out a down trendline and does a retesting. As a short accumulation phase of this stock, so we should look for a short term trading.
We can use Fibo extension together with Fixed range analysis to see VA profile. This can help us to see a price level that might be a resistance level.
