ASW 2023 move onUpdate ASW good stock with 5% yield buy 8.00 thb or under 8.00 and hold , my average is 7.90


LST Buy nice pattern next target 6.35LST just making Lh2 they will make Hh2 soon, Buy here target 6.35

SUPER yes is will 0.55- 0.6 looking for positionHi, super will down to 0.50-0.60 you can looking for your position around here
Fund, look good but chart will not follow this thing for sure, except they run new model of business

SMD Higher High Target Price 9.65SMD , making HH LL in Uptrend SMD will go to 9.65 soon in wave 3 cycle


Dcc tradingBuy at 2.34
Tp 2.7
Sl 2.2
Graph has Bull divergent now and maybe going to close this gap at 2.7

SAWAD | Elliott Wave Projection | Reversal Pattern BreakoutPrice action and chart pattern trading
> Downtrend Elliott wave channel breakout intermediate ABC correction, a possible reversal with minor ABC uptrend wave
> Pullback Entry @ downtrend channel retest at B-wave
> Medium-term target @ volume profile point of control 0.382 retraced previous uptrend major C-wave
> Stoploss @ the lowest minor 5-wave -5% - 10% downside
> risk reward ratio 2:1 +25% upside
Indicator: RSI already oversold wait for a pull back for the long entry
Always trade with affordable risk and respect your stop-loss

MENA : Reversal Pattern As an investor interested in the Thai construction industry, I've been keeping an eye on Mena Transport Public Company Limited. This company provides concrete transportation services in Thailand and has been operating since 1993.
In my opinion, Mena Transport could be a promising investment opportunity for those looking to diversify their portfolio. From a technical analysis standpoint, the Relative Strength Index (RSI) of Mena Transport's stock is currently over 70, indicating an upward trend. Additionally, the stock is showing a reversal trend in technical analysis, which suggests further growth potential.
Beyond the technical analysis, Mena Transport also has strong business performance indicators, which add to the investment appeal of the company. With a good track record and a presence in the Thai construction industry, Mena Transport has the potential to provide strong returns to investors.
Please note that this post is not intended as financial advice or as a recommendation to buy or sell any particular security. As with all investments, it is important to conduct your own research and analysis before making any investment decisions.

III | Elliott Wave Projection - Corrective A Possible Breakout?Price action and chart pattern trading
> Elliott Wave projection - a possible breakout of corrective wave A position at 0.618 retracement of previous wave 5.
> Target Wave B zone estimated at 0.618-0.786 of the current wave A uptrend + 15 - 18% upside again
> Stoploss at the lowest wave A position plus ADR average day range -5 - 7% downside
> RRR 2:1 for short term trade
Always trade with affordable risk and respect your stoploss

JMART | Wave Projection | Target Downtrend Reversal BreakoutPrice action and chart pattern trading setup
> Contracting Wave Channel pattern with downtrend target around the corner.
> Entry @ minor downtrend channel in daily timeframe breakout above SMA200
> TP1 @ wave (3) position
> TP2 @ wave (5) III position for medium term
> Stoploss @ SMA200 downside -9% RRR: 2:1
Indicators signals not shown here:
> Smart money volume support
> Banker chip entry signal

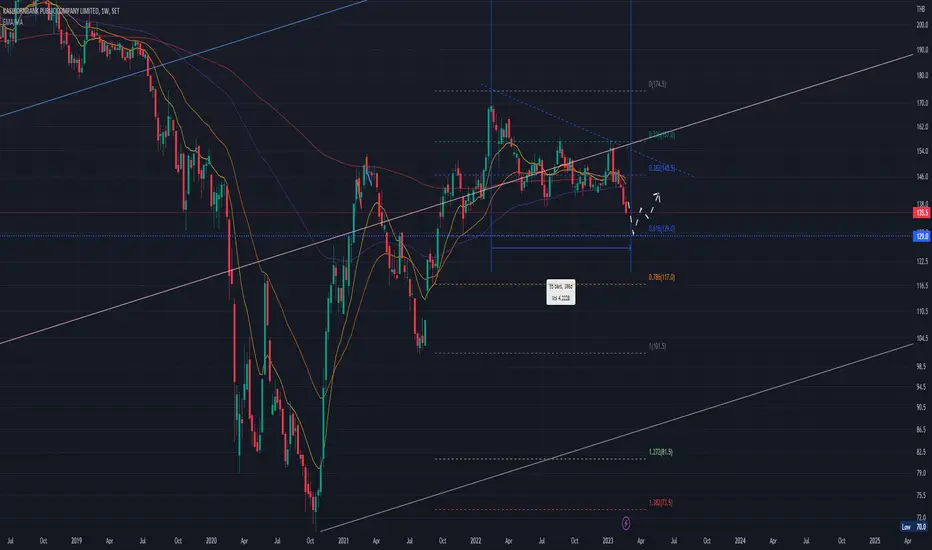
KBANK | Elliott Wave - Wave 4 Support - Target Bull Pennant +30%Price action and chart pattern trading setup
> Overall wave pattern moving in diagonal uptrend with a possible wave 4 triangle sideway.
> Now making a strong pullback to triangle support could be E- wave of ABCDE pattern at EMA200W zone
> Entry : A false triangle breakdown for a possible long entry between S1 and possible S2
> Target : bullish pennant at major wave 5 diagonal zone +30%.
> Stop: Slightly below S2 -5%
Always trade with affordable risk and respect your stoploss
Good Luck

WAVE | Parallel Channel | Doubled Bottom Breakout Trade SetupPrice Action & Chart Pattern Medium Term Trading
> Parallel Channel Trade Setup
> Doubled Bottom | Entry @ Breakout
Indicator:
> Smart Money & Banker Chip Volume Support Timeframe 4H
> BBD bullish signal crossed above baseline
> Fundflow uptrend reversal pattern
> KDJ ribbon changing to uptrend
Trade with affordable risk ratio 2.5:1 for medium term trade
Always respect your stoploss

KBANK : Wait and see
Time Cycle will be 55 week soon
Impotant Fibo at 129 - 130 Baht (61.8)
MACD still negative
That can buy if have backward sinal
EA | Wave Analysis | Short Position - 3.C wave correction -25%Price action and chart pattern trading:
> A possible 3.C wave correction position - pullback entry at EMA20 zone - Target EMA200W / Fibo 0.5 retracement previous major 1 wave zone -25% downside - Stoploss @ wave 3.b position -10-12%
> Fundflow RSI tapping oversold zone but no bullish divergence signal
> BBD below 0 baseline potential lower price trending
> KDJ Stochastic downtrend ribbon continued

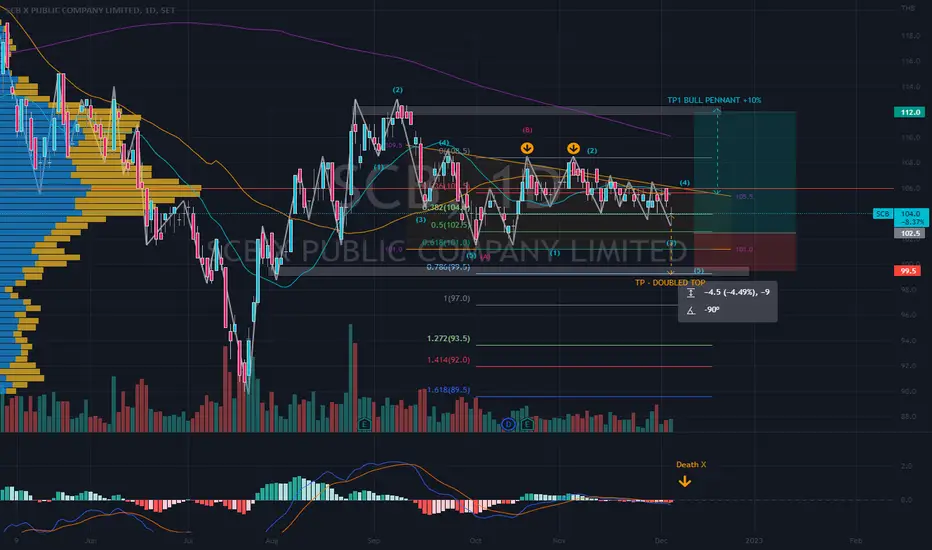
SCB | Wave Projection | Pullback Trade @ Bullish Pennant SupportPrice action and chart pattern trading:
> An possible ABC correction scenario with bullish pennant pattern or descending triangle
> The price currently SMA20 crossing below SMA50 with MACD crossing down bearish support indicator
> PULLBACK TRADE @ bullish pennant support level at a further breakdown with local doubled top pattern targeting -4.5% downside to fibonanci 0.786 extension of previous A-wave support level.
> Risk Reward Ratio 3:1
Always trade with affordable risk and respect your stoploss!
MTC Projection by PKMTC Projection by PK
Red line : Low Zone
Blue line : Medium Zone
Yellow : Faire Price


BRR Projection by PKHybrid VI & Technical
Red line : Low Zone
Blue line : Medium Zone
Yellow : Faire Price

TC Projection by PK Hybrid VI & Technical
Red line : Low Zone
Blue line : Medium Zone
Yellow : Faire Price

AOT | Wave Projection | Rising triangle ABCDE Uptrend TargetPrice action and chart pattern trading setup
> Rising triangle ABCDE pattern @ breakout neckline position
> TP1 estimated @ height of E wave +17% upside 1.618 extension of CDE wave
> Stoploss @ triangle support -8% downside
> RRR: 2:1
Always trade with affordable risk and respect your stop
