#aefes#AEFES Weekly Chart Is For Idea Purposes.
This sharing is based on my own drawing and personal technical analysis.
It does not have any investment advice.
For educational and sharing purposes only.
My interpretation in the relevant stock is shaped through historical data and graphical behavior.
The decision and responsibility belong entirely to the person.
YTD

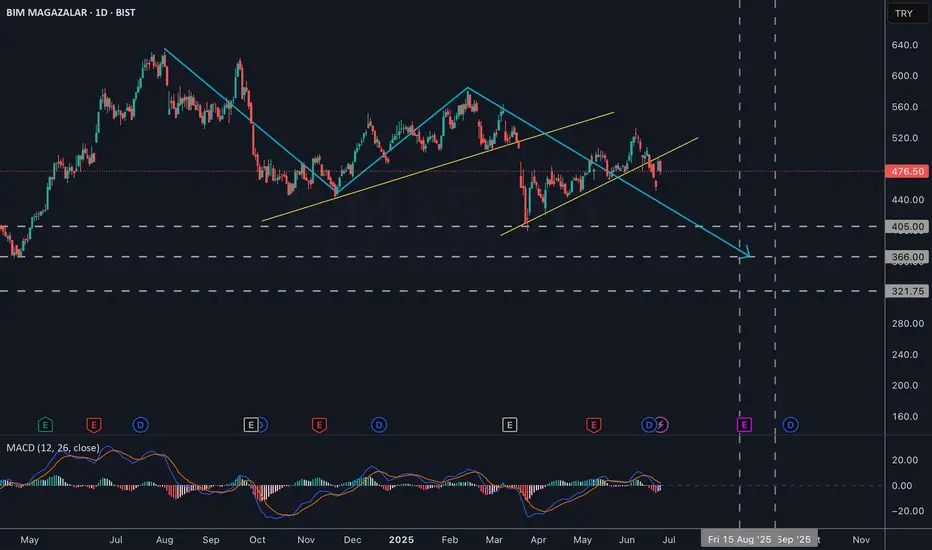
BIMAS - 1DBIMAS has been undergoing a corrective move since August of last year. I anticipate this correction will be completed after a full year. Target zones (in terms of both time and price) have been marked accordingly based on this scenario.
ayocrypt akfye trend analysis shows a huge uptrendAn analysis for artificial intelligence TO CHECK. Please share your ideas with me.

High Risk/reward Ratio for ODAS Long TradeI believe ODAS has not much time for breakout. Stop level should be weekly closure below 4.5 TL which is the testing area of double bottom. Take Profit should be set to fibonacci level 8TL.

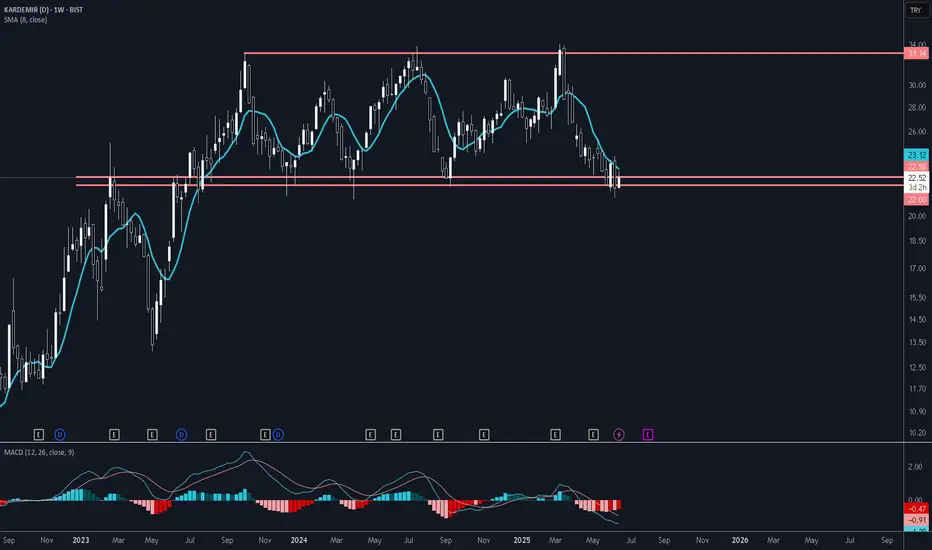
Low Risk for KRDMD Long TradeAs we are close to the bottom line of the horizontal band, long trade is my suggestion in KRDMD. As the stop level would be weekly closure below 22 TL, there is very high risk/reward ratio. I see 25-30% profit is possible if we set the TP as fibonacci 0.618.
AKBNK - 1DMy previous post related to AKBNK was on 3rd of June, 2024 for the maked IV th wave correction.
17th of March, V wave completed and a correction phase has started, we are now heading to marked area to complete the last wave of the correction. Later on we will understand whether this is a simple or a complex correction.

MARKA – C Leg of ABC Ending as Diagonal, Breakout May Target 74₺The C leg of the ABC structure appears to be ending in a diagonal formation.
If the channel breaks upward, the move may extend toward the 74₺ region.

HALKBits not financal advise.
the values that The financial future of this state-owned bank, which has added value in the fast-rising Turkish market, also looks bright

" AYDEM " is undervalued" AYDEM " is undervalued
I would expect a CUP formation based on its financials and strong FIBO suppor.
Good Luck

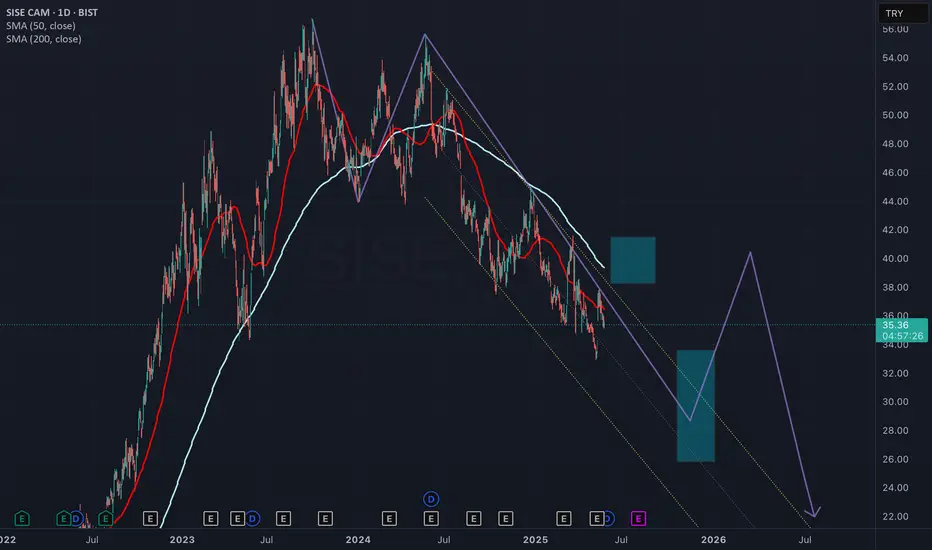
SISE 1DUnfortunately, SISECAM continues to display a negative outlook. In the current chart, it appears that the third wave of the first leg of a zigzag correction has been completed. In this case, a brief corrective upward move is expected, followed by a fifth wave. Potential target zones are marked on the chart.
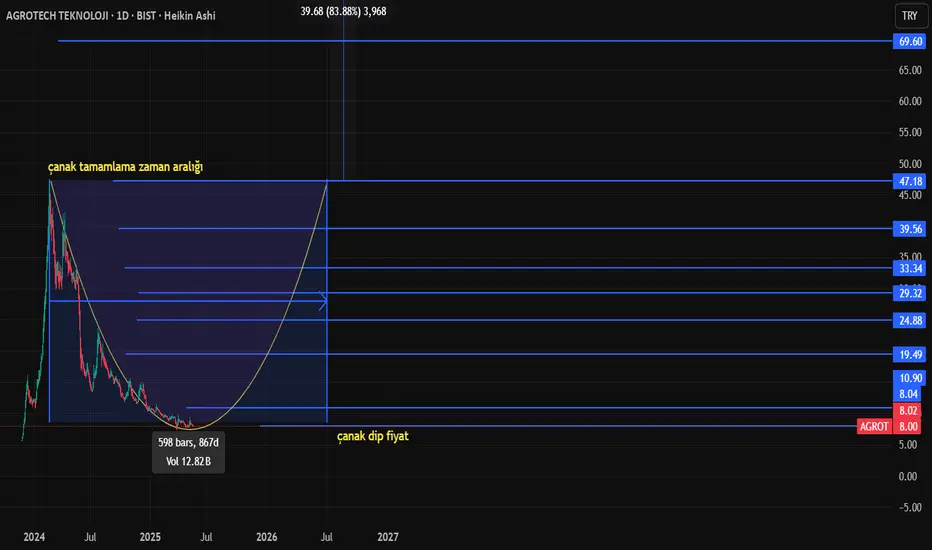
agrot hisse olabiliritesi agrot stock performance and currently being at the bottom of the bowl, if the bowl is completed on July 1, 2026, targets have been determined, fibonachi highest target is 165 liras, after the bowl is completed, the target is 87 liras
Doas düşeni kırdıIt broke the downtrend with volume. There is no obstacle for it to go up anymore. It has been holding for a long time.

BOBET Is FineI think BOBET will continue its ride but for now Im waiting for horizontal resistance area.

bobet is ready to fry #bobet is showing a promising pattern. Historically, the 200-day SMA has acted as strong dynamic support and resistance — and it's being respected again.
Recently, #bobet broke above the 200-day SMA. Before that, a clear double bottom formation appeared — a classic and powerful reversal pattern.
Now, only one major barrier remains: the confluence of key horizontal resistance and the top of the descending channel.
Watch trading volume — we've seen a noticeable spike in recent weeks, which adds weight to the move.
Everything seems set for a new bullish trend.
What we need now is a clean breakout above 25 TRY, a healthy general market, and a well-defined stop-loss. That’s it.

OBASE is BULLISH BIST:OBASE
Strong breakout to the upside from a key level on HTF (1D),
bullish flag on LTF (1–4h),
EMA 20–50 bullish crossover + SMA 200 breakout to the upside.
I'm seeing a 1:7 RRR.
2D ATR stop loss: 29.60 TL
Take profit: 55.30 TL

AKSA AKRILIK - DAILYMoving in the same channel till 2022 with an uptrend. Expect to see price down to 3 defined targets and then move north till the end of July to finalize the cycle.

Reacting to the major support zone of 350–370 TRYReacting to the major support zone of 350–370 TRY, #BRSAN has shown some activity spikes. Above, there are two strong dynamic resistances — the descending trendline and the 200-day SMA. Since they are tangent, their importance is even higher.
A strong breakout above both could signal the start of a new trend. We also need to see a spike in trading volume to confirm it.
This is not a recommendation, just an observation.


OYAKC - Monthly // Decision Month - LONG TERM LEVELSI believe that this month is decision month for OYAKC.Either 600 days accumulation or 600 days ATHs. Any TURP problem could occur in Turkey so check the levels.
Monthly Close below 25.6 - SL
I'll be buying it till 2030.
DYOR.

S1 ALTIN SHORT TERM CORRECTIONCorrection confirmation line (green line) and expected buy zone is marked on the graphic. Deep correction is also marked with red line (low probability).
Buying partially to anchor to the bottom of the buy zone might be a good strategy.


