LULU (ADX) The correction’s cooked!!🔥 LULU (ADX) – 1H Timeframe
Lulu Retail Holdings PLC
“LULU just cracked structure at 1.34 and flipped the script. The correction’s cooked, momentum’s shifting, and the bulls are looking to ride this wave straight into those stacked supply zones. Stops are tight, upside’s clean — this is where the move begins.”
🧠 Elliott Wave Breakdown
🔁 Wave (1) and (2) appear locked in
✅ Break of Structure (BOS) above 1.34 confirms bullish reversal
🔼 Price now riding Wave (3) with pullback forming Wave (4) setup
🔺 Final target projected in Wave (5) zone at 1.79 – 1.84
🎯 Trade Setup
Entry 1.35 (current zone)
Stop Loss (tight)** Below trendline @ ~1.31 (for conservative traders)
Stop Loss (wide)** 1.25 (below demand zone for higher tolerance)
Take Profit 1.79 – 1.84
R/R Ratio ~1:3.2 – 1:4.5
“All structure, no noise. When price breaks out and retests clean, you either trust the wave or stay flat. That demand zone held — now let the market do its job.”
⚠️ Disclaimer
This analysis is for educational purposes only. Not financial advice. Use stop-loss strategies that fit your risk profile.

BILDCO (ADX) Bulls are Loading🔥 BILDCO (ADX) – 2H Timeframe
“BILDCO just dropped the hammer with that BOS confirmation. ABC correction’s done, accumulation is real. Bulls are loading. With structure flipping bullish and a clean Wave 3 setup in motion, this could rip hard to 1.30+.”
Elliott Wave Breakdown:
✅ Completed ABC correction into Demand Zone
🔺 Wave (1) and (2) of new impulse appear complete
✅ Break of Structure (BOS) confirmed at 0.745
🔼 Bullish trajectory projecting into Wave (3) → (4) → (5) targeting 1.30–1.38
🎯 Trade Setup
Parameter Level
Entry 0.76 (current zone)
Stop Loss Below 0.74 (BOS zone)
Take Profit 1.30 / 1.38
Risk/Reward ~1:3.5+
“Structure tells the story. Volume confirms the chapter. The wave shows the climax.”
⚠️ Disclaimer
Educational content only. This is not financial advice. Trade at your own risk and use proper risk management.

DUBAI ELECTRICITY (DEWA) running a clean Elliott🔥 DUBAI ELECTRICITY (DEWA)
“DEWA’s running a clean Elliott textbook: ABC down, new impulse up. The bulls stepped in hard at the C-wave low — textbook demand zone reaction. Now riding Wave 3 with momentum, and 3.06 is the magnet.”
### 🌀 **Elliott Wave Breakdown**
* ✅ Completed impulse: Wave **(1)-(5)** topped near **2.90**
* 🔻 Correction: **ABC** Zigzag down to strong demand zone (**C** low = liquidity sweep)
* 🟢 New bullish impulse unfolding:
* Wave **(1)** and **(2)** of the new cycle complete
* Currently riding Wave **(3)** targeting **2.88(Wave 3), 3.06 (Wave 5)**
* Smart money likely stepped in at Wave (C) low
* **3.06:** Target zone & projected Wave (5) high
---
### 🧮 **Fibonacci Extension**
Wave (3)target ≈ **2.87 –
Wave 5 target 3.06
## 🎯 **Trade Plan**
| --------------- | ----------------------------------- |
| **Entry** | Market @ 2.72 or pullback near 2.60 |
| **Stop Loss** | Below 2.43 (demand zone) |
| **Take Profit** | 3.06 (Wave (5) projection) |
| **Risk/Reward** | \~1:3.2 |
*“The market moves in waves. Ride the impulse, survive the correction.”*
### ⚠️ **Disclaimer**
> This is an educational analysis, not financial advice. Always use a stop loss. DYOR before entering any position.

SALIK (DFM) BOS confirmed the bulls are back in charge### 🌀 **Elliott Wave Structure**
* The stock completed a textbook 5-wave impulse (1 → 5).
* Followed by a complex **ABCDE correction**, ending with a liquidity sweep on Wave (E).
* Current price action is a **bullish breakout** — likely the start of a **new impulsive cycle**.
### 📐 **Fibonacci Extension Target**
* **7.35 = 100% Fib extension** of previous impulse (Wave 1–5), projected from Wave (E).
## 🎯 **Trading Setup**
| **Entry** | Market @ 5.90 |
| **Stop Loss** | Below 4.75 (beneath main OB) |
| **Take Profit** | 7.35 (100% Fib extension ) |
| **R/R Ratio** | \~1:3.6 |
---
> “SALIK finally ripped through resistance like butter. BOS confirmed the bulls are back in charge. That 7.35 target? It’s not just a guess — it’s fib math.”
> *“Fibonacci is the map. Price is the vehicle. Volume is the fuel.”*
---
### ⚠️ **Disclaimer**
> This is not financial advice. For educational purposes only. Always manage risk and use stop losses. Past performance doesn’t guarantee future results.

DUBAI TAXI COMPANY (DTC) Riding The Ascending ChannelDTC’s bouncing clean off the old resistance, now strong demand. Classic flip. Riding within an ascending channel, eyeing 2.75+ — just needs volume to push through
### 🟢 **Support Turned Demand Zone**
* The **previous resistance zone** around **2.33 – 2.42** has flipped into a **strong support/demand zone**.
* Price dipped into this zone and sharply bounced, confirming **buy-side absorption** at that level.
* Classic **S/R Flip** behavior – ideal for long setups.
* **Ascending channel** is developing — price respecting both upper and lower trendlines.
* Higher highs and higher lows = bullish structure in play.
* Channel is guiding price towards **next resistance/supply levels**.
### 🟡 **Supply Zones**
* **2.75 – 2.85**: Marked supply zone with heavy volume profile clusters — likely profit-taking or institutional selling pressure.
* Expect some turbulence or partial TP in that area.
---
### 📉 **RSI Perspective**
* The bounce from demand zone came with **low RSI** — signaling **bullish divergence** or **oversold** conditions
* Another bullish technical confirmation for current long bias
---
## 🎯 **Trading Plan**
| **Entry** | 2.54 – 2.56 (channel support retest) |
| **Stop Loss** | Below 2.42 (under demand zone) |
| **Take Profit ** | 2.85 (major supply zone) |
| **R/R Ratio** | Approx **1:2.8** |
---
> *“Every resistance broken becomes a soldier in the support army.”*
---
### ⚠️ **Disclaimer**
> This analysis is for educational purposes only and not financial advice. Always do your own research and use stop losses.

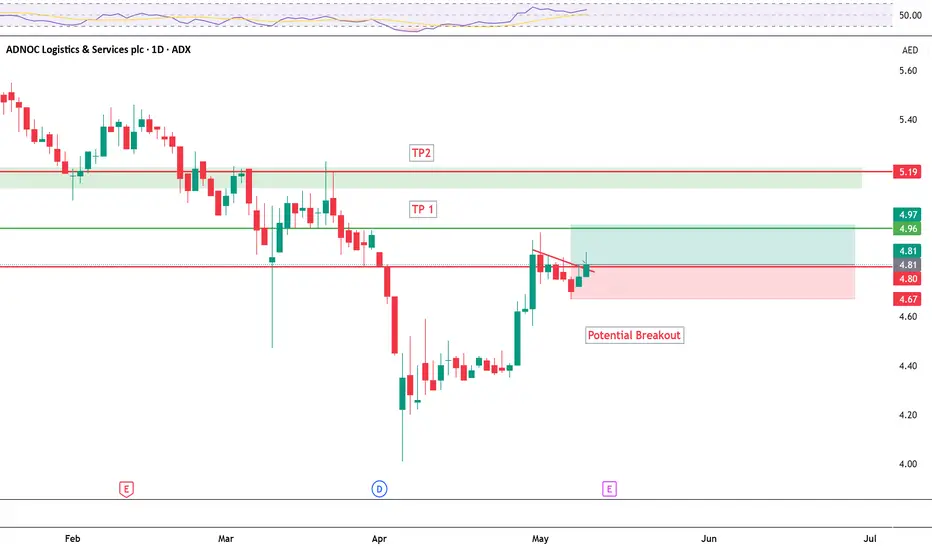
AdnocLS ( Potential Breakout)Adnoc logistics after consolidating for few days looking good for potential breakout.
A possible trend change after a 3-year slideEAND has been in a downtrend since April 2022, but we could be witnessing the start of a reversal into an uptrend. Price has been consolidating since the beginning of 2025 and now shows signs of a breakout, supported by a strong recent earnings report.
Key Highlights
✔️ Robust earnings growth
✔️ Strong balance sheet
✔️ Technical setup showing breakout potential
✔️ Positive sentiment returning to the sector
This could be a turning point for EAND, a break above key resistance may signal further upside.
Do your own research and manage risk accordingly.

DFM : DIB - Trade Plan - Good Bounce at Fibonacci RetracementGood Day, Traders!
The Stock DIB at #DFM bounced twice from Golden Ratio of Fibonacci Retracement after providing dividend. This makes the golden ratio a respectable support. The stock is expected to rise from here with few corrections. We may have a profit taking opportunity. Good volumes further enforces this idea. The trade maybe taken now if not taken earlier. Below is a trade plan:
Trade Plan:
Buy: 7.00
Stop Loss: 6.42
Take Profits: 7.68 & 7.92
Happy Trading!

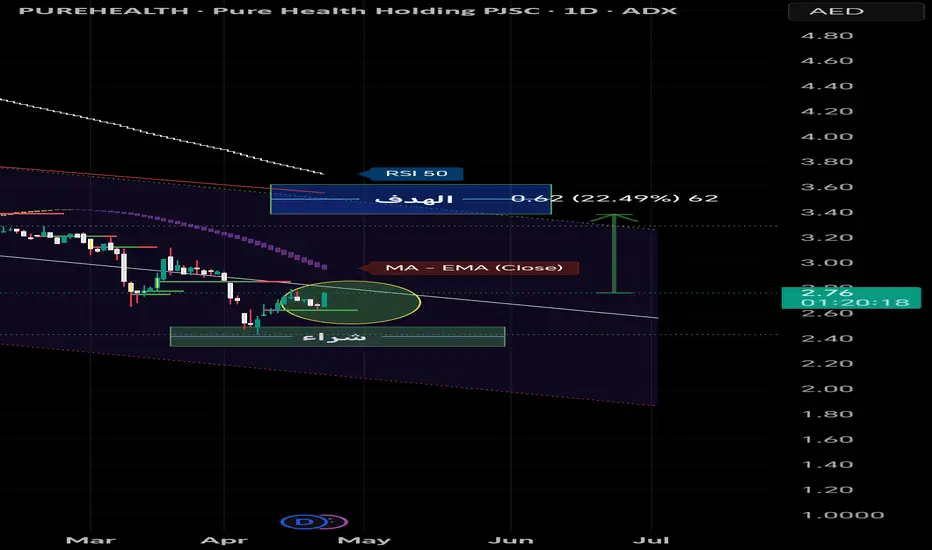
positive for the stockThe analysis is positive for the stock and there is a possibility of a 20% increase.
ADX LULU | Bullish Divergence | Possible Reversal | Trade PlanGood Day Trader!
We observe a Bullish Divergence between the last two Lower Lows. There are three scenarios:
Scenario 1: The bullish divergence will take effect and the price will rise.
Scenario 2: The price can go sideways for consolidation.
Scenario 3: The price may ignore the bullish divergence and continue to drop forming new HL and LL.
We will take positions at the breakout. Accordingly refer to the suggested trade plan.
TRADE PLAN
Buy : 1.39
Stop Loss: 1.09
Take Profit: 1.69
Risk/Reward Ratio: 1.0
Follow me for more analysis!
Happy Trading!

ADIB - Price action testing Fibonacci Retracement RatiosThe Price is testing the Fibonacci Retracement levels and is expected to continue uptrend. Good opportunity to buy at these levels. These levels are indicated on the chart.

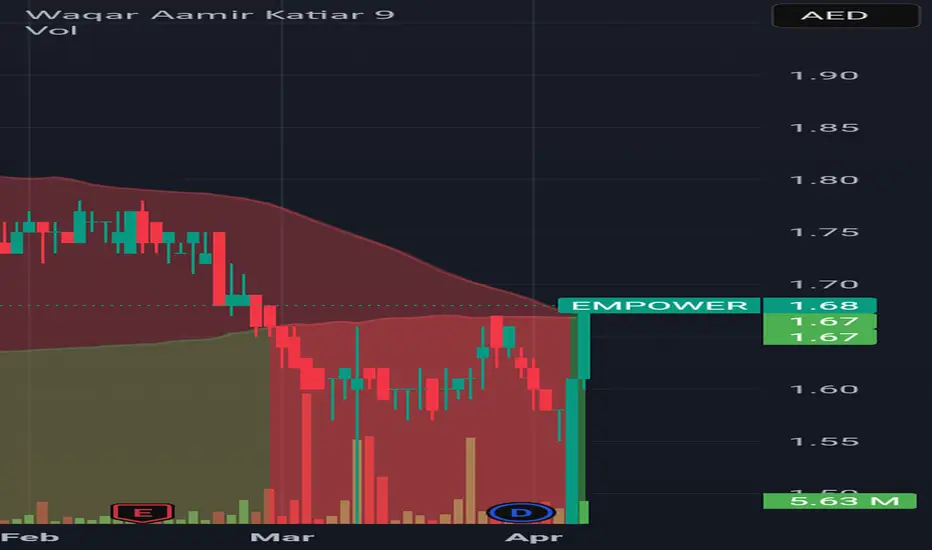
Empower is ready to fly Empower is entered into bullish zone and it will rise again.
Note: this is not a buy sell call. Use stop loss too.
Salik is entered into Bullish zone Salik was dropped few days ago and it is now entered into bullish zone. May be it cross 5.5 and 5.7 level soon
This is not a buy sell call. Trade at your own will.

Potential Rebound on Abu Dhabi Aviation – Technical Setup Near KTechnical analysis for Abu Dhabi Aviation (ADX:ADAVIATION)
The stock is currently trading near a strong support zone between 5.48 and 5.60 AED, a level that previously triggered a sharp bullish move.
With selling momentum weakening and price stabilizing, there’s a potential for a new bounce if bullish confirmation appears.
⸻
Key Technical Highlights:
• Fibonacci retracement from 5.48 to 6.64 shows price hovering near the 78.6% level – a classic reversal zone.
• RSI is in neutral territory, suggesting balanced momentum.
• MACD is flattening, with a possible bullish crossover building up.
• Volume Profile shows significant accumulation around 5.60 AED.
⸻
Bullish Scenario:
If the stock breaks above 5.98 AED, this may trigger a move toward:
• 6.16 AED
• 6.40 AED
• Potential extension to 6.70 AED
⸻
Bearish Scenario:
A confirmed break below 5.48 AED would invalidate the bullish setup.
⸻
Disclaimer: This is not a buy or sell recommendation. This analysis is for educational and informational purposes only.
⸻

Salama price action is bullishDFM:SALAMA seems to have bottomed out, it created a solid base and is ready to post some gains. Long the break out to target 0.5 AED, stop daily close below 0.395 AED.
PS. My views only not financial advice!

ADX: MULTIPLY - Good Recovery, Corrections zone, Trade PlanThe stocks MULTIPLY bounced from a major resistance with bullish candles and consecutive green closing. We also observed bullish divergences in the past month.
Currently the price is in between a resistance and support zones. We saw a red candle closing today which can be a good sign. For a sustained bulls run, it is important that the price correct itself and spend some time here.
The trade plan is to enter just above the current resistance zone. Keep the stop loss at the major resistance. An earlier entry may be taken but might be risky. In this early entry keep the stop loss below the current support zone. It is suggested to keep booking profits along the bull run for the current stock.
Trade Plan:
Potential Entry: 1.91
Stop Loss: 1.56
Take Profit: 2.30

Technical Analysis of Talabat Holding PL (TALABAT) StockPrice Levels
Current Price: 1.41 AED
High: 1.61 AED - Low: 1.40 AED
Ask Price: 1.42 AED - Bid Price: 1.41 AED
Trend Analysis
The stock has been in a downward trend since early March, with consistent lower highs and lower lows.
A sharp drop occurred recently, pushing the price below key moving averages.
Price is trading below the Ichimoku Cloud, indicating a strong bearish momentum.
Technical Indicators
✅ Relative Strength Index (RSI)
RSI is below 30, signaling that the stock is oversold.
A potential short-term rebound could happen if buyers step in.
✅ Moving Averages
The stock is below all major moving averages, which confirms the bearish trend.
Unless it crosses above resistance levels (1.46-1.50 AED), the trend is likely to continue downward.
✅ Volume Analysis
There is a slight increase in selling volume, reinforcing the bearish pressure.
A shift in volume could indicate a trend reversal, so monitoring volume spikes is crucial.
Support and Resistance
Support Level: 1.40 AED (A break below could accelerate selling)
Resistance Levels:
1.46 AED (Short-term resistance)
1.50 AED (Stronger resistance level)
1.55-1.60 AED (Major resistance, needs strong buying pressure to break)
Recommended Approach
For short-term traders: Wait for a confirmation of a bounce before entering. If 1.40 AED holds, a small rebound to 1.46-1.50 AED is possible.
For long-term investors: Avoid buying until there’s a clear breakout above 1.50 AED with strong volume.
Stop Loss: If you are already holding, consider setting a stop-loss below 1.38 AED to manage risks.
⚠️ Risk Warning: If the price fails to hold 1.40 AED, further downside movement towards 1.35-1.30 AED may occur.

DFM:SALIK - Continuation (Flag & Pole) PatternSALIK is expected to continue upward trend. Position may be taken as per the below trade plan and risk:
Buy @ 5.91
Take Profit @ 7.11
Take Profit @ 8.31
Stop Loss @ 4.73

ADX:ADNOCLS a bearish chart patternA double top bearish pattern is formed for ADNOCLS, the price may drop to 4.15.

SIB (Sharjah Islamic Bank) ADXSIB have been in uptrend from November till now with outstanding financial performance ~26%, RSI is now below 50 so it is a good time to jump and hold the stock looking for further growth.

Al Salam (SALAM) DFM Buy Opportunity"SALAM " (Al Salam Bank) Recently bounced from a Daily Demand Zone, and breaking the downward correction trend line.
Buying Opportunity: The stock is currently at a discounted level and likely to resume the up trend again.
Trade safe.. :)

Dubai Financial Market (DFM) – A New Bull Cycle Emerging?# **Dubai Financial Market (DFM) – A New Bull Cycle Emerging? 🚀📈**
If you think that Dubai Stock Market has already had hits moment, think again - the real party is just about to begin!
The Dubai Financial Market (DFM) has historically followed a **clear cyclical pattern**, with **three major market cycles** observed over the past two decades.
- **Cycle 1 (2005-2009)**: A strong bull rally followed by a deep correction.
- **Cycle 2 (2013-2015)**: Another rally that led to a sharp decline.
- **Cycle 3 (2021-2022)**: A similar structure, with a bullish phase and subsequent retracement.
## **Are We Entering Cycle 4? 🔥**
Recent price action suggests a potential **breakout above the long-term downward trendline**, a signal that a new bull cycle **could be starting.**
🚀 **This could be the start of a multi-year bull cycle!** this could signal an excellent buying opportunity.
📊 **What do you think? Are we ready for another Dubai bull market? Let me know in the comments!** 🔥📢
#DFM #DubaiStocks #StockMarket #Trading #Breakout #BullCycle #Investment 🚀

UPP consolidated and maybe ready to move higherDFM:UPP is expected to post some gains, targets on the chart. Stop loss daily close below 0.4 AED.
PS. My view only not financial advice!
