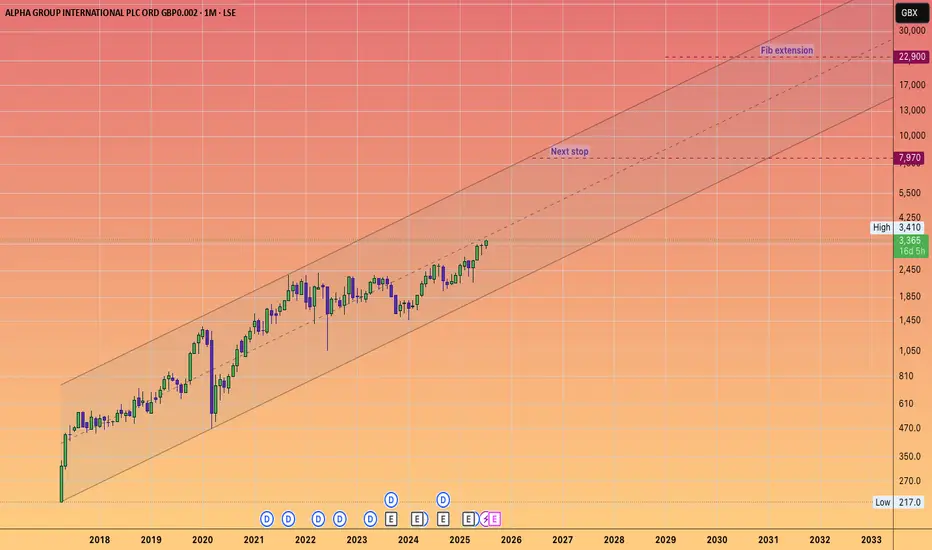
ALPHA GROUP INTERNATIONAL will keep its momentum going!#ALPHA is a fintech company that offers currency risk management and payment solutions.
With a price-to-earnings ratio of approximately 12,
it signifies a solid investment for a growth-oriented fintech firm that is increasing its earnings by about 20 to 25% annually.
In light of the #UKX breaking through and reaching new highs, and beginning to accelerate towards my long-standing projections that the FTSE would hit 5 figures, ALPHA appears to be a unique opportunity in the UK markets, which, as we know, are relatively sparse compared to the USA.
Given the inability to purchase shares of #Revolut, it is likely that capital will flow into this ticker.

POWER METALHello guys, good ?
POW idea.
Large bullflag breakout. For safe enter, you need to wait monthly candle close.
This stabilisation is very very a good sign.
Levels are clean now.
RSI breakout too.
Good luck :)

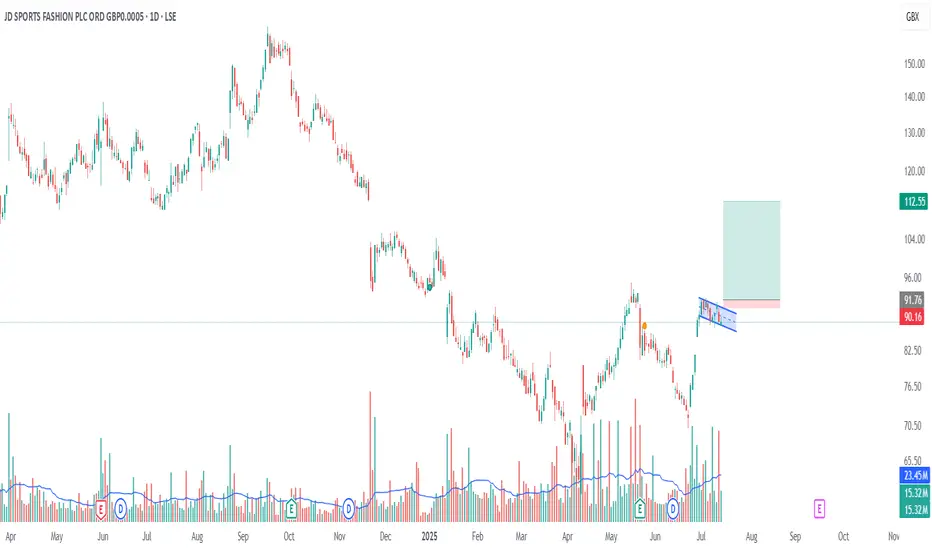
Bull Flag Formation on the Daily ChartA bull flag pattern is forming on the 1-day chart, supported by a steady increase in volume—suggesting growing bullish momentum.
Flagpole base: ~72
Potential breakout level: ~92
First price target (PT1): ~100 (next key resistance level)
Measured move target (PT2): ~112 (based on flagpole height)
This setup indicates a strong potential for continuation if price breaks above the 92 level with volume confirmation.
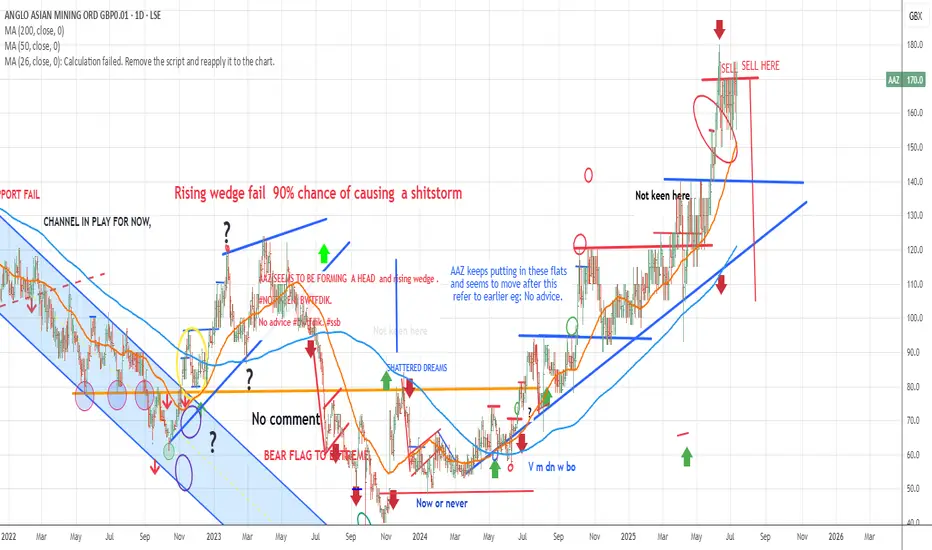
"AAZ" SHORT AAZ have really won on the no liquid play.
Chart is very top heavy and the location worries my investors.
BWTFDIK
SSB
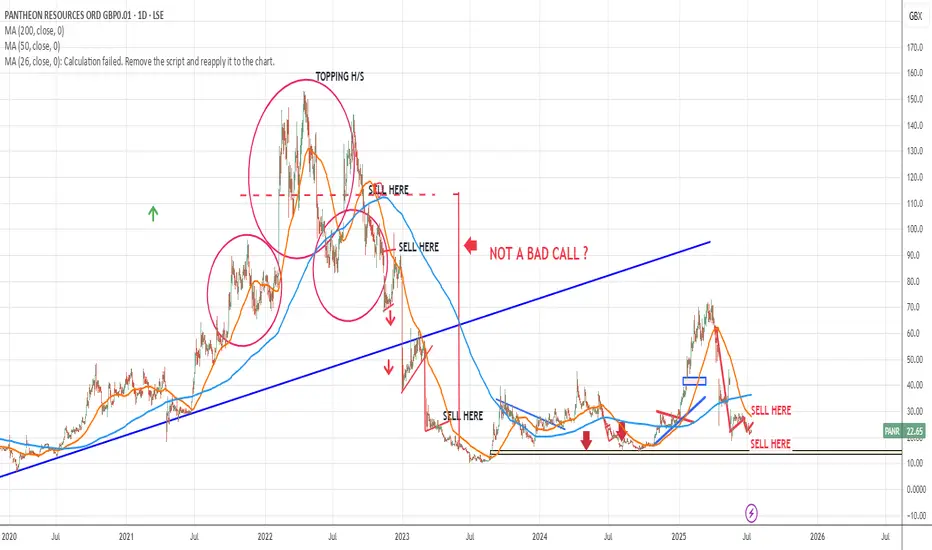
"PANR" shortI gave a sell signal around November 2022.
Look back..
No way this is a real share,,
BWTFDIK
SSB
Once every 2 years Opportunity!The price has been respecting a bullish weekly trendline since 2013. On average, the price was touching and rejecting the trendline every 2.2 years since 2013. Following rejection it took the stock approx 1.75 years to reach an averaged gain of 160%. Now we are at that opportunity again and there's high potential for a rejection and continuation. In the next 1.5 years it's highly probable to reach a conservative gain of 70% from where the stock currently sits at.

Silver Bear together with equity crash (SPX/NDX/DAX)Ride the wave down on your surf board. Fresnille will kneel a 20 % where tech firms might go down 40-50% (e.g. Apple)


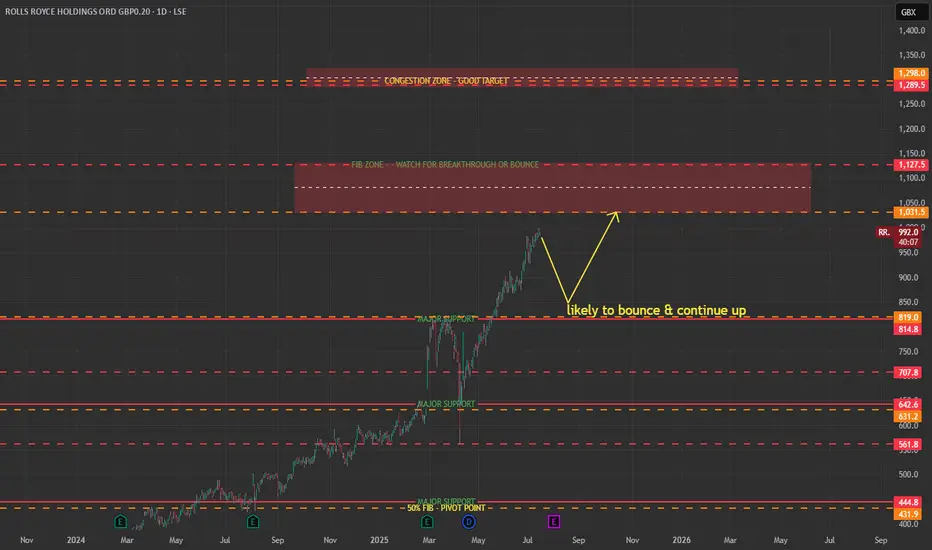
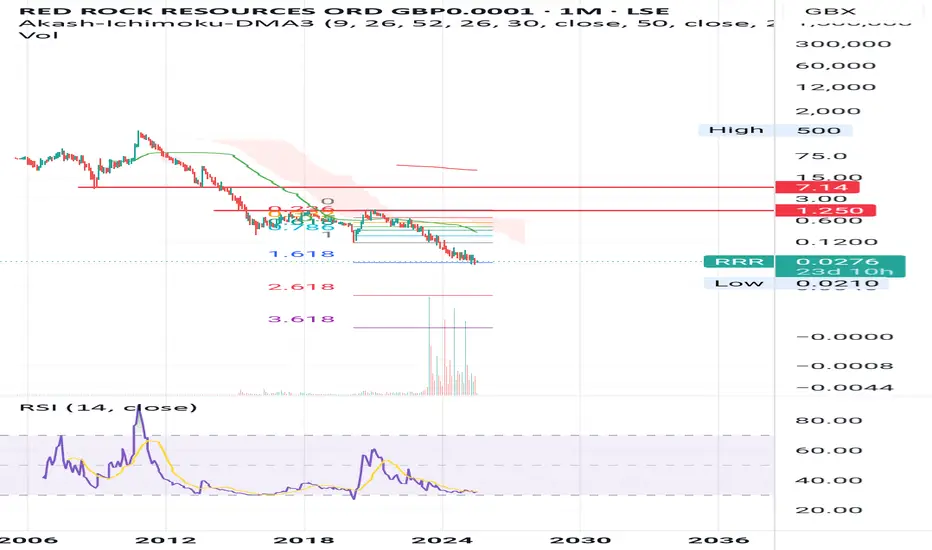
RRR potential reversal point TA view only
I haven't checked their statements or current position
Not financial advice
#FTC Filtronic. UK stock exchange Interesting point in timeI don't hold but Filtronic is an expanding company in RF (Radio Frequency) Innovation and Engineering.
Its price has increased eleven times over last two years!👍
Now it has fallen out of the rising orange channel for the first time in 2mths BUT is forming nice blue continuation flag.
Which will win? We'll have to wait and see. Key pure ion nit.
PDYOR

Breakout on Vodafone?Looks like a Head and shoulders reversal, plus breakout this week. Too early to say though as it still needs confirmation. Could still be a fake-out?
This is not a solicitation to trade in Vodafone shares.

ATG forming a right shoulder?Is this a textbook H&S pattern being formed? 643 is break out/neck line and 912 is the target. Looks like it and reversal will be know by September to November 2025.
This is not a solicitation to trade in ATG shares.

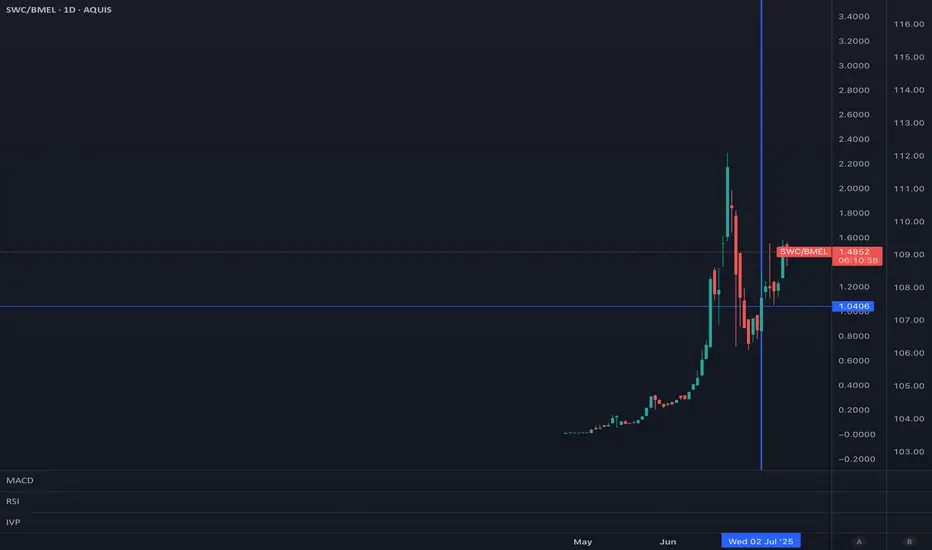
ARB update Deadly news.
But I will buy like £100 of ARB at approx 0.3 as I believe they will pull out once Bitcoin starts moving further.
Not financial advice

Head and Shoulders Pattern on the 1H and Daily TimeframesKey Observations:
1. **Bullish Gartley Pattern on the 2-Day Timeframe**
- This is a strong reversal pattern, indicating potential upside.
2. **Head and Shoulders Pattern on the 1H and Daily Timeframes**
- The **inverted head and shoulders** suggests a bullish breakout, especially after a long consolidation phase.
3. **Consolidation for Almost 3 Years**
- If this consolidation is ending, a breakout could be significant.
4. **Indicators Showing Bullish Divergence**
- **MACD turning up**
- **RSI divergence (lower price, higher RSI)**
### Potential Upside Target: **178 GBX**
- If the reversal plays out, your projection to **178 GBX** is possible.
However, keep an eye on key resistance levels like **116.4**, **127.3**, and **151.5**. If price struggles at these levels, short-term retracements might occur before a full breakout.
As of June 2024, Alphawave IP Group plc (LON:AWE) reported the following financial figures:
- **Debt-to-Equity Ratio**: 49.6%, with total debt of US$217.9 million and total equity of US$439.2 million. citeturn0search0
- **Cash and Cash Equivalents**: US$76.3 million. citeturn0search0
Additionally, the company's total assets were US$873.0 million, and total liabilities amounted to US$433.8 million. citeturn0search0
These figures indicate that Alphawave IP Group has a moderate level of debt relative to its equity and maintains a cash position that contributes to its financial flexibility.
⚠ **Not Financial Advice** – Always manage risk and confirm signals before trading.

Short WISE as leading diagonal has been completedWISE can be shorted with the first target at the lower edge of the diagonal and then, at around 800 pence (start of wave 5), if move lower confirmed.
Clear RSI divergence shows trend reversal in the short-term at least (until touching lower band of the diagonal). So the lowest upside is around 14-16% here.
SL can be set to 1230 pence.

RECORD long!The fundamentals are attractive, and price is testing key monthly horizontal support. Seems like a good opportunity.
LSE:REC

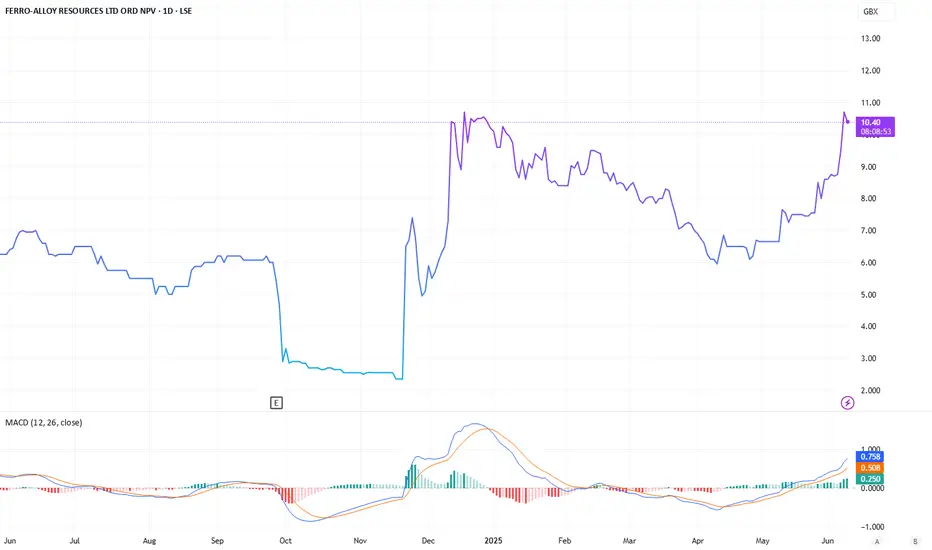
Ferro-Alloy and Eurasia Mining:High-Potential Mining InvestmentsIn the volatile world of mining, where geopolitical risks and market fluctuations often overshadow opportunities, two companies stand out for their potential to deliver significant returns: Ferro-Alloy Resources and Eurasia Mining. Both are focused on critical minerals-vanadium and platinum group metals (PGMs), respectively-that are essential for the global energy transition. With ambitious projects, strong financial backing, and strategic positioning in emerging markets, they offer investors a unique chance to capitalize on the growing demand for these resources. However, their path to success is fraught with challenges, including regulatory hurdles and operational risks. I suggest exploring the investment potential of these companies, including their strengths, opportunities, and risks, of course. Because where can we step without potential risks today?
Ferro-Alloy Resources: A Rising Star in Vanadium
Ferro-Alloy Resources (FERRO-LSE:FAR), dual-listed on the London Stock Exchange (LSE) and the Astana International Exchange (AIX), is developing the Balasausqandiq vanadium deposit in Southern Kazakhstan. With a market capitalization of $66 million and net debt of $13 million, Ferro-Alloy is well-positioned to benefit from the rising demand for vanadium, which is used in energy storage and steel production.
The Balasausqandiq project is unique due to its potential for the lowest cash-cost vanadium production in the industry. A phased development plan, supported by a robust financial model, promises an impressive internal rate of return (IRR) of 30%. This high return is driven by low operating costs and vanadium’s strategic importance to the renewable energy transition. Specifically, vanadium redox flow batteries (VRFBs) are expected to see exponential growth as large-scale energy storage becomes critical for integrating wind and solar power.
The company’s shareholder base includes Vision Blue Resources with a 22.9% stake, providing capital and strategic guidance from industry veterans. Leadership, including CEO Nicholas Bridgen, brings decades of experience in mining and finance. However, the project’s location in Kazakhstan, while relatively geopolitically stable, carries risks of regulatory changes and infrastructure development. Additionally, reliance on external financing could expose the company to market volatility.
Nevertheless, Ferro-Alloy’s potential is clear. As vanadium demand is likely to outstrip supply by 2030, the Balasausqandiq project could position the company as a key player in the global market. For investors willing to embrace the risks, Ferro-Alloy offers an attractive opportunity to invest in a critical mineral with a bright future.
Eurasia Mining: A Future Leader in PGM Extraction
Eurasia Mining LSE:EUA , listed on London’s AIM market, focuses on a portfolio of PGM and nickel projects in the Arctic region. With a market capitalization of around $100 million, the company has garnered attention for its plans to revive the Monchetundra and NKT projects, which together hold over 184.6 million ounces of platinum equivalent.
The company’s strategy has shifted toward selling these assets - a process initiated in 2020. Recent geopolitical developments have rekindled interest in Eurasia’s projects. According to Oak Securities , the target price for the company’s shares is six times the current level, reflecting their immense potential.
The flagship NKT project is a Tier-1 nickel sulfide deposit with a net present value (NPV) ranging from $1.2 to $1.7 billion (per a 2021 report). The project benefits from proximity to a major processing plant, reducing capital expenditures. Additionally, the West Kytlim project in the Urals is already operational and generating cash flow.
However, investing in Eurasia Mining comes with risks. The company’s assets are located in a region with geopolitical challenges. Despite signs of potential collaboration on critical minerals, the situation remains unstable. Potential regulatory changes, international trade restrictions, or political upheavals could derail the company’s plans. Price volatility in commodities and operational complexities also pose challenges.
Despite these hurdles, Eurasia’s growth potential is pretty promising. A dual listing on the AIX in Kazakhstan opens access to investors from various regions, potentially boosting liquidity and valuation. For investors with a high risk tolerance, Eurasia Mining offers a rare opportunity to tap into the PGM and nickel markets.
Balancing Risks and Opportunities
Both Ferro-Alloy Resources and Eurasia Mining present compelling investment prospects, but with several notable risks, of course. Ferro-Alloy’s success hinges on widespread VRFB adoption, while Eurasia Mining must navigate Russia’s geopolitical challenges. For people, whose attention has been caught by these companies, the key to success lies in understanding these risks and balancing them against potential rewards. Diversification, thorough analysis, and a long-term perspective are essential when investing in mining companies, especially in emerging markets. But for those, willing to take the leap, these companies may offer unique opportunities in the critical minerals sector.
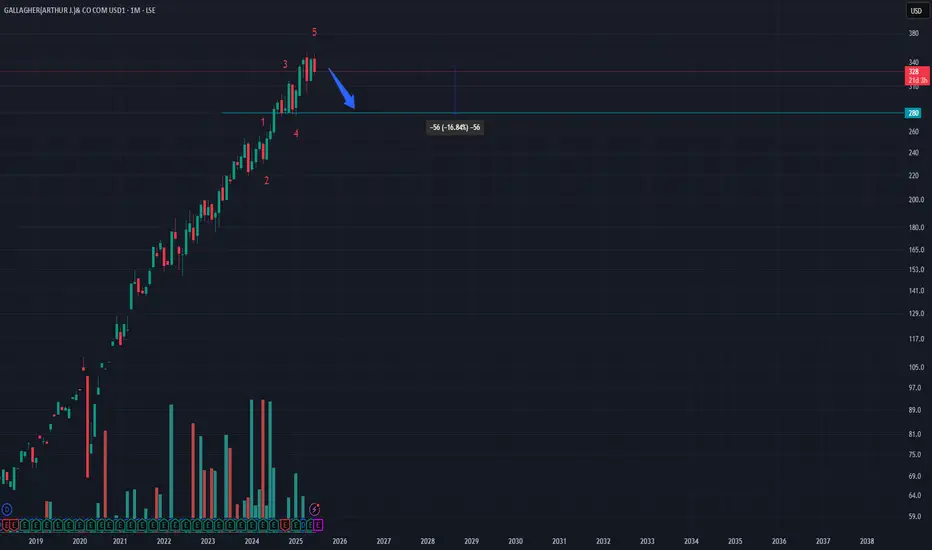
GALLAGHER (AJG) – Completed Impulse Wave Could Break the UptrendThe chart shows a fully completed 5-wave impulse structure at the top. This signals a potential break in the prevailing uptrend. The risk of a correction has increased, with a likely minimum pullback of around 15%, targeting the $280 level.
Price action around the trendline and previous wave 4 support should be monitored closely.
Is it Wise to invest now?Bullish momentum on this stock, as we break towards the IPO highs. This is largely because Wise plans to move their primary listing to America. But let's not get caught up in the excitement here and analyse the charts and the financials. Looking at the financial statements of this company, they’re not expanding profit margins as they aggressively cut their fees to fuel their growth. Furthermore, the technicals suggest the final wave 5, a bearish ascending channel and a potential double top - I’m not convinced this run is sustainable.
So no, it’s not wise to invest right now. Personally I’d remain patient and wait for a better entry.
Not financial advice.

POLX - a technical share where fortunes will be madeThis healthcare innovator holds unbelievable patents for its diagnostic lung-imaging machines. But the real excitement is in the chart.
It trades so technically it's unreal. It doggedly respects trendlines, and price collapses or explodes when they break.
Today it's pushed through what had previously been failed support (Feb-May last year) and pumped quite hard. The resistance trendlines above are becoming fewer and fewer, leaving explosive potential ahead.
Two big gaps in sight: 16.45p between the 50% and 0.618 Fibs of the current range and 29.9p, the low point of the big volatility spike from October 2021. With price at 1.37p right now, you're looking at breathtaking returns if either of those are tagged - and the odds of that happening have just much improved.
GLA, DYOR.
