The 1. Chapter of Darktrace - 2 Long scenariosTwo scenarios where i plan to go long:
Fundamentals:
Darktrace provides mostly solutions for cyber security and could profit from the current atmosphere (Ukraine etc.)
Scenario 1 (Blue arrow)
Target: Next resistance level (upper red rectangle)
Requirments:
- retake of first resistance level (lower red rectangle)
- generating higher highs on the 1 hour chart after retake
Invalidation:
- Fall under first resistance level (lower red rectangle) after retake AND generating lower low swings on the 1 hour chart
Scenario 2 (Orange arrow)
Target: Next resistance level (line level 1)
Requirments:
- Retest of former s/r level (line level 2)
Invalidation:
Added to long term hold stocks if it should fall deeper
Good luck


Boohoo longPossible double bottom formed.
Wait for confirmation before going in.
What are your thoughts?

ALL triangle forming in upward channelALL looks like +20% is possible near term
no advice given
Triangle formed in upward channel

AXL - very strongAXL very strong in upward channels
No advice given
I have not researched this share
looks good to me

Buy ideaAs you see on the chart we have a buy idea because we can see the spring effect on the vwap indicator and the support line.Big probability of an uptrend.Thanks.

GWA, Time to Evaluate Ones PositionHi guys,
In this analysis I go through the GWA monthly chart.
With price having risen 70%+ since September '22 is it now able to brake the wall its now currently facing or is it wanting to find its way back to the 200ma.
The question now is price going to drop fast or muscle its way back into the higher range and flip the current resistance as support.
My gut tells me we are about to see price decline from this point on till the 200ma is hit or price drops to the lower red brake out zone.
I believe it is a good idea to evaluate ones position at this time.
This analysis is all price action and nothing to do with the fundamentals of the company.
As always Invest smart and with a plan in place.
"capital loss is more hard felt that capital gained"
Stay safe,
Crypto Leonard
P.S. This is NOT finantual advice, if you seek finantual aid seek the help of a licenced professional.

What to Expect for EZJ Ahead of Q4 Earnings?On the hourly chart, EasyJet (EZJ) made a bullish breakout after forming a cup with handle pattern. Buyers may continue to push the EZJ share price forward to 415.3 - 422.6 levels, with 428 - 429.9 levels (August highs) as additional bullish targets.
Breaking down and closing below 399 pence may invalidate the prior hypothesis, causing the EZJ share price to fall further to 392.1 pence, with 381.9 and 371.6 as potential targets for sellers.
EasyJet is expected to earn 0.31 pence per share in the fourth quarter, up from -0.60p in the same period last year. Also, EasyJet's Q4 revenue is predicted to be £2.5 billion, up from £1.22 billion during the previous quarter.

DGE Bullish indicator
1- Falling Wedge formed need to check if it
breakout the trend line then trend will be bullish.
Bearish Indicator.
1- if it breaks the 3426 support it will be in bearish trend

BT Group Plc *safe investment opportunity - low risk*
On the above monthly chart price action prints a higher low following a 80% correction since early 2016. Shortly after a 2:1 stock split. A ‘great buy’ opportunity now exists.
Why Bullish?
1) Regular bullish divergence between price action and the money flow index (MFI) - oscillator on bottom of chart.
2) Trend reversal. A higher low was printed from the crash in price action back in 2009.
3) The 3-month chart below provides a clearer picture of the overall trend between price action support and resistance. Clearly an amazing opportunity.
A buy from 130p is amazing if you can get it. Expecting price action resistance between 160-180.
Target? Around 800. This will take time 5 - 6 years but it beats cash resting in the bank account with no interest like the past 10 years!
3-month chart:

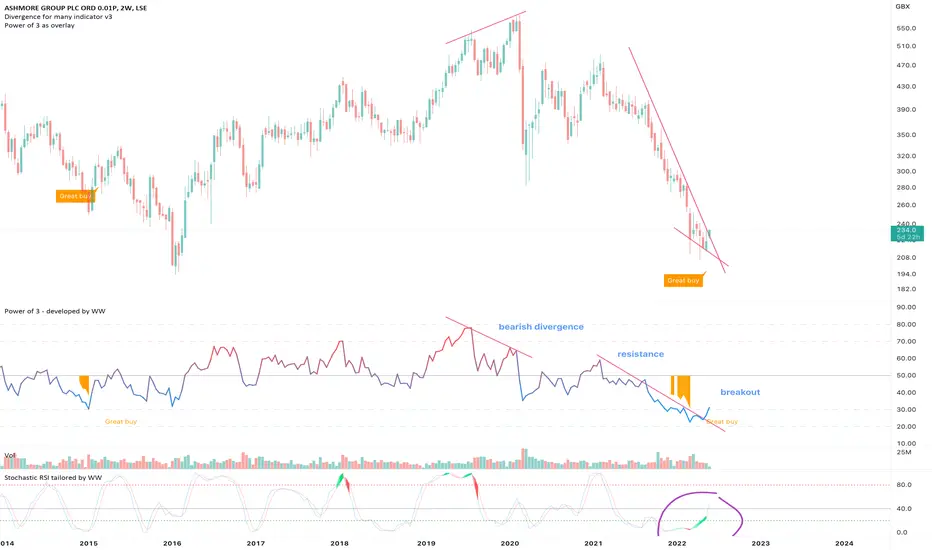
Ashmore Group PlcOn the above 2-week chart price action has corrected 60% since the bearish divergence back in February 2020. Now is an excellent time to be long, why?
1) A buy signal has printed.
2) Regular bullish divergence. 11 oscillators are currently printing bullish divergence with price action.
3) RSI and price action resistance breakout.
4) The 2-day stochastic RSI is crossing up 20 (purple circle) - do not ignore such beautiful signals.
5) Although the monthly candle is yet to close bar a few days, the monthly chart below is worth some attention. Price action is on significant support. Look left. It stands to good reason should price action close at 230-240 in the days towards the end of the month the candle will close green.
6) The last time monthly support was confirmed on this support / resistance level price action appreciated 90% and 150%, respectively. I think it is reasonable to assume a test of the upper channel resistance shall be repeated should this support be confirmed at the end of the month.
Is it possible price action falls further? For sure.
is it probable? No.
Ww
Type: Investment
Risk: <=6% of portfolio
Duration: N/A
Return: 2x
Monthly chart
YCA says the weekly trend is up $YCA since 2020
We now have Higher lows, lower highs, the squeeze is ON.

FERGUSON ,,, RISING It is a good example of a trend and a correction, ending exactly above 50-61.8 fib zone. It is inside an uptrend and the last weekly candle shows next target will be available so soon. Dont forget setting sl for it.


Rio Tinto ,,, Buy opportunity Uptrend
It's a good breakout and starting for a new trend, I suppose nest target will be at about 6800 and as always put SL at a sure place for new buying position.

GLENCORE PLC ORD GLEN/USD HIGH PRECISION TRADINGLONG GLEN/USD 1 day Shopping ✅
Entry Point: USD 510.0
Target : USD 640.0
Stall Brake : USD 498.0
Speculation is extremely risky and must be executed with money that we are willing to lose or touch the stop loss.
Leave a comment that is helpful or encouraging. Together we can dominate the markets.
Trading is the only trade in which the only one responsible for our actions is oneself, our worst enemy is oneself, here there is no one to blame, this is not a collective work, the only one who presses the sell button buy and knows how much to invest and where to stop losses is you, and only you, so always remember that.
Important note: THE LEVEL OF LEVERAGE, the alert for taking early profits, the adjustment of the stop loss and the closing of forced operations are not made by this means.
And also always remember to have control over your losses, focus on this and you will lose.
Comment: WARNING!!!!
I AM NOT A FUTURIST, I DO NOT MAKE PREDICTIONS.
I AM A 100% MARKET OPERATOR, I WORK BASED ON MY EXPERIENCE, CONSISTENCY AND MY TRADING PLANNING.

ASHTEAD ,,, Pullback Uptrend
It is a typical pullback to a broken level and followed by a good bullish candle on weakly time. It's triggered for buying by setting SL at about 4600 and next targets are 5550 and 6500.

Anglo American ,,, Buy opportunity Uptrend
I suppose, this is a good breakout on daily time and by setting SL at about 3030, targets around 4030 and 4230 will be available. Whole market is not in a good mood , so try to enter with a small amount of your portfolio.

Time to sell out of GAW?Hi guys/gals,
I'll be walking you through my GAW analysis, I have worked from the monthly chart down to what you see here.
Tools I use:
Time based fib extension Fib retracement Colour coded rectangles Faces to show what I believe to be fear, neutral & greed sentiments Question marks Exclamation marks EMA/MA's
With Games Workshop having fallen under the 200 ssma I see it falling much lower. The price has fallen 50% from the high set in June of '2021 and has managed to rise 50% from the '2022 September lows.
As price is still holding under the 200 ssma the long term momentum is in a down trend indicating to me we could be seeing a possible reversal in price making newer lows than the one set in September.
Is this a good selling opportunity for those bag holders only time will tell.
My target for GAW is £20.00
GAW has been in a bull market since May of '2017 and is now what I believe to be in a short/mid term retracement to the upside before continuing to the downside targeting the red zone. If hit I see a possible bounce before hitting around £20.00, if momentum keeps up on the decline it could hit the orange zone before bottoming out.
Keeping in mind this is just my personal opinion and it may not play out like that at all.
Be smart, Invest small amounts, Capital preservation is key.
This is NOT financial advice DYOR!
Crypto Leonard.

Unilever long above 40Unilever im long as long as its stays over 40.
its just filled the gap between 42-43. I expect either a push to the next level of resistance while the rsi is still bullish at around 43.60 or it sells off now and bounces at support.
classic inverse head and shoulders played out.
im long Unilever with they're pricing power over inflation and with they're restructure.
IT COULD DROP DURING A BLACK SWAN WHOLE MARKET DROP

MONY upper resistance dominantMONY upper resistance dominant, monitor and see what happens
No advice given


CER at top edge of upward channel - I think I missed this oneCER - can it continue or consolidate?
Upward channel but possible resistance
Long term trend very strong
No advice given
