BME short following break of H&SBME looks like a short as it is pulling back after a strong run and breaking down through a head and shoulders pattern.

ASHTEAD TECHNOLOGY HOLDINGS PLC GARTLEY PATTERNPoint x is a wave which breaking upper band of the channel
fundamentals very promising


ALTYNGOLD PLC SUPPORTJust keeping stuff simple , upper band of triangle and 38.2 % fibonnacci
might be a good support
fundamentals getting better as well

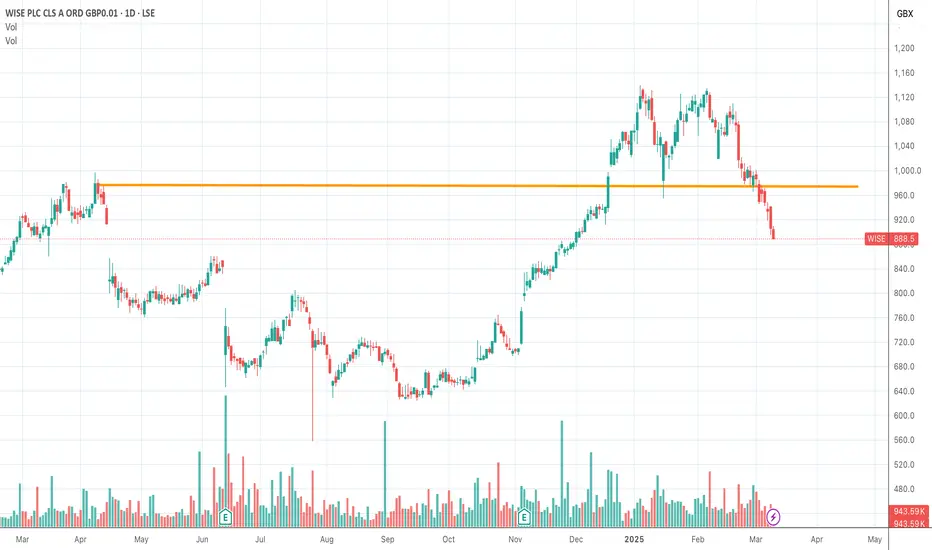
WISE PLC - SUPPORT LEVEL - SELLING OPPORTUNITYWise had experienced a surge in share price as the company had collaboration with Standard Chartered banks and Morgan Stanley on using Wise's infrastructure for foreign currency remittance.
The share price had been met with selling pressure when the US stock faced faces a dip.
Right now the price broke through the support level at 973.
The selling pressure in the US market had not subside.
The momentum will continue.
Estimated target price at 717.
Senior (SNR) LongSNR is coming off a range support.
Price has been ranging since 2021 and has formed a horizontal channel between 115 and 185.
I expect price to make a move to the range resistance area and possibly break higher.
From a fundamental point of view:
✔ Revenue has increased year-on-year
✔ Gross and net profit margins are steady
✔ The company has sufficient cash and assets to meet its liabilities
My only concern is margins are tight. If margins fall any lower, I will immediately close my positions.

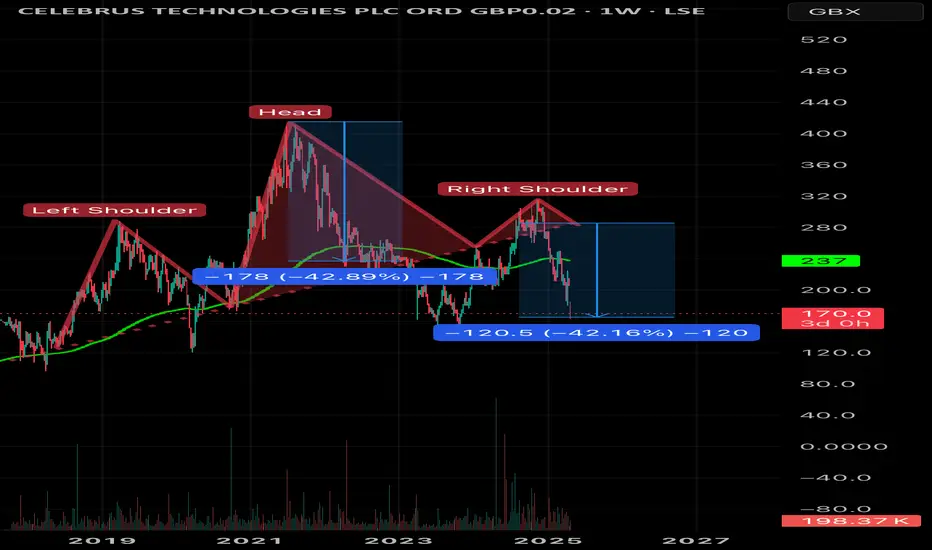
Head and Shoulders breakdown Another stock that broke the neckline, I shorted at the confirmation of the breakdown and I have already hit my anticipated target. This is very similar to many of the stocks I have shorted, or stocks I have waited on before building a long position.
Not financial advice. I will occasionally bring you trades before I take them but in other instances I will share after the results. Nothing in life is free, the only cost to you here is time. Follow my channel and you will get learn my trading style, if you follow and observe.
Nat West breakoutClear breakout from 327, which was established resistance since 2016. Inverse Head and Shoulders pattern completed.
Volumes have been ramping up since Feb this year and the shares are not oversold on the weekly RSI yet.
Market likes their results today too.
In my opinion, heading for 400p.
Do your own research and this is NOT a solicitation to hold, buy or sell.

Break out in the silvermarketBreak out in the silver market.
Fresnillo is a tier 1 player. It breaks through the earlier highs and we are aming at the 2017 and 2020 highs

ARB - My first ever stock purchase Double bottom clean
I purchased £50 worth when it first became publicly available. Then sold it at 50p.
Too early on both sides too inexperienced.
This time I am READY
not financial advice

IAG Additional Price Levels • LSE • Airlines Group Stock • FTSE⚠️ IAG Going to plan, looks like it's a TRUMP DUMP 🤣
Now is the TIME TO HUNT the stocks for your PORTFOLIO.
ℹ️ When TRUMP causes a DUMP I accumulate SIT BACK and just WAIT fornthe PUMP...🚀
These additional price levels will be used as an additional filter to TIME an ENTRY ONLY IF the BIDS come in 🟢SeekingPips🟢 NEEDS to see some VOLUME🚀🚀🚀

IAG Airlines Group what next? $261 Reached & Breached! $172?🤔 IAG Airlines Group what next?
ℹ️ $261 Reached & Breached!
Will the $261 be regained and start to offer some support or is $172 NEXT?❓️❔️❓️
🌍 To be completely transparent I have no horse in this race at the moment BUT I really would like a serious flush to try and accumulate a long-term POSITION.
🟢SeekingPips🟢 is not interested at current price at all unless we start to see some SERIOUS VOLUME START TO COME IN TO PLAY

Long opportunity on TUNE (focusrite)Very good R/R play here. Technicals/Fundementals.
Sellers exhausted, bullish divergence on indicators, won't take much to squeeze this one upwards.
April update coming, which I believe will be the catalyst...metrics pointing to increased sales.

IAG Stock Took some heat! Is there anything to take here?🟢SeekingPips🟢 has this on the radar.
⭐️ Have your levels ready and wait for your A+⭐️ Setup.
ℹ️ Our levels are here marked out.
I have ZERO interest in taking a position here however a deeper sell-off and I will start paying attention.❗️
⚠️ ALERTS set and LEVELS marked.
🟢Now go away and ENJOY your WEEKEND and lets HURRY UP AND WAIT and lets see what NEXT WEEK has for us👍

Empire Metals outlookcup and handle base
Upwards? If not, double bottom will be incoming
Not financial advice

Change in Channel direction in #FTCI had thought that #FTC price might be coming up to bounce off the red channel support and could then perform a 'trader's remorse'. I now see that perhaps there could be a change in channel direction, from red to blue. This type of action can be seen quite often.

A possible change in channel direction?I had thought that #FTC might be coming up to the red channel support and could then perform a 'trader's remorse'. Today after a little time has past I see that perhaps there's been a channel direction change. This can be seen quite often if you look at a lot of charts.

Will have a big drop1. Due to inflation and the operating cost in the UK, profit will drop for a while
2. Technically towards a big drop
3. Div. Not attractiv

VERY Bearish Outlook on Aviva plc (PINE.L):The recent disclosure by Citigroup Global Markets highlights heightened volatility and speculative market actions, suggesting underlying uncertainty in Aviva plc's future prospects. With the company currently embroiled in takeover or merger discussions, short-term traders are actively taking positions both through traditional equities and cash-settled derivatives, such as Total Return Swaps (TRS).
The substantial activity in derivative positions, notably the heavy closing and reduction of short positions, suggests market players perceive limited further downside, yet the significant selling of physical shares—902,108 shares in a single day—could indicate institutional caution regarding Aviva's future performance or concerns about the acquisition terms being unfavorable for shareholders.
Despite Aviva’s attempts at strategic transformation—particularly focusing on technology and streamlined business models—the uncertainties related to potential integration issues, regulatory scrutiny, and post-merger operational complexities remain significant risks. Given the current market dynamics and the speculative nature surrounding the ongoing deal, short-term volatility may escalate, posing considerable risks for current shareholders.
Additionally, the rebranding and strategic pivot of Aviva from traditional insurance towards technology-driven services, while conceptually appealing, remain unproven in delivering consistent growth and shareholder value. Any delays, operational missteps, or competitive pressures from established technology companies in the automotive SaaS space could negatively impact profitability and investor sentiment, potentially eroding share value further.
Considering geopolitical tensions, macroeconomic uncertainty, and potential disruption in technology and financial markets, Aviva’s ambitious transition towards a focused tech entity remains precarious and subject to external vulnerabilities

River Might Be Handing Out Easy Money! After breaking a diagonal formation, River is attempting a rally with volume. While the initial reactions may not be convincing, scaling into positions could be a good approach.💰🚀
If the diagonal breaks downward, it would provide an even better buying opportunity. In that case, buying around 25 and holding for a long-term target of 60 could be a strong strategy. 📈🔥

IAG maintains its interest in acquiring TAP Air PortugalBy Ion Jauregui –ActivTrades Analyst
International Airlines Group (IAG), which includes airlines such as British Airways, Iberia and Vueling, has reiterated its interest in acquiring a majority stake in TAP Air Portugal. The move follows the abandonment of plans to acquire Air Europa due to regulatory obstacles, underlining the strategic importance of TAP to IAG's expansion in the transatlantic market.
IAG's strategy
Lessons from the Aer Lingus acquisition: In 2015, IAG acquired Aer Lingus after committing to maintain the brand, route network and local jobs in Ireland. This strategy was key to gaining approval from the Irish government and the European Commission. IAG is likely to adopt a similar approach in the case of TAP, ensuring the preservation of the Portuguese airline's identity and operations to gain favor with the Portuguese authorities.
Regulatory and strategic considerations- Antitrust: IAG's acquisition of TAP could face scrutiny from European Union competition authorities, similar to the challenges that led to the abandonment of the Air Europa acquisition. However, the strong financial position of IAG, which recently announced the return of €1.4 billion to its shareholders after doubling its profits, could strengthen its position in the negotiations.
Technical Aspect
Currently IAG has bounced twice in the last price consistency zone where the last bounces occurred. At the moment on the weekly and daily charts the price has lost strength and the RSI is at its mid-zone at 51.82%. This current formation seems to be an impulse wave that if it accompanies with the company's movements, will make the firm's share price advance in the direction of the last 2017-2020 highs area.If the bullish formation is confirmed the first milestone to reach would be €358-368/share. If this is confirmed the stock may try to seek €426.8/share. If the formation is not confirmed it is likely that the stock will correct in the direction of the previous range of 178.42-135.23 euros/share.
Conclusion
The potential acquisition of TAP by IAG represents a strategic opportunity to consolidate its presence in the transatlantic market and strengthen its route network in South America and Africa. Competition from other European groups and regulatory considerations will be determining factors in the success of this transaction.
*******************************************************************************************
The information provided does not constitute investment research. The material has not been prepared in accordance with the legal requirements designed to promote the independence of investment research and such should be considered a marketing communication.
All information has been prepared by ActivTrades ("AT"). The information does not contain a record of AT's prices, or an offer of or solicitation for a transaction in any financial instrument. No representation or warranty is given as to the accuracy or completeness of this information.
Any material provided does not have regard to the specific investment objective and financial situation of any person who may receive it. Past performance is not reliable indicator of future performance. AT provides an execution-only service. Consequently, any person acing on the information provided does so at their own risk.

EUZ Europa Metals Just for fun, curious if it will play out.
Most probably needs to base under red resistance more before going back to ATH
1 Mil cap to 1 Bil cap
Not financial advice

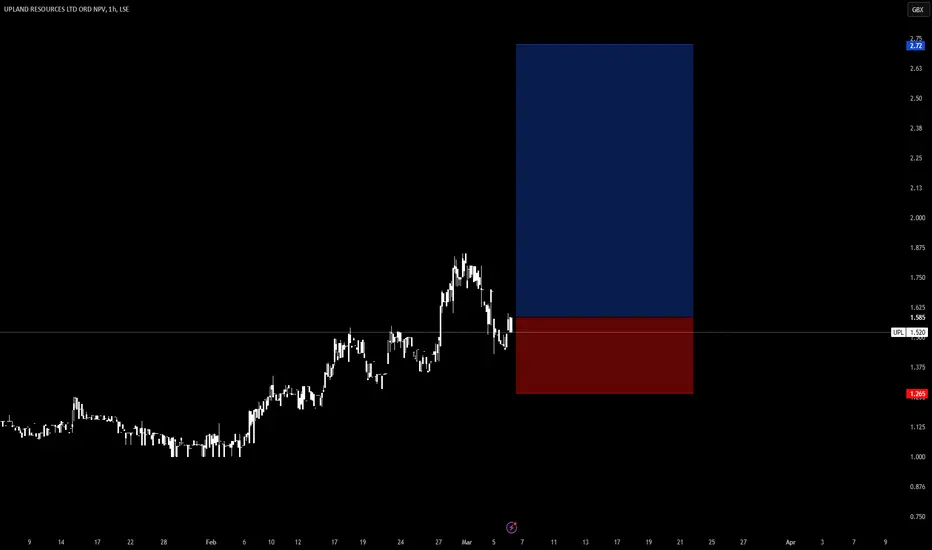
Long Upland Resources for a potential 75% + increase n my considered estimation, we stand on the precipice of a potentially transformative announcement from Upland Resources, with the temporal horizon suggesting mere days until the dissemination of favorable tidings. Should the company unveil substantive developments pertaining to its prospective ventures within the geopolitically significant domains of Brunei and/or Sarawak, the financial implications could be profound. Such disclosures, particularly if they illuminate advancements in exploration or production initiatives, might catalyze a robust revaluation of the company’s equity valuation—a phenomenon colloquially termed a “re-rate” in market parlance.
The intricate interplay of regional energy dynamics and Upland’s strategic positioning in Southeast Asia amplifies the potential for such news to serve as a fulcrum for share price appreciation. Investors, attuned to the nuances of upstream oil and gas prospects, may perceive any concrete progress—be it in the form of production-sharing contracts, joint ventures, or technical milestones—as a signal to recalibrate their risk-reward calculus. This, in turn, could precipitate a surge in market sentiment, driving a virtuous cycle of capital inflows and upward price momentum, thereby rewarding those with the prescience to anticipate this inflection point in Upland Resources’ corporate narrative.