GLENCORE SHARE will be dumped Glancore shares are going to be dumped by investors. Technical indicators of a brutal massive sell-off of Glencore share price. Glencore activities are criminal


ULVR shortA down trending value area
Sellers resistance at top value area edge
Daily stochastic at high extreme
5/20ma cross trigger
stop loss previous high
target value area control line or possible lower edge value area
exit at re cross of 5/20ma

GSKI do not provide personal investment advice and I am not a qualified licensed investment advisor.


Barryroe Offshore Energy Long for strong upside.Barryroe Offshore Energy Long for strong upside.
We could see a strong continuation of the impulse after consolidation here.

GBP expectations GBP CPI can push the chart to the upside… its Bulls time #Redbull gives me wings#to the moon

Follower Request: Vodafone Sell Off Incoming? £82 TargetContinuing with our Daily Analysis requested from followers... today we have Vodafone where after mapping out the key levels we can see potential for a sell off to 82.00 region.

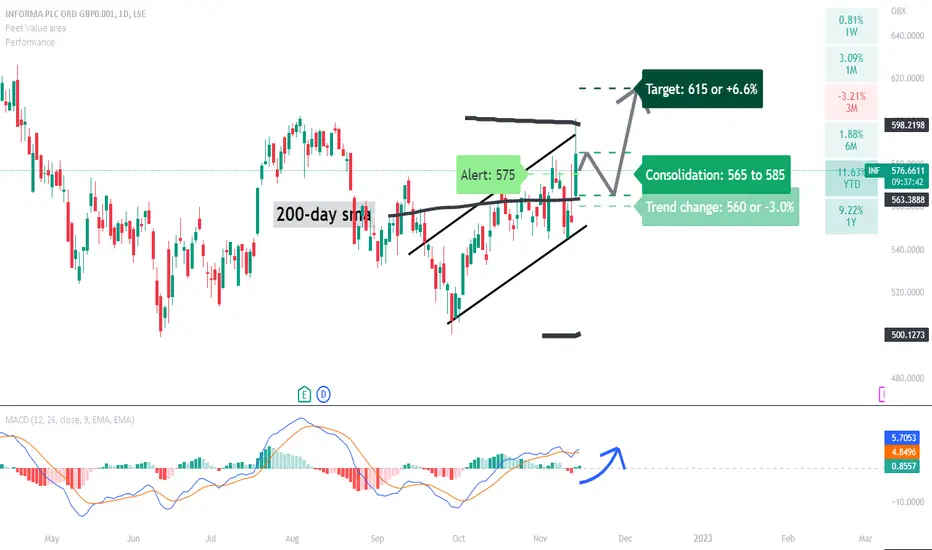
INF: further upside potential?A price action above 560 supports a bullish trend direction. Crossing below this level will negate the bullish stance.
Consolidation price range between 565 and 585.
Crossing above 585 might support the pride action to reach 615.
MACD bullish crossover supports a bullish trend direction.
PSN I do not provide personal investment advice and I am not a qualified licensed investment advisor.

VOD
I do not provide personal investment advice and I am not a qualified licensed investment advisor. I am an amateur investor

GSK: The line of support!Will GSK hold this line? The ex div date is fast approaching, looks like a BUY on price action!
My opinion only, not financial advice!

Elliot Wave analysis of Transense Technologies (TRT)Daily Candles.
LSE:TRT
A clear 1,2,3,4,5 Impulse Wave advance (Wave 1) followed by the Corrective A,B,C Zig-Zag (Wave 2) - Support was finally found at 78.6 retracement level.
Wave 3 now underway with a minimum £2 price target

EasyJet to fly?EasyJet - 30D expiry - We look to Buy a break of 311.1 (stop at 288.8)
We are trading at oversold extremes.
The trend of lower highs is located at 370.
The previous swing high is located at 375.
We look for a temporary move higher.
There was little net movement as we continue to consolidate within the 280 - 310 range.
Although the bears are in control, the stalling negative momentum indicates a turnaround is possible.
The bias is to break to the upside.
Our profit targets will be 369.6 and 379.6
Resistance: 310 / 350 / 380
Support: 280 / 250 / 220
Disclaimer – Saxo Bank Group.
Please be reminded – you alone are responsible for your trading – both gains and losses. There is a very high degree of risk involved in trading. The technical analysis , like any and all indicators, strategies, columns, articles and other features accessible on/though this site (including those from Signal Centre) are for informational purposes only and should not be construed as investment advice by you. Such technical analysis are believed to be obtained from sources believed to be reliable, but not warrant their respective completeness or accuracy, or warrant any results from the use of the information. Your use of the technical analysis , as would also your use of any and all mentioned indicators, strategies, columns, articles and all other features, is entirely at your own risk and it is your sole responsibility to evaluate the accuracy, completeness and usefulness (including suitability) of the information. You should assess the risk of any trade with your financial adviser and make your own independent decision(s) regarding any tradable products which may be the subject matter of the technical analysis or any of the said indicators, strategies, columns, articles and all other features.
Please also be reminded that if despite the above, any of the said technical analysis (or any of the said indicators, strategies, columns, articles and other features accessible on/through this site) is found to be advisory or a recommendation; and not merely informational in nature, the same is in any event provided with the intention of being for general circulation and availability only. As such it is not intended to and does not form part of any offer or recommendation directed at you specifically, or have any regard to the investment objectives, financial situation or needs of yourself or any other specific person. Before committing to a trade or investment therefore, please seek advice from a financial or other professional adviser regarding the suitability of the product for you and (where available) read the relevant product offer/description documents, including the risk disclosures. If you do not wish to seek such financial advice, please still exercise your mind and consider carefully whether the product is suitable for you because you alone remain responsible for your trading – both gains and losses.

Value area trading shortfind the big value area on the 4hr or daily chart.
find the small value areas within the big value area on the 1hr or 15min chart.
when price moves to the outer edges of the big value area
wait for a break of the small value area there.
look for a rejection of that area for the entry.
stop loss the small value control ling.
target the big value control line.

Elliot Wave Analysis of AAZ - Weekly Candles. £3.50 target priceHave used the Weekly Candles here due to the timeframe involved.
A clear 1,2,3,4,5 Impulse advance (that meets all the EW Rules) for Wave I
Corrective Wave II consists of an a,b,c Zig-Zag decline, that was halted at (4) of the previous wave (also meets all the EW Rules)
Wave III should now develop and, assuming 1.618*Wave I, that gives a target price of circa £3.50

Shifting value areasA picture tells a thousand words.
Let's learn to read the picture.
Price is seeking value and creates a pattern.
Small value areas form within a bigger value area.
Trading opportunities arise at the outer edges of the bigger value areas
target at the control line.
The trend will change if the price starts making HH, HL, LL, LH.
It will then start to form a new bigger value area and control line.
The sooner we can see this new value area the sooner we can trade
along with the money that moves the market price.

BP PRICE FORECASTBP Plc operates as an integrated oil and gas company. It operates through the following segments: Upstream, Downstream and Rosneft. The Upstream segment engages in the oil and natural gas exploration, field development and production, midstream transportation, storage and processing, and marketing and trade of natural gas, including liquefied natural gas and power, and natural gas liquids. The Downstream segment refines, manufactures, markets, transports, supplies, and trades crude oil, petroleum, petrochemicals products and related services to wholesale and retail customers. The Rosneft segment engages in investment activities. The company was founded by William Knox D'Arcy on April 14, 1909 and is headquartered in London, the United Kingdom.
WAITING FOR DISCOUNT .....
SENNA SEASON

Long and short trades in a value areaPossible long and short trades that can be taken when trading from a value area.
the 1hr 20ma or 100ma cross over can be used as a trigger.
stop loss previous swing high or low.
target at the control line

Value area tradingTrades can be taken from the top edge to the control line - short
and from the bottom edge to the control line - long
entry triggers can be higher highs, HL, LH, LH - double tops/ bottoms - head and shoulders - wicks, or small value areas.

Short trade A small value area within the top half of a big value area.
A short trade back to the control line

Wave pattern A wave pattern in the value area.
ride the wave with the big buyers and sellers.
where do you think this is going next?

