Value area tradingup trending value area
long trade entry at the bottom edge of value area
target control line

Boohoo BuyI mainly invest in ETF stocks and crypto for long term.
Christmas is coming, this looks like a good buy for the medium and long term.
I don't think it will hit go further than the long term support line, it could the trend line a bit, the uptrend looks good.
What are your thoughts?

Long Diageo Diageo has said it is starting the final phase of its share buyback, where it will hoover up to £640mln worth of its stock, last month the FTSE 100-listed alcoholic drinks group said it intends to raise its stake in East African Breweries to 65% from 50.03% but did not intend to make a takeover offer.
- Trading at 11.6 below fair value
- Earnings are forecast to grow 10.43%
- Pays a reliable dividend of 2.12%

Value area trend changea smaller value area turning into an up trend value area all within a bigger value area

Shifting value areaValue shifting from a big downtrend where sellers are in control
to a smaller up trend where buyers are in control

Value AreasThis is the footprint of the bigger money that move the market. Price is always seeking value between buyers and sellers.
The central control line in the value area is where the most trading takes place, it's like a magnet to price.
Price moves from one value area to another.
Trade the edge of the value area back to the control line.


SVT: inverse head-and-shoulders patternA price actioin above 2300 supports a bullish trend direction.
Crossing below this level will negate the bullish trend.
Further trend support above 2400.
Crossing above 2500 might target 2600.
Remains a risky trade.

FLTR: some cup-and-handle pattern?A price action above 10600 supports a bullish trend direction.
Crossing below this level will negate the bullish bias.
Further trend support above 10900.
Crossing above 11200 might target 11700.
Crossing below 10800 might be the first sign of pending weakness.

Foxtons shares are going to be delistedThe UK housing market can be regarded as one of the largest real estate speculative fraudulent bubbles in the global economy, such as hong kong real estate, china estate market, Paris, new york, Florida, and California real estate markets. Hounding and Commercial real estate developers and real estate brokers are going to go bust, because they have leveraged their balance sheet of very cheap debt collateralized by inflated real estate prices. The housing market and commercial real estate market already are in multibillion dollars debt collateralized by negative equity and real estate brokers are going to collapse with the whole housing market.
Observing The chart of Foxtons the trendline of the share price, to investors these dynamics have been clear for some time.

Unilever PLC - ULVR - LONGSince price seems to be moving up since Mar 22, could this be potential move to the upside to 4170?

Lithium FocusLithium Focus: Main companies in the sector. Strong Lithium prices are giving current producers massive cashflows & strong incentives to all to introduce extra production asap

SHEL LSE daily shortOpened short after local high in expectation of wave C correction or wave 3 downtrend. Will see soon!

PHE Breakout and RSI Positive DivergenceRecent breakout of PHE - 50% on Friday after announcement meeting can be found on IG trading or other platforms. I play about wih this looking for some channels but then realised the RSI positive divergece building - aims itself firmly at the next earnings report- how will it play out? are we looking at retesting the highs?

JET2 PLC LSE STOCK MARKET , at support, Long ?LSE:JET2
Jet2 like the rest of the aviation market had a terrible time performance wise due to covid and lock downs, price now at a long term support, i expect it to be respected and bounce from here, perfect place for a buy, fundamentals for Jet are great as well as the technicals which i have indicated in my TA.

shot firedBeen waiting a while for this ...moving more cash into this for i believe its accumulation zone....trouble is on the books here so its a small feeler,will add more charts etc.. another day when not so busy

Fresnillo: ReasonableFresnillo is back to being reasonable and – in accordance with our expectations – has moved downwards again. Now, it should keep up this drive to make it below the support at GBP 456.60 and thus into the turquoise zone between GBP 473.60 and GBP 250.00, where it should finish wave (2) in yellow. There is a 35% chance, though, that Fresnillo could escape above the resistance at GBP 997.60, thus triggering further ascent above the next mark at GBP 1379.

Bull trap could be in for LSE.Reference to the previous post linked below.
The last rally took us right up to the area marked "Return to Normal" and then we had a strong rejection of it.
Next we'd be looking for fear (usually followed by fast rally)- and then down she goes.

hargreaves landowns stock, long term down trendLSE:HL.
1d candle chart, 4 year downtrend, short for me, maybe 2026 this thing will turn around,
support and resistance marked, for sensible entry and exits.

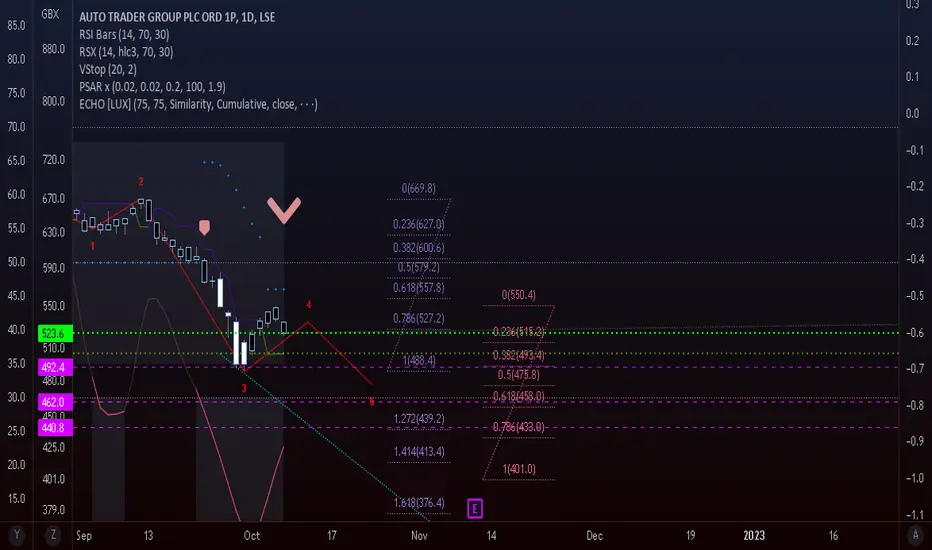
Trade it in, Auto Trader. AUTOAuto Trader is heading for a final leg in a downward impulse. Clear picture on the Elliott, backed up by indicators on the daily. Good luck!
We are not in the business of getting every prediction right, no one ever does and that is not the aim of the game. The Fibonacci targets are highlighted in purple with invalidation in red. Confirmation level, where relevant, is a pink dotted, finite line. Fibonacci goals, it is prudent to suggest, are nothing more than mere fractally evident and therefore statistically likely levels that the market will go to. Having said that, the market will always do what it wants and always has a mind of its own. Therefore, none of this is financial advice, so do your own research and rely only on your own analysis. Trading is a true one man sport. Good luck out there and stay safe.
BP Plc looking good to pump Cup and Handle on BP Plc
Breakout confirmed.
Target £563.00
Also the RSI has broken out of the down momentum and picking up.
Only concern is the left part of the cup is not touching the brim entirely.
Still going long.

BAE Systems long W FormationExcellent trade idea to buy BAE Systems on FTSE 100.
Target 1 £911.00.
RSI broken above resistance
Moving Averages are all positive.
Good to go
