Train about to leave - Last CallSomething tells me this is your last chance to get on the AVACTA train.
Fundamentals
- We are awaiting the results of phase 1 trials, and all things are pointing for it to be very positive.
- A great pipeline of drug development
- Possible Take-over bids incoming
- With a little research, the list goes on and on to be honest for Avacta.
Charts
- Higher time frame, we have formed this bull flag from the previous impulse move.
- Price action has consolidated and we now have decent accumulation/consolidation under the upper resistance of the flag pattern.
- On to this, price action and lagging span is about to be trading above the ichimoku cloud on pretty much all important time frames. 15 minute through to 1 day. When you get this confluence across time frames it can be very exciting.
Price predictions for me are.
- 140p within 2 weeks
- 200p+ end of September.

Fresnillo: Attention SeekerBulls and bears are currently both angling for Fresnillo’s attention. We still expect the bears to win, though. They should grab Fresnillo and take it below the support at GBP 456.60, pulling it into the turquoise zone between GBP 473.60 and GBP 250 to finish wave v in magenta as well as wave Z in turquoise and wave (2) in yellow. However, there is indeed a 32% chance that the bulls could be victorious instead and push Fresnillo above the resistance at GBP 997.60, thus eliciting further ascent above GBP 1379.

XLM UAH as an indicator of XLM growthHryvnia as an indicator of XLM growth is also a graph that shows when there will be an introduction of digital hryvnia based on xlm defined agreement between the Ukrainian authorities and Stellar developers already exists. With a high probability before solving the hryvnia problem, they will create a serious fall in UAH to which zone the analysis will be in the next idea and the solution will be in the form of creating a digital hryvnia in the application

easySell? No signs of the downtrend coming to an end.EasyJet - Intraday - We look to Sell at 401.2 (stop at 434)
The medium term bias remains bearish. Broken out of the channel formation to the downside. An overnight negative theme in Equities has led to a lower open this morning. Preferred trade is to sell into rallies. Expect trading to remain mixed and volatile.
Our profit targets will be 275 and 250
Resistance: 401 / 429.9 / 448.6
Support: 368.4 / 338 / 300
Disclaimer – Saxo Bank Group. Please be reminded – you alone are responsible for your trading – both gains and losses. There is a very high degree of risk involved in trading. The technical analysis, like any and all indicators, strategies, columns, articles and other features accessible on/though this site (including those from Signal Centre) are for informational purposes only and should not be construed as investment advice by you. Such technical analysis are believed to be obtained from sources believed to be reliable, but not warrant their respective completeness or accuracy, or warrant any results from the use of the information. Your use of the technical analysis, as would also your use of any and all mentioned indicators, strategies, columns, articles and all other features, is entirely at your own risk and it is your sole responsibility to evaluate the accuracy, completeness and usefulness (including suitability) of the information. You should assess the risk of any trade with your financial adviser and make your own independent decision(s) regarding any tradable products which may be the subject matter of the technical analysis or any of the said indicators, strategies, columns, articles and all other features.
Please also be reminded that if despite the above, any of the said technical analysis (or any of the said indicators, strategies, columns, articles and other features accessible on/through this site) is found to be advisory or a recommendation; and not merely informational in nature, the same is in any event provided with the intention of being for general circulation and availability only. As such it is not intended to and does not form part of any offer or recommendation directed at you specifically, or have any regard to the investment objectives, financial situation or needs of yourself or any other specific person. Before committing to a trade or investment therefore, please seek advice from a financial or other professional adviser regarding the suitability of the product for you and (where available) read the relevant product offer/description documents, including the risk disclosures. If you do not wish to seek such financial advice, please still exercise your mind and consider carefully whether the product is suitable for you because you alone remain responsible for your trading – both gains and losses.

Jet2 part of the dart group family, neutral/long jet2 is in my list of safe stocks, i like this stock for the long term, good fundamentals and technicals. support of around £7.65 since 2018. Im long on this for the long term, phil messon ceo is a forward thinking and customer focused. one for the retirement portfolio, short term expected to hit support again before hitting ath again next year,

GGP Deep DiveHere's a macro macro (1 week chart) deep dive on GGP:
- No fundamentals here, just looking at the chart zoomed way out.
- Price bounced from the 0.786 fibonacci retracement (1 week chart). A good place for an entry, but only in hindsight now.
- Looking for this level to hold ~ 9.44, and on the lower time frames it looks as though price action is trying to form a swing higher low ~10.00.
- One might want to take an entry here in the hope that this higher low plays out and we get a reversal. But we need to go to lower time frames though as to whether or not here would be good for an entry.
- There is an overhead diagonal resistance also, blue line, which is something to keep an eye on.
- Also there is clear resistance, dead centre on the RSI, which makes sense as that price action has been bearish and therefore RSI oscillating below ~50. It would be interesting to see that resistance broken down and for price action to break above the 50 line.
1 hour and 4 hour:
- The price action and ichimoku cloud indicator shows that price action is bearish. On the 1 hour there is even a bear flag forming.
If i was in a position here:
- I would feel that I might have weathered most of the down move, and a relief rally to the upside was on the cards.
If i was taking a position here, 2 options:
(1) take an entry here, and hope the higher low plays out. A stop-loss would sit below, 9.44 (and as such, your price target should reflect this in its risk/reward ratio.
(2) wait for confirmation of an entry on the lower time frames. This might look like a bullish divergence on the 4 hour, or price action unfolding long enough sideways, that you get price action and the lagging span (ichimoku) both above the cloud on the 1 hour (and for a better quality trade) the 4 hour.
Price targets
- On a quick glance, the most immediate price target for me would be 12.82, then 15.32 after that.

#HSBA – Breakout from Bullish symmetrical tri/ascending wedge#HSBA – Bullish symmetrical triangle/ascending wedge, breakout has begun, will it hold?
The stock goes ex-div tomorrow (18th Aug), if the P holds strong by close tomorrow... expect this to continue upwards in this inflationary env

$LUCE - Beaten down reversal play with +50% to +100% upsideTechnical Analysis (TA)
On the weekly chart the momentum indicators are oversold. There are early signs over of a potential reversal.
On the daily chart the price is flat and there is a small wedge formed. We need price break above 115 and then we could potentially see LUCE reach 145 and 170.
Price Target
Entry: 115
Target 1: 145 (+26%)
Target 2: 170 (+48%)

Glencore Short Weekly ChartGlencore put in a double top back in March and April and since price has fallen 28%. Looking at Fib levels on the weekly chart price has now retraced 50% and has put in a hanging man candlestick on the weekly chart. The RSI is also dropping along with volume - making a short set up lucrative for the coming days/week.
Couple this with the fact that the UK 100 has had a great run recently coming off the lows with a consistent move higher. We are now however approaching all time high resistance where the market has U-Turned five times already this year. Indicating that we are in for a U-Turn back to the 200-period average. This impending reversal of the overall UK market will give strength to short positions in this market in the coming weeks. Of course, we don’t know for sure that it will reverse it could break out to new all-time highs but probabilities are in our favour. I do however foresee a bullish run for another week until price has retraced 100%.

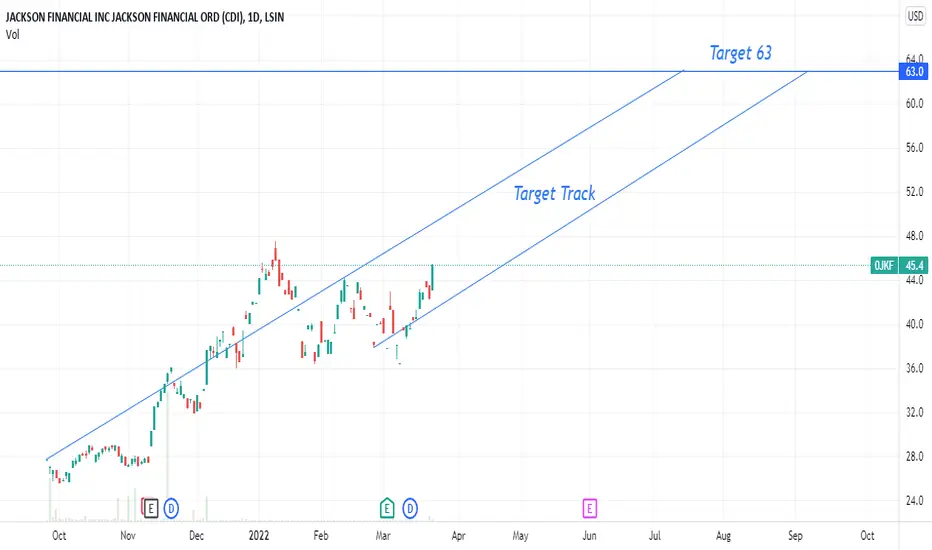
Target 63 ( 1 to 5 months )Good Breakout, Good Earnings , Fundamental and techinical is great , so Target 63 Duration 1 to 5 months..........
Target 32 ( 1 to 5 months )Good Technical and Fundamental ( Earnings ) So Target 32 Duration 1 to 5 months

$ITV - Continuation swing with +10% to +40% upsideTechnical Analysis
Price bottomed out 3 weeks ago and the RSI + William %R
Price broke out the daily channel last week and has been consolidating above the 1D 50EMA. There is a good zone to buy before a further push above 76 and potentially 90
Price Target
Entry: 71-73
Target 1: 76 (+5%)
Target 2: 88 (+20%)
Analyst Targets: 101 (+40%
Financial Metrics
High quality as shown by the financial metrics. Undervalued with high upside/growth potential.

$SENX - Reversal for upside of +12% to +40% Technical Analysis
Weekly William %R and RSI are oversold.
Daily channel being created with resistance at 50EMA>
Scenario 1 - BUY
Breach of 50EMA and uses it as support.
Scenario 2: - SELL/WAIT
Bounces off 50EMA as resistance and come back down to create a higher low.
Based on the technical environment and high William %R I expect scenario 2 to happen with high low being used to propel price upwards and for a push to $13.75 to $18.50>
Price Target
Entry: $12.30
Target 1: $13.75 (+12%)
Target 2: $18.20 (+40%)
Analyst Target: $61
Fundamental/Financial Analysis (FA)
Strong financial metrics and passes quality screen.

CPI - Reversal play with strong fundamentalsTechnical Analysis
Jan to April 2022 CPI entered a phase where it was oversold as shown by the 1M William %R entering below the -80 level. Signaling a potential mean reversion play or reversal play.
Since 25 April the stock has been moving upwards and is now on the verge of confirming a reversal play on the 1Wk chart but with William %R on the 1Wk chart being above -20 I expect the stock to consolidate between $31.44 and $24.60 prior to deciding its 1M and 1Wk direction.
A break below $24.60 the 1Wk continuation play would be triggered as it would show signs of low buying momentum/demand etc. and I expect the bottom of $20 to be tested again.
A break above $31.44 would signify high demand/ volume and potential shift in momentum.
Price Targets
If BUY triggered I expect an initial target of $44-$56 (+36% to +78%) with further upside expected if momentum shifts significantly in the markets or we see news/catalysts pushing price past $56.
If SELL triggered I expect an initial price target of $19-$21 (+14% to 22%) with further downside expected if it breaks support below.
Financials & Quality Screen
EV/EBIT: 3.86
ROIC: 25.02%
Piotroski F Score: 6
Excellent sustainable growth rate: 316

FXPO - Short continuation play Technical Analysis
Resistance above and breaking daily MA ribbon for a continuation play to 120

REVB(First time publishing from TV)
My watchlist looking promising today as usual. NAAAAT. Glad I didn't join in - because I was tempted!

Emis Group UKSun Storm Investment Trading Desk & NexGen Wealth Management Service Present's: SSITD & NexGen Portfolio of the Week Series
Focus: Worldwide
By Sun Storm Investment Research & NexGen Wealth Management Service
A Profit & Solutions Strategy & Research
Trading | Investment | Stocks | ETF | Mutual Funds | Crypto | Bonds | Options | Dividend | Futures |
USA | Canada | UK | Germany | France | Italy | Rest of Europe | Mexico | India
Disclaimer: Sun Storm Investment and NexGen are not registered financial advisors, so please do your own research before trading & investing anything. This is information is for only research purposes not for actual trading & investing decision.
#debadipb #profitsolutions

Quilter UKSun Storm Investment Trading Desk & NexGen Wealth Management Service Present's: SSITD & NexGen Portfolio of the Week Series
Focus: Worldwide
By Sun Storm Investment Research & NexGen Wealth Management Service
A Profit & Solutions Strategy & Research
Trading | Investment | Stocks | ETF | Mutual Funds | Crypto | Bonds | Options | Dividend | Futures |
USA | Canada | UK | Germany | France | Italy | Rest of Europe | Mexico | India
Disclaimer: Sun Storm Investment and NexGen are not registered financial advisors, so please do your own research before trading & investing anything. This is information is for only research purposes not for actual trading & investing decision.
#debadipb #profitsolutions

Lloyds Banking UKSun Storm Investment Trading Desk & NexGen Wealth Management Service Present's: SSITD & NexGen Portfolio of the Week Series
Focus: Worldwide
By Sun Storm Investment Research & NexGen Wealth Management Service
A Profit & Solutions Strategy & Research
Trading | Investment | Stocks | ETF | Mutual Funds | Crypto | Bonds | Options | Dividend | Futures |
USA | Canada | UK | Germany | France | Italy | Rest of Europe | Mexico | India
Disclaimer: Sun Storm Investment and NexGen are not registered financial advisors, so please do your own research before trading & investing anything. This is information is for only research purposes not for actual trading & investing decision.
#debadipb #profitsolutions

Dassault Systemes UKSun Storm Investment Trading Desk & NexGen Wealth Management Service Present's: SSITD & NexGen Portfolio of the Week Series
Focus: Worldwide
By Sun Storm Investment Research & NexGen Wealth Management Service
A Profit & Solutions Strategy & Research
Trading | Investment | Stocks | ETF | Mutual Funds | Crypto | Bonds | Options | Dividend | Futures |
USA | Canada | UK | Germany | France | Italy | Rest of Europe | Mexico | India
Disclaimer: Sun Storm Investment and NexGen are not registered financial advisors, so please do your own research before trading & investing anything. This is information is for only research purposes not for actual trading & investing decision.
#debadipb #profitsolutions

Atlas Copco B UKSun Storm Investment Trading Desk & NexGen Wealth Management Service Present's: SSITD & NexGen Portfolio of the Week Series
Focus: Worldwide
By Sun Storm Investment Research & NexGen Wealth Management Service
A Profit & Solutions Strategy & Research
Trading | Investment | Stocks | ETF | Mutual Funds | Crypto | Bonds | Options | Dividend | Futures |
USA | Canada | UK | Germany | France | Italy | Rest of Europe | Mexico | India
Disclaimer: Sun Storm Investment and NexGen are not registered financial advisors, so please do your own research before trading & investing anything. This is information is for only research purposes not for actual trading & investing decision.
#debadipb #profitsolutions

BioGaia B UKSun Storm Investment Trading Desk & NexGen Wealth Management Service Present's: SSITD & NexGen Portfolio of the Week Series
Focus: Worldwide
By Sun Storm Investment Research & NexGen Wealth Management Service
A Profit & Solutions Strategy & Research
Trading | Investment | Stocks | ETF | Mutual Funds | Crypto | Bonds | Options | Dividend | Futures |
USA | Canada | UK | Germany | France | Italy | Rest of Europe | Mexico | India
Disclaimer: Sun Storm Investment and NexGen are not registered financial advisors, so please do your own research before trading & investing anything. This is information is for only research purposes not for actual trading & investing decision.
#debadipb #profitsolutions

AztraZenica UKSun Storm Investment Trading Desk & NexGen Wealth Management Service Present's: SSITD & NexGen Portfolio of the Week Series
Focus: Worldwide
By Sun Storm Investment Research & NexGen Wealth Management Service
A Profit & Solutions Strategy & Research
Trading | Investment | Stocks | ETF | Mutual Funds | Crypto | Bonds | Options | Dividend | Futures |
USA | Canada | UK | Germany | France | Italy | Rest of Europe | Mexico | India
Disclaimer: Sun Storm Investment and NexGen are not registered financial advisors, so please do your own research before trading & investing anything. This is information is for only research purposes not for actual trading & investing decision.
#debadipb #profitsolutions
