Tesla - This bullish break and retest!Tesla - NASDAQ:TSLA - confirmed the bullish reversal:
(click chart above to see the in depth analysis👆🏻)
Tesla recently created a very bullish break and retest. Therefore together with the monthly bullish price action, the recent rally was totally expected. But despite the short term volatility, Tesla remains bullish, is heading higher and will soon create new highs.
Levels to watch: $400
Keep your long term vision!
Philip (BasicTrading)

6/16/25 - $crcl - I'm short6/16/25 :: VROCKSTAR :: NYSE:CRCL
I'm short
- it's much easier to find shorts in this tape than the converse
- NYSE:CRCL is the chitstablecoin that broke a few yrs ago and nobody serious in "crypto" (when i mention "serious" i mean bitcoiners) uses
- they basically hold deposits and give you a USD-style token and earn the spread
- but if you look at financials... they don't make nearly as much $ as they should on these deposits
- ofc they'll tell you they're doing a lot of other silly things
- "yes" stables and the stables economy r red hot (hence the stonk price reaction). also kudos to them for IPO'ing in this window. it was really a great time to do it. so hats off.
- but what is an inferior stable (USDT/ tether is the only legit product on the market) worth?
- multiple hundreds of times PE?
- 10x book?
- guys... this is basically a one-trick-pony-bank, they aren't reinventing the wheel, and most products built around USDC won't likely be launched by circle b/c the org is slow/ expensive and will be highly regulated to doing such things in a reasonable window of time
- so will it go higher? idk. idc. i'm looking for shorts.
- this one is a bit OTM for oct. it's a helluva expensive short, probably for good reason
- but i don't think this valuation holds
- and it's great offset/ hedge to my monster OTC:OBTC stack, which i expect a convert in the next 2-3m to ETF, which means 15% upside on this holding. so i need an offset here, hence i'm looking for some beta-adjacent hedges.
V

Is DJT getting ready for a pump?The “Pump”—Trump Hype and Public Signals
-Trump’s social media signals: Trump frequently posts “THIS IS A GREAT TIME TO BUY!!! DJT” on Truth Social or X, coinciding with dramatic tariff announcements or political rallies. Shortly after, DJT stock often spikes—rising ~22% in a single day following one such call.
-High volatility & trading halts: The stock is extremely volatile; it sometimes triggers multiple trading halts within a single session due to rapid price surges fueled by meme-like interest.
-Retail-driven surge: The spike is largely driven by speculative retail traders—symbolic of meme-stock behavior and “scalper” pump tactics.
-It seems that the "pumps" are getting smaller and smaller, leading to a possible max pump of around 100-200% next time, if there's any pump. And as the current chart stands, the 16$ area seems like the start of the pump. But everything can change, and a new low could form and no pump could come.
The “Dump”—Insider and Early-Exit Selling
-Coinciding insider sales: Major shareholders—including Pam Bondi and other insiders—have sold significant chunks of DJT stock right after sharp price jumps.
-Sharp declines post-hype: Shares often retreat quickly after peaks. DJT’s recent crash washed out ~$2.4 billion in Trump's paper wealth, erasing gains from spikes tied to political victories.
-Regulatory red flags: Critics and regulators accuse Trump of influencing stock spikes before selling—bordering on “scalping,” a form of pump-and-dump via social presence.
-Disclaimer: This analysis is for informational and educational purposes only and does not constitute financial advice, investment recommendation, or an offer to buy or sell any securities. Stock prices, valuations, and performance metrics are subject to change and may be outdated. Always conduct your own due diligence and consult with a licensed financial advisor before making investment decisions. The information presented may contain inaccuracies and should not be solely relied upon for financial decisions. I am not personally liable for your own losses, this is not financial advise.

$OSCR - Finally Breaking Out! 125% UpsideThis move is nothing when talking about what's to come for a company this undervalued!
NYSE:OSCR is going to go PARABOLIC!!!

General Dynamics Launch Pad Cleared for TakeoffNYSE:GD Multiple Bullish Signals Detected
- Geopolitical tensions are causing bullish tailwinds for the defense sector
- Tested .5 Fibonacci retracement level 5 times before breakout, now retesting as support
- Lined up perfectly with the trendline breakout and retest
- And the overnight gap from June 12 to 13 was filled today, ready for a reversal to the upside.
- 50MA touching 200ma, a golden cross in the coming days is inevitable
- Geopolitical escalation with the golden cross will cause massive inflows (traders & quants)
Isn't it obvious? It's in front of your eyes. Don't overthink it.
- READ THE CHARTS 6/16/25

6/16/25 - $qubt - 20% short. ice cold veins.6/16/25 :: VROCKSTAR :: NASDAQ:QUBT
20% short. ice cold veins.
- puts/ size managed approps.
- be warned, this company won't likely ever deliver a product.
- therefore, it's very likely worth exactly zero.
- i'll take it to 30% if i need to in the next few sessions leading up to it's "index inclusion" where it will get absolutely decimated as funds find it an "easy" funding short on the mgn.
- mgmt will have a hard time testifying in court why they are making various misleading statements which are likely fraudulent and at worst criminal. but that's just a guess.
- alas who knows.
- i don't have a crystal ball
- but i know a donut when i see one.
V


Trading at the Market OpenTrading at the Market Open
The market open marks a critical juncture in the financial world, presenting a unique blend of opportunities and challenges for traders. This article explores the essence of trading at the open across stocks, forex, and commodities. It delves into the heightened volatility and liquidity characteristic of this period, offering insights and strategies to navigate these early market hours effectively, setting the stage for trading opportunities.
What Does the Open Mean in Stocks, Forex, and Commodities?
The open signifies the start of the trading day for various financial markets. It's a time when trading activity surges, marked by a rush of orders that have accumulated since the previous close. In stock markets, this includes shares, indices, and Exchange-Traded Funds (ETFs). The influx of orders often leads to significant price movements as the market absorbs overnight news and global economic developments.
For forex and commodity markets, the open can vary by region, reflecting their 24-hour nature. This period is crucial for setting the tone of the trading day, offering insights into sentiment and potential trends. Traders closely watch the market open to gauge the strength of these movements, which can indicate broader market trends or sector-specific shifts.
Volatility and Liquidity at Market Open
Trading at the open is often marked by enhanced volatility and liquidity. Heightened volatility is primarily due to the influx of orders accumulated overnight, reacting to various global events and news. As traders and investors assimilate this information, rapid price movements are common, especially in the first few minutes of the session. These price fluctuations can present both opportunities and risks for traders.
Increased liquidity, which refers to the ease with which assets can be bought or sold without causing significant price movements, is also a characteristic of the open. A higher number of market participants during this period may result in better order execution and tighter bid-ask spreads, particularly in highly liquid markets like forex and major stock indices.
What to Know Before the Market Opens
In terms of things to know before the stock market opens, it's essential to review the overnight and early morning news that can affect stocks. This includes company earnings reports, economic data releases, and geopolitical events. Traders also check pre-market trading activity to gauge sentiment and potential opening price movements.
For forex and commodities, understanding global events is crucial. Developments in different time zones, like policy changes by central banks or shifts in political scenarios, can significantly impact these markets. Additionally, reviewing the performance of international markets can provide insights, as they often influence the US open.
It's also vital to analyse futures markets, as they can indicate how stock indices might open. Lastly, around the forex, commodity, and stock market openings, indicators and other technical analysis tools applied to the previous day can also offer valuable context for the day ahead.
Market Open in Different Time Zones
Market open times vary globally due to different time zones, significantly impacting trading strategies. For instance, the New York Stock Exchange (NYSE) opens at 9:30 AM Eastern Time, which corresponds to different times in other parts of the world. For traders in London, this translates to an afternoon session, while for those in Asian markets like Tokyo, it's late evening.
Forex, operating 24 hours a day during weekdays, see overlapping sessions across different regions. For example, when the Asian trading session is concluding, the European session begins and later overlaps with the North American session. Such global interconnectivity ensures that forex markets are active round the clock, offering continuous trading opportunities but also requiring traders to be mindful of time zone differences and their impact on liquidity and volatility.
Strategies for Trading at Market Open
Trading at market open requires strategies that can handle rapid price movements across all markets. Here are some effective approaches:
- Pay Attention to Pre-Market Trends: This helps traders assess how a stock might behave at the market open. If a stock is fading from post-market highs, it might be wise to wait for a trend change before entering.
- Gap and Go Strategy: This involves focusing on stocks that gap up on positive news at market open, an indicator of potential further bullishness. Traders look for high relative volume in pre-market and enter trades on a break of pre-market highs. This strategy is fast-paced and requires quick decision-making.
- Opening Range Breakout (ORB): The ORB strategy uses the early trading range (high and low) to set entry points for breakout trades across all types of assets. The breakout from this range, typically the first 30 to 60 minutes of the session, often indicates the price direction for the rest of the session. Time frames like 5-minute, 15-minute, and 30-minute are commonly used for ORB.
- Gap Reversal: The gap reversal method is used when the price creates a gap, but then the range breaks in the opposite direction. If the gap is bullish and the price breaks the lower level of the opening range, it signals a gap reversal. The same concept applies to bearish gaps but in reverse.
The Bottom Line
In essence, understanding unique features of market open trading is vital for those participating in stock, forex, and commodity markets. The opening moments are characterised by heightened volatility and liquidity, driven by global events and sentiment. However, savvy traders may capitalise on these early market dynamics with effective strategies.
This article represents the opinion of the Companies operating under the FXOpen brand only. It is not to be construed as an offer, solicitation, or recommendation with respect to products and services provided by the Companies operating under the FXOpen brand, nor is it to be considered financial advice.

AMD Elliott Wave Analysis: 5 Wave Rally Supports Bullish BiasSince bottoming out on April 10, 2025, Advanced Micro Devices (AMD) has embarked on a robust rally, signaling a bullish trend. Technical analysis reveals a five-swing sequence from the April 10 low, favoring continued upward momentum. The initial ascent, wave (1), peaked at $97.91, followed by a corrective pullback in wave (2) that found support at $83.75. The stock then surged in wave (3) to $122.52. A subsequent retracement in wave (4) concluded at $107.10, as depicted in the one-hour chart below. Currently, wave (5) is unfolding, structured as an impulse in a lesser degree, driving the stock higher.
From the wave (4) low, the subdivision of wave (5) began with wave ((i)) reaching $117.05, followed by a dip in wave ((ii)) to $108.62. The rally resumed in wave ((iii)), peaking at $119.40, with wave ((iv)) retracing to $114.25. The final leg, wave ((v)), concluded at $124.60, completing wave 1 of a higher degree. A corrective wave 2 unfolded as a zigzag, with wave ((a)) declining to $119.88. Wave ((b)) rebounded to $121.35, and wave ((c)) bottomed at $115.06. As long as AMD holds above $107.10, expect one more upward leg to complete wave 3. Then it should be followed by a wave 4 pullback and a final push in wave (5) to conclude the cycle from the April 10 low. This structured advance underscores AMD’s bullish outlook, with key support levels guiding its near-term trajectory.

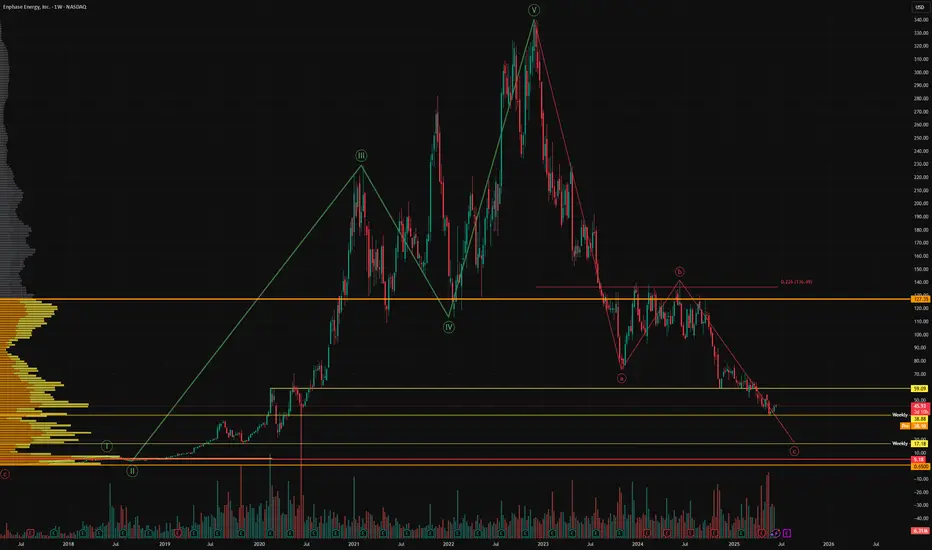
The last leg down?Enphase is holding on for it's life here, if support is lost then we could be heading towards my final target of $17-20. This stock has been a disaster. We had a 5 wave move up, then an abc correction. We are still in the final leg of wave c, nobody knows where it will end.
I have kept an eye on the stock, i'm certainly not trying to be too smart catching this falling knife. The downtrend was compounded last night by the news I was long anticipating - the administration is withdrawing tax credits for the industry.
Whilst this indeed a highly volatile stock that shows no strength of reversing trend, I may swing trade this stock once the sellers are exhausted. There is a need for energy in the AI era, solar will not disappear and this maximum fear scenario may soon present an opportunity.
Not financial advice, do what's best for you.
NIO CHART UPDATETRENDS AND PRICE TARGETS MARKED
GAPS IN YELLOW
Guideline in yellow.
Watch the two major trends closely, (RED)
short term trends going down are about to break.
Red trends will become support when price crosses over and confirms the Daily.
Good luck!

CRWV high tight flag pattern we have a breakout setting up at 162 ive taken a position at the open with a stop under 154 this is the best pattern in the market.
WE have huge momo the last month now we have the first consolidation in the run. It shoudl get bought as the fomo kicks in,

Oscar Health Bullish Continuation Oscar Health has broken out of a long descending wedge and is now resuming its broader bullish channel trend. With volume surging and smart money signals appearing near key supports, the chart targets a 94% measured move to $26.76, with the possibility of continuation toward $50.00 if trend strength persists.
A strong bullish structure remains valid as long as price stays above $13.68.

AAPL Breaking Structure! Gamma Says Caution — Is $195 Next? 🍎 AAPL Breaking Structure! Gamma Says Caution — Is $195 Next? 🔻
🧬 GEX Options Sentiment Analysis:
* Gamma Key Levels:
* CALL Walls:
* $202.50 (moderate resistance)
* $205 = Gamma Wall / Call Resistance
* $210–215 = Higher walls unlikely to reach short-term without catalyst
* PUT Walls:
* $198 = 2nd PUT Wall and Heavy Volume Level (HVL)
* $195.70 = Highest negative NET GEX / PUT magnet
* Below $195 opens risk to $192.50, $190 (GEX7/10 cluster)
* Options Metrics:
* IVR: 21.6
* IVx avg: 30.2
* PUT Flow: 0% (!!) – no PUT buyers showing up (caution on reversals)
* GEX Sentiment: 🔴🔴🔴🔴 (very bearish tilt)
* Interpretation:
* AAPL is hugging the gamma flip zone at $198–$200. If it breaks and stays under $198, dealers may accelerate hedging, sending it down toward $195/$192.
* Call side is weak; momentum buyers missing.
🧠 15-Minute SMC Structure Breakdown:
* Current Price: $197.18
* Structure:
* CHoCH confirmed just below supply at $198.50 → bearish sign.
* Repeated rejections from the supply zone (pink box).
* Broke ascending wedge/trendline support on rising volume — bearish pattern confirmation.
* Demand box sits near $195.70–$196.50.
* Volume:
* Bearish volume increasing during rejection = potential for trend continuation lower.
⚔️ Trade Scenarios:
🟥 Bearish Breakdown Setup:
* Trigger: Confirmed close below $196.50 with increasing volume.
* Target 1: $195.70 (GEX/SMC demand)
* Target 2: $192.50 (GEX7 magnet)
* Stop-loss: $198.50
Strong confluence with gamma, SMC structure, and volume break = high-probability short.
🟩 Bullish Reversal Setup (Low Probability):
* Trigger: Reclaim of $198.89 with conviction
* Target 1: $200
* Target 2: $202.50 (CALL wall)
* Stop-loss: Below $196.45
Only consider if SPY/QQQ stage reversal bounce and AAPL leads.
💡 My Thoughts:
* AAPL looks weak and vulnerable heading into Tuesday.
* If price loses $196.45, gamma + structure suggests fast flush to $195 and possibly $192.
* This is not the spot to go long blindly — let the level reclaim first.
* PUT flow being 0% despite this setup suggests retail hasn't stepped in — this could change rapidly.
🔚 Conclusion:
AAPL is breaking down from structure and trending toward gamma PUT support. Options sentiment and Smart Money structure are both aligning for bearish continuation — short bounces are sell opportunities unless $199+ is reclaimed with strength.
Disclaimer: This is for educational purposes only. Always manage your risk and follow your plan.
Would you like to format this for a TradingView post next or combine all into one GEX/TA wrap-up?

Reddit breaks out for bullish run I have been watching Reddit for a couple of weeks and identified that we had put in the .786 low from the correction since February and then formed a range that was well respected for the past 4 months .
In this video I highlight zones where i expect price to gravitate too and where a nice entry will be if you are looking to long reddit.
Tools used Fib suite , trend based fib , tr pocket , 0.786 + 0.382 and fixed range .

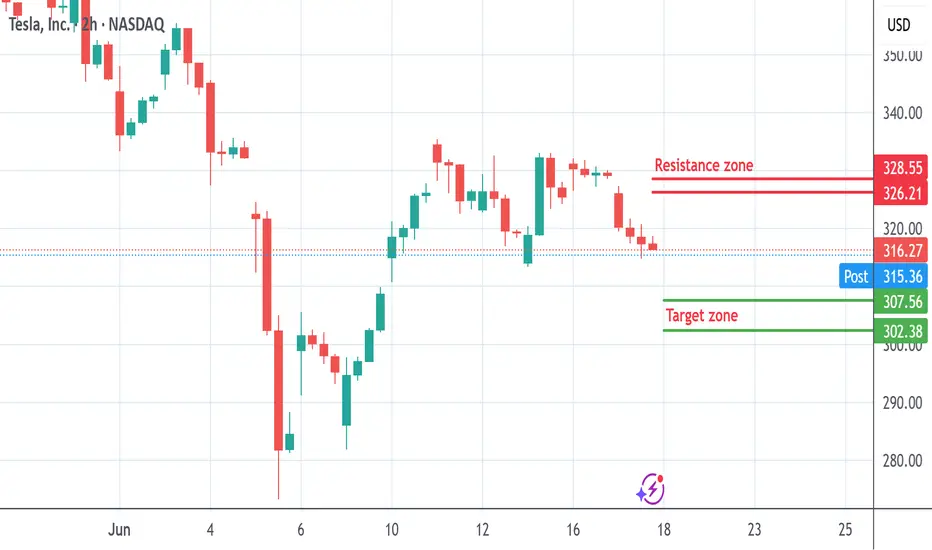
TSLA trade of the weekThis idea is something new where I'm asking my HIGHLY EXPERIMENTAL dowsing work for a "best bang for your buck" trade at the beginning of the week. Last week was pretty good saying to short SPY on Wed., so I'm going to journal these and see if it can be consistent.
If this aligns with YOUR work, great.
The idea is TSLA has a spike up towards the upper gap around $326-28. My levels on TSLA often are overshot, but anyway. Then watch for it to head towards the lower gap in the $310-307 zone and possibly down to $302.
My work is INCONSISTENT. There's more going into this than just looking at an indicator. This is energy, intention, intuition and God knows what else and it's more for myself than you. But, if you're interested, I'm happy to answer questions and share as I hope it inspires your own sense of what is possible beyond just the physical world.
Nvidia - 100% new all time highs!Nvidia - NASDAQ:NVDA - is just too bullish now:
(click chart above to see the in depth analysis👆🏻)
Honestly it was not unexpected that Nvidia is now the most valuable company in the world. The chart is just so strong and perfectly following structure; it seems to be just a matter of days until Nvidia will create a new all time high. If this happens, a breakout rally will follow.
Levels to watch: $150
Keep your long term vision!
Philip (BasicTrading)

AMD First touch of 1W MA50 after 8 months!Advanced Micro Devices (AMD) hit today its 1W MA50 (blue trend-line) for the first time in almost 8 months (since October 28 2024). This is a crucial test as the las time this level broke as a Resistance following a Channel Up bottom rebound was on the week of January 30 2023.
When that happened, the Bullish Leg extended the upside to complete a +143.12% rise, before the next 1W MA50 pull-back.
As a result, if we close the week above the 1W MA50, we expect to see $185 before the end of the year.
-------------------------------------------------------------------------------
** Please LIKE 👍, FOLLOW ✅, SHARE 🙌 and COMMENT ✍ if you enjoy this idea! Also share your ideas and charts in the comments section below! This is best way to keep it relevant, support us, keep the content here free and allow the idea to reach as many people as possible. **
-------------------------------------------------------------------------------
💸💸💸💸💸💸
👇 👇 👇 👇 👇 👇

Cisco Is Pushing a Generational HighCisco Systems has climbed as AI investment helps power growth, and some traders may think the move will continue.
The first pattern on today’s chart is the February 13 peak of $66.50. It was the highest level since September 2000, when the dotcom bubble was deflating. The networking giant come within $0.14 of that level on June 9 and remains in close proximity. Is a breakout coming?
(If CSCO were to clear this year’s peak, investors may next eye $82, its previous all-time high from March 2000.)
Next consider the May 15 closing price of $64.26 following strong quarterly results. The stock probed below the level last week and bounced. That may suggest old resistance has become new support.
Third, the 8-day exponential moving average (EMA) has stayed above the 21-day EMA. Such a sequence may reflect a short-term uptrend.
Finally, Bollinger Band Width has dropped as price moves narrow. Could that tightening price action open the door to price expansion?
Check out TradingView's The Leap competition sponsored by TradeStation.
TradeStation has, for decades, advanced the trading industry, providing access to stocks, options and futures. If you're born to trade, we could be for you. See our Overview for more.
Past performance, whether actual or indicated by historical tests of strategies, is no guarantee of future performance or success. There is a possibility that you may sustain a loss equal to or greater than your entire investment regardless of which asset class you trade (equities, options or futures); therefore, you should not invest or risk money that you cannot afford to lose. Online trading is not suitable for all investors. View the document titled Characteristics and Risks of Standardized Options at www.TradeStation.com . Before trading any asset class, customers must read the relevant risk disclosure statements on www.TradeStation.com . System access and trade placement and execution may be delayed or fail due to market volatility and volume, quote delays, system and software errors, Internet traffic, outages and other factors.
Securities and futures trading is offered to self-directed customers by TradeStation Securities, Inc., a broker-dealer registered with the Securities and Exchange Commission and a futures commission merchant licensed with the Commodity Futures Trading Commission). TradeStation Securities is a member of the Financial Industry Regulatory Authority, the National Futures Association, and a number of exchanges.
TradeStation Securities, Inc. and TradeStation Technologies, Inc. are each wholly owned subsidiaries of TradeStation Group, Inc., both operating, and providing products and services, under the TradeStation brand and trademark. When applying for, or purchasing, accounts, subscriptions, products and services, it is important that you know which company you will be dealing with. Visit www.TradeStation.com for further important information explaining what this means.

UNH - Bullish Trade IdeaUNH Trade Plan : Entry Zone
Momentum Breakout Entry (Candle Trigger): Reclaim of 314.76 level (15m) with bullish engulfing candle or strong candle 12cloud (15m/30m).
Ideal Pull Back Entry Range (Micro Pullback): $310.50 – $312.20 (deep liquidity pocket + 1H bullish order block).
Entry refinement = Wait for 15m or 30m candle signal + WTMA inverse Arc or Level 3 Floating candle
🛡 Stop Loss / Take-Profit Ladder
Stop Loss Zone: $308.65 (under VWAP band and bottom of HTF breaker)
TP Ladder:
TP1: $317.35 → Weak high sweep
TP2: $320.63 → Final breakout retest
TP3: $324.18 → Macro swing target (2H FVG supply hit)

AmdRising wedge here approaching 130-133 double top resistance..
Daily candle extended outside bband..
Look for a pullback to 96-105
Entry 127-131..
Stop loss - A close above 134.00
SOXL (Chip sector) hasn't broken out and the weekly candle finished bearish so I don't think AMD will move over 130
If price does close above 134 then 180 is incoming

Who’s with me on PLTR?PLTR is showing a very clear and strong bullish trend, making this an A+ trade setup in my book – especially given how close the price is to a key level. 🔍
🔹 Liquidity Sweep Setup:
On Friday, June 13, the opening swept the liquidity created on Wednesday, June 11 at 9:40 AM – an institutional move that left an imbalance candle.
Then, at 8:30 AM on the same Friday, liquidity was taken below the 5:30 AM low, setting the stage for a strong institutional move at the 9:30 AM opening.
Just before the open, at 9:20 AM, a Fair Value Gap (FVG) was formed – this became our focus entry area, which also aligned with resistance points from June 10, 11, and 13. 📊
🔹 A+ Trade Conditions:
What makes this trade so attractive is how the 9:30 AM candle created bearish liquidity, giving us a clear liquidity point to target for our entry. This aligns perfectly with the Vep Trader liquidity sweep strategy. ✅
📍 Trade Setup:
Entry: $133.33
Stop Loss: $132.00
Take Profit: $140.00
Let’s see how this plays out! Who’s riding this wave with me? 🌊💰
#PLTR #Stocks #TradingView #LiquiditySweep #FVG #PriceAction #SmartMoney #DayTrading #OptionsTrading #StockMarket #BullishSetup #VepTrader #TechnicalAnalysis #MarketStructure

RGTI : First Long Position AreaNASDAQ listed Rigetti Computing Inc. stock is currently trading above the 50 and 200 period moving averages.
Once it gained momentum, it later lost it but its outlook is not weak at the moment.
Right now, if the Iran-Israel war uncertainty is overcome and if there is no bad news affecting the index, the gap may close.
Risk/Reward ratio of 3.00 is a very valuable ratio to try with small position amounts.
Risk/Reward Ratio : 3.00
Stop-Loss : 9.91
Take-Profit : 18.2
Regards.
