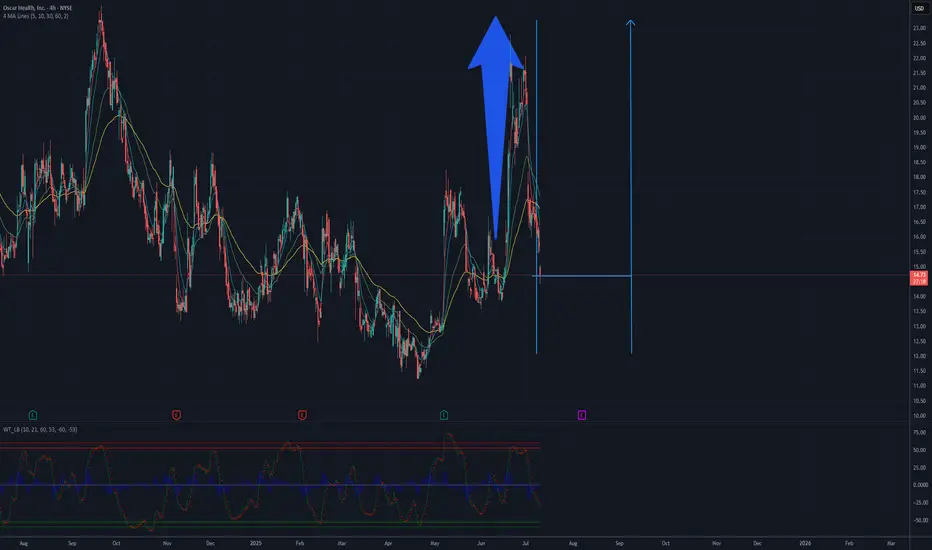
Potential Upside for OSCR.US – Targeting $23Oscar Health (OSCR.US) is currently trading near the technical support zone of $14–$15, a level that has historically acted as a base for rebounds. In May and June 2025, the stock saw sharp upward movements, breaking through the $20 mark, which confirms strong bullish potential. The current pullback may offer a buying opportunity before another upward leg. Once the resistance at $18–$20 is cleared, a move toward $23 — the September 2024 high — appears achievable. This scenario is supported by the technical setup and past price reactions at these levels.
Potential TP: 23 usd
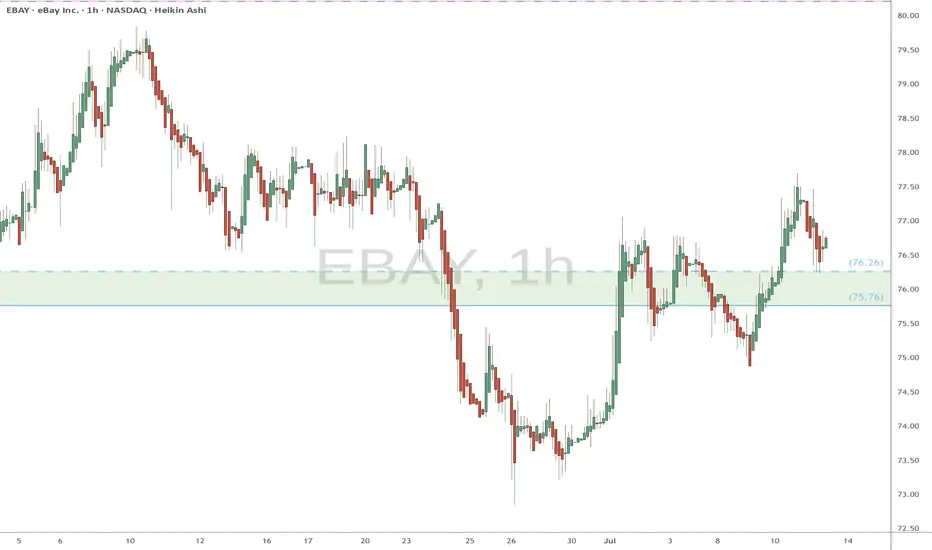
EBAY watch $75.76-76.26: Key Support zone to launch next Leg UP EBAY trying to get back above its ATH from 2021.
Now testing a key support zone at $75.76-76.26.
Good but late long entry with StopLoss just below.
.
See "Related Pubications" for previous charts such as THE BOTTOM call:
Hit the BOOST and FOLLOW for more PRECISE and TIMELY charts.
=========================================================
WHAT GOES UP MUST COME DOWN wants to close daily gap at $123.66CRWV forms ‘Head and Shoulders’ on the daily over the past month. The breakout to $180s is all I saw a month ago…but now a reversal has started to $123.66 and maybe to $111.95 as the worse case scenario. My daughter made me hold on to this one like she did on Nvidia. She was right on that one….but she is 45 and I am 82. She has more time to wait it out than me. CRWV has taken the path of many IPOs….it pulls up right after coming out of the gate. Regains its footing and starts to move (using horse racing terminology) Great speed rating, so she gains ground in the first turn. Still improving her time down the backstretch as she breaks the $100 mark by middle of May and gaining momentum. She continues to pass horses and moves into the lead as they reach the 1/4 pole. By now it’s apparent that CRWV is a closer as she demonstrates moving down the last eighth of a mile. As she roars up the home stretch 8 lengths ahead of the field closing above $180.
Unfortunately her next race is dismal as she forms a ‘head and shoulder’ pattern. From here it’s all downhill until she reaches $123.66 …..or worse $111.95

NETFLIX 1D MA50 test is a new buy opportunity.Netflix (NFLX) has been rising non-stop since the April 07 bottom on the 1D MA200 (orange trend-line). This bottom has been the latest Higher Low of the 3-year Channel Up that started on the June 14 2022 bottom.
This kickstarted its third long-term Bullish Leg. The previous two have been fairly similar (+210% and +195.93%) so we can assume a minimum total rise of +195.93% until the next top (Higher High of the Channel Up).
We can also see that on each Bullish Leg, after the initial rebound, the stock always tested the 1D MA50 (blue trend-line) around the 0.236 Time Fibonacci level. That has always been the best buy opportunity of that stage.
As a result, we believe that the recent short-term correction is a buy opportunity in disguise, targeting a Higher High at $2200.
Check out our previous analysis on Netflix:
-------------------------------------------------------------------------------
** Please LIKE 👍, FOLLOW ✅, SHARE 🙌 and COMMENT ✍ if you enjoy this idea! Also share your ideas and charts in the comments section below! This is best way to keep it relevant, support us, keep the content here free and allow the idea to reach as many people as possible. **
-------------------------------------------------------------------------------
💸💸💸💸💸💸
👇 👇 👇 👇 👇 👇

Green Plains | GPRE | Long at $4.18Green Plains NASDAQ:GPRE , a company involved in the production of fuel-grade ethanol and corn oil, and grain handling/storage has seen a significant decline in stock price since 2023. Analyzing the company's historical stock performance shows it is highly cyclical and goes through "boom and bust" cycles every 4-8 years - whereby during booms the price has typically 10x'ed from the lows. History may not repeat, though.
From a pure technical analysis perspective, the company has already entered and slightly exited by "crash" simple moving average zone (green lines). While the lows may not be in yet, this zone (currently between $1.20 and $3.30) typically represents a longer-term bounce area or price consolidation.
Fundamentally, the company is currently unprofitable but expected to become profitable in 2026 and beyond. Debt-to-equity = 0.72x (low/moderate). Price-to-book = 0.31x. During the most recent earnings call, Chief Legal and Administration Officer at Green Plains noted the company’s past performance has not met expectations, but stressed “that is changing.” This includes exiting non-core operations and launching the sale of non-strategic assets in a commitment to achieve $50 million in cost reductions. The company is on track to meet that goal and has already achieved $30 million in annualized cost savings.
It's a speculative play that could go to $0. But at $4.18, NASDAQ:GPRE is in a personal buy zone based on technical analysis as well as future fundamental predictions (which could be BS...).
Targets:
$6.00
$8.00

The case for $FUTU, Breakout imminent !NASDAQ:FUTU gapped up sometime in September 2024 from the double digits to the triple digits.
This gap and run was a result of a breakout of the saucer formation on the weekly chart.
Ever since then it has had a muted showing, trading in a channel with a resistance of about $130 and a support in the $90ish range.
Within this channel, NASDAQ:FUTU has recently formed an inverse head and shoulder pattern which by all indications points to an imminent breakout and subsequent bullish move.
Fundamentally, NASDAQ:FUTU has consistently beat earnings and with rising revenue and some positive news from China, I expect this to easily scale $130 to $150. Price is riding well above the 50‑week EMA and the 200‑week SMA and JPMorgan nudged its target up to $170 in March, seeing “sustained monetisation of wealth‑management flows."
I am looking at a more conservative first target zone at $160‑167 and an extension to $181. A weekly close back below $112 would negate the bullish pattern and put the 200‑week SMA (~ $96) back in play.
I am long on this and I expect TP around August ending to mid September.

Ethereum Empowers Its Future Zero-Knowledge TechnologyThe Ethereum $2,969 Foundation has unveiled a new roadmap that aims to expand zero-knowledge (ZK) technologies across the network shortly after the ETH price surpassed the $3,000 threshold. This announcement aims to enhance scalability while concurrently reducing transaction fees and bolstering both security and privacy. The foundation has emphasized integrating ZK-based solutions into the primary layer to accelerate the user experience. This development marks a critical period that may prompt Layer 2 projects and entrepreneurs within the ecosystem to reconsider their competitive strategies.
Key Objectives of the Announced Zero-Knowledge Roadmap
Today, the Ethereum Foundation announced through its official channels that the primary goal is to institutionalize the “ZK-based verification” model at every network point. The plan envisions directing energy from intensive smart contracts towards more efficient cryptographic proofs to reduce transaction congestion. This approach aims to make the network accessible to larger audiences with lower-cost and faster approval processes.
The second focal point is to deepen the security layer. A foundation executive stated, “By integrating ZK technology into our network, we are not only enhancing privacy and security but also achieving significant improvements in transaction efficiency.” The objective is to establish a privacy standard rather than just performance. Within this framework, new technical collaborations and developer grants will be highlighted, with the priority being to develop toolsets and training programs that accelerate integration.
Potential Impacts of the Roadmap on the Layer-2 Ecosystem
The new roadmap closely concerns Layer 2 projects, which have long provided scalability with ZK Rollup solutions. Experts emphasize that local ZK integration could narrow the competition advantage of these projects but also lay the groundwork for stronger collaborations. Initiatives may need to update their architectural plans to reinforce compatibility with the main network.
As relevant actors seek different models to cover compliance costs, an environment is emerging that will open doors to new partnerships and grants. This process, paralleling Ethereum’s scalability goal, may direct the developer community within the network towards ZK-centered innovation. On the market side, the interest in ETH seems to be supported by expectations of increased security and privacy.

MicroStrategy ($MSTR) – Bitcoin Proxy Setting Up AgainMicroStrategy Incorporated NASDAQ:MSTR remains the definitive institutional proxy for Bitcoin exposure, uniquely combining its enterprise software operations with a high-conviction, leveraged Bitcoin accumulation strategy. Its $1.42B BTC purchase in April 2025 further cements this thesis, making MSTR a prime vehicle for traders seeking amplified BTC exposure via equities.
Since our May 5th analysis, MSTR has rallied ~14.61%. We’re now eyeing a re-entry opportunity on a pullback to the $394–$387 zone, aligning with technical support and previous consolidation.
🎯 Bullish targets remain unchanged: $490.00–$500.00, backed by Bitcoin strength and MicroStrategy’s unwavering strategy.
🔁 Re-entry: $394–$387
🟩 Targets: $490–$500
#MSTR #Bitcoin #CryptoStocks #BTC #StockMarket #TechnicalAnalysis #MicroStrategy #HighBeta #CryptoExposure #TradingSetup

Safe Entry IONQGreen Zone is Safe Entry.
Stop loss below Green Zone (or blue line both are supports with 200MA below too).
Red Zone is Sell.
Note: each line(E.g. blue lines) acts as Strong Support/Resistance.
Note: 1- Potentional of Strong Buying Zone:
We have two scenarios must happen at The Mentioned Zone:
Scenarios One: strong buying volume with reversal Candle.
Scenarios Two: Fake Break-Out of The Buying Zone.
Both indicate buyers stepping in strongly. NEVER Join in unless one showed up.
2- How to Buy Stock (safe way):
On 1H TF when Marubozu/Doji Candle show up which indicate strong buyers stepping-in.
Buy on 0.5 Fibo Level of the Marubozu/Doji Candle, because price will always and always re-test the

Navitas Semiconductor Corporation ( NVTS )Unfortunately, W1 completed at 7.52$, then we started W2 formed as a Running Flat correction with strong (b)= 162% of starting wave (a) and it come as zigzag correction, we are Today at the End of wave (c) that comes as an contracting ending diagonal which is supposed to end at 60%(5.98$ - 6.00$) of wave (a), / or wave (c) = 100% (6.60$) - 123.6% (5.98$) length (a).
### There were cases wave (c) Ended at least 60%(5.89$) of wave (a).
Running Flat correction is the ending of W2, after that, we going to start W3 the Motive Powerful Expending Wave ever that its Target price = 26.40$ - 27.30$ at that level we also end Nen-Star Harmonic pattern to start correction of W4 to about 16$-20$ depending on How aggressive Sellers will deal with W4, at the End we will Expect to End W5 between 37$ - open Zone to 40$.
# Explosive 💣 level to make sure we completed W2 and starting W3 to Pass level 6.70$.
# Highly recommended for starting Buying Now.

Potential Top in CostcoCostco Wholesale has been quietly limping, and some traders may see downside risk in the big-box retailer.
The first pattern on today’s chart is the June low of $973.90. COST made lower highs while trying to hold that level but is now sliding below it. That may be viewed as a potentially bearish triangle breakdown.
Second, the 8-day exponential moving average (EMA) is under the 21-day EMA. MACD is also falling. Both of those signals may be consistent with short-term downtrends.
Third, COST made a lower high in June compared with February. Compared with the broader market’s breakout, such price action may reflect a lack of buying interest.
Finally, the 100-day simple moving average has turned meaningfully lower for the first time in over two years. That may suggest a weakening longer-term trend.
TradeStation has, for decades, advanced the trading industry, providing access to stocks, options and futures. If you're born to trade, we could be for you. See our Overview for more.
Past performance, whether actual or indicated by historical tests of strategies, is no guarantee of future performance or success. There is a possibility that you may sustain a loss equal to or greater than your entire investment regardless of which asset class you trade (equities, options or futures); therefore, you should not invest or risk money that you cannot afford to lose. Online trading is not suitable for all investors. View the document titled Characteristics and Risks of Standardized Options at www.TradeStation.com . Before trading any asset class, customers must read the relevant risk disclosure statements on www.TradeStation.com . System access and trade placement and execution may be delayed or fail due to market volatility and volume, quote delays, system and software errors, Internet traffic, outages and other factors.
Securities and futures trading is offered to self-directed customers by TradeStation Securities, Inc., a broker-dealer registered with the Securities and Exchange Commission and a futures commission merchant licensed with the Commodity Futures Trading Commission). TradeStation Securities is a member of the Financial Industry Regulatory Authority, the National Futures Association, and a number of exchanges.
TradeStation Securities, Inc. and TradeStation Technologies, Inc. are each wholly owned subsidiaries of TradeStation Group, Inc., both operating, and providing products and services, under the TradeStation brand and trademark. When applying for, or purchasing, accounts, subscriptions, products and services, it is important that you know which company you will be dealing with. Visit www.TradeStation.com for further important information explaining what this means.

Life360(LIF)–Expanding Beyond Location into a Lifestyle PlatformCompany Snapshot:
Life360 NASDAQ:LIF is evolving from a location-sharing app into a comprehensive family safety and services platform, now integrating offerings across auto insurance, elderly care, and financial tools to deepen user engagement and drive revenue diversification.
Key Catalysts:
Feature Expansion & Tile Integration 🧩
The integration of Tile trackers and enhanced in-app features are significantly boosting platform utility, retention, and cross-selling opportunities.
International Momentum 🌍
International MAUs surged 46% YoY in 2024, with low market penetration pointing to substantial global upside as localization and partnerships scale.
Monetization Strength 💵
Ad and partnership revenue rose 41% YoY to $36M, reflecting the platform’s growing ability to monetize its large and highly engaged user base.
Investment Outlook:
Bullish Entry Zone: Above $55.00–$56.00
Upside Target: $85.00–$87.00, supported by product innovation, international expansion, and ad monetization gains.
📊 As Life360 transitions into a full-stack digital safety and services hub, it’s unlocking scalable growth across multiple verticals.
#Life360 #LIF #FamilyTech #LocationSharing #AutoInsurance #Fintech #ElderlyCare #UserGrowth #AdTech #TechStocks #GlobalExpansion

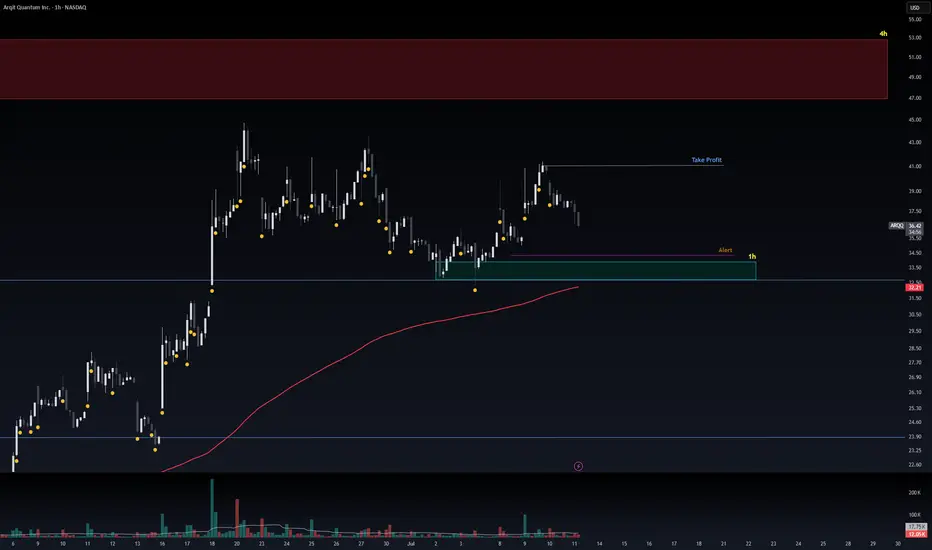
Safe Entry Zone ARQQGreen Zone is Safe Entry.
Stop loss below Green Zone (or blue line both are supports with 200MA below too).
Note: 1- Potentional of Strong Buying Zone:
We have two scenarios must happen at The Mentioned Zone:
Scenarios One: strong buying volume with reversal Candle.
Scenarios Two: Fake Break-Out of The Buying Zone.
Both indicate buyers stepping in strongly. NEVER Join in unless one showed up.
2- How to Buy Stock (safe way):
On 1H TF when Marubozu/Doji Candle show up which indicate strong buyers stepping-in.
Buy on 0.5 Fibo Level of the Marubozu/Doji Candle, because price will always and always re-test the

After 45% Profit On Last Trade, I Am Re-entering UMACTrading Family,
On our stock trades, using my new liquidity indicator, we have been solidly beating the market with a cool 15% profit since our first trade with it. If you had held the SPY from the same time, your profit would have been a more meager 6.5%. Our indicator is proving beneficial, to say the least. And the last time it gave me a buy signal on UMAC, we banked 45% in profit on my last exit. I then determined that if it did not give me a sell signal (it hasn't), I would look to re-enter at that 7.66 level. We have reached that level, and I have dipped my toes back in at 7.94. I would look to double up my position if we drop even further to that 6.44 level, but I don't know that we will. My target of 11.76 will give us another 48% profit on this trade, and I have a SL set at 6.18 for a nice 2.17 rrr.
Let's go!
Stew

WC: 23.59 Target: 1800-2400 MOASS: 47k-100K: PROFITI am a trader...I have one goal at the end of the day: MAKE A PROFIT
This will be my final post on Gamestop as I am now dedicating ALL of my time to Macro Market Coverage...
I FIRMLY believe that there is a high potential for markets to turn SIGNIFICANTLY LOWER over the next year and plan to show people how to trade a bear market profitably and not get absolutely wrecked
As part of my Macro Coverage I will be covering stocks that have high potential to run so I will be dropping updates on GME here and there as it runs
Ive posted every trading day (and the weekends) on Gamestop for well over a year
I was around for the original squeeze and I will be around if (no guarantees in markets as I always say) it squeezes again
Ok lets get to what you want to know:
20 Week Cycle has NOT been invalidated as far as im concerned
06/09 did see big changes but just havent seen the price improvement...yet
I think we see the price improvement start MIDDLE to END of Aug and will ramp up thru Sep/Oct
I have SPX dropping to 5100-5400 over the next couple months...that will most likely drag GME down a bit but expect 21.54 to be a solid place to position trades
If/When GME moves higher the FIBS ARE STILL YOUR GUIDE
Draw an Anchored VWAP from the 21.54 low...If GME breaks 21.54 draw another Anchored VWAP from wherever it bottoms...those two VWAPS will be the most powerful things you can put on your chart to track GME trend
TRADE WHAT YOU SEE...NOT WHAT YOU HOPE FOR
One last word on Roaring Kitty:
I do believe he is lurking and will be back...my guess as to when? Flip Mode 09/07
Histograms are not aligned yet and as you see price is choppy
From a 20 Week Cycle perspective it appears price will rise when it reaches the GREEN VERTICAL LINES
Still think this is the best interpretation ever laid out on what Roaring Kitty is doing..I obviously dont have it completely figured out though
Good Trading To You All!!!
P.S. the YEARLY VWAP is at 26....thats the likely LAUNCH point for price

TSLA, Long, 1D✅ TSLA has just broken out of a clear symmetrical triangle pattern, signaling a potential bullish continuation.
Yesterday’s daily candle was a white Marubozu, indicating strong buying pressure and clear dominance by the bulls.
LONG 📈
✅ Like and subscribe to never miss a new technical analysis! ✅

TSLA eyes on $294: Key Support for bulls to hold or face $253TSLA oscillating all over the place thanks to Musk moves.
Currently testing a key support zone $293.96-294.32.
Loss of this floor opens the Golden Genesis at $253.57
See "Related Publications" for previous charts ------------>>>>>>

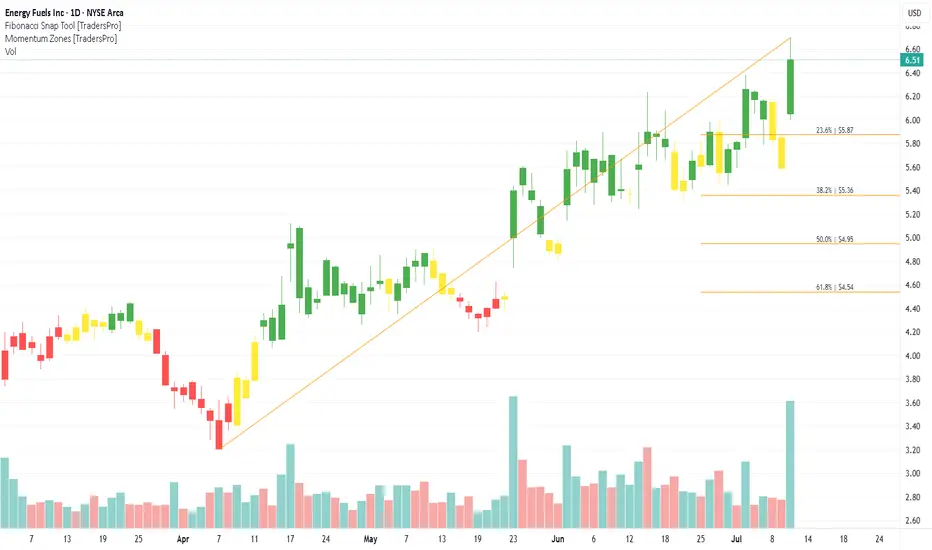
Energy Fuels Inc. (UUUU) Powers U.S. Nuclear Futurenergy Fuels Inc. (UUUU) is a leading U.S.-based producer of uranium and rare earth elements, critical materials for clean energy and national security. With operational sites in the western U.S., Energy Fuels supports nuclear energy production and the shift away from foreign dependency on rare earths. The company’s growth is driven by rising demand for clean nuclear power, rare earth supply concerns, and government support for domestic critical mineral production.
On the chart, a confirmation bar with increasing volume shows strong buying momentum. The price has entered the momentum zone by breaking above the .236 Fibonacci level. A trailing stop can be placed just below this level using the Fibonacci snap tool to protect gains while allowing for continued upside.
PHM (PulteGroup) – High-Probability Swing Trade Setup📈 Symbol: PHM (PulteGroup)
⏳ Timeframe: Daily Chart
⚡ Strategy: Swing Trade (2-4 Weeks)
🎯 Trade Setup
Entry Zone: $114.00 (Daily SMA 20 + Psychological Support)
Stop-Loss (SL): $104.80 (8% below entry, below SMA 50)
Take-Profit (TP): $133.10 (+16.7% upside, Historical Resistance)
Risk-Reward Ratio: 1:2.4 (Controlled Risk, High Reward)
📊 Technical Analysis
✅ Trend:
Strong Uptrend across all timeframes (Daily, 4H, 1H).
Higher highs & higher lows confirmed.
✅ Key Support Levels:
$114: Confluence of Daily SMA 20 + 38.2% Fibonacci retracement.
$110: Daily SMA 50 (Institutional accumulation zone).
✅ Indicators:
RSI (14): 69.51 (Neutral, no extreme overbought signal).
MACD: Bullish crossover + Positive histogram expansion.
Volume: Rising on bullish candles (Confirms buying interest).
Key Levels:
Resistance: $120 (Recent High), $133.10 (Final Target).
Strong Support: $104.80 (Technical SL level).
💰 Fundamental Backing
Strong Growth:
+Strong Growth in Net Income (+18.5% YoY).
Stable revenue in a resilient housing market.
Healthy Balance Sheet:
Minimal Debt (Score 10/10, Debt/Equity: 0.17).
Fair Valuation (P/E 8.13 – Undervalued vs. sector).
Catalyst: U.S. Housing Demand + Pro-Housing Policies.
⚡ Trade Execution Plan
1️⃣ Entry: $114.00 (Confirmed Technical Support Zone).
2️⃣ Stop-Loss: $104.80 (Protects against trend reversal).
3️⃣ Take-Profit: Scaled Exit –
TP1: $120.00 (Sell 50% to lock in profits).
TP2: $133.10 (Trailing stop to capture momentum).
4️⃣ Dynamic Management:
Move SL to $110 after reaching $120 (Secures gains).
📌 Why PHM?
Strong Sector: Housing market recovery with sustained demand.
High Liquidity: Avg. Volume ~2.5M shares (No slippage risk).
Technical + Fundamental Alignment:
Uptrend + Strong Fundamentals = High Probability Trade.
⚠️ Risk Management
Max Risk per Trade: 1-2% of capital.
Avoid Key Events: Interest rate reports (Check economic calendar).
🎯 Final Call: BUY PHM at $114, SL $104.80, TP $133.10.
🔔 Follow for More Swing Trade Setups!
👍 Like if You Find This Helpful!
#TradingView #Stocks #PHM #SwingTrading #RealEstate #TechnicalAnalysis
(Disclaimer: Not financial advice. Do your own research.)

ITS TIMEGME coiled on the 4hr RSI break 50 were launching from the POC area to 24.50 to next MA. Overall target after taking 26 is VAH around 27.58. The drop down was profit taking/ overextended /sell the news after all the hype leading into the btc purchase announcement they didn't disclose purchase price either from what I know. But btc is at ATH the 500M is now in decent profit and last quarter rev and earnings were good. Last time gme broke out was 17% on a overall stock market correction day, seems like thats going to be the case again for now im in the Aug 1 25 calls for .6 looking to close these in profit and roll to higher further out strike like the jan 26 35. cheers, here kitty kitty.

NFLX Bear Call Spread Near Max Profit – Watching 61.8% Fib Zone📉 I'm currently holding a Bear Call Spread 1300/1280 expiring on Jul 18. After multiple Breaks of Structure (BOS) and strong rejection from 1300, price is trending toward a key 1H demand zone near the 61.8% Fibonacci retracement (1242).
📊 Technical Context:
Bearish CHoCH + BOS confirms short-term trend reversal
Clear rejection from 1280–1300 supply
1242 = strong confluence: Fib + demand zone
🎯 Plan:
Hold the spread close to expiration for max profit
Close before earnings on Jul 17 to avoid volatility
If price shows strength at 1242, I may flip bias and look for a bull call spread post-earnings
🔔 TradingView Alerts:
1242: “Watch for bullish reaction at demand zone”
1278: “Rebound in progress – reassess post-earnings”
📌 This is a two-stage plan: secure gains on the short side, then prepare for potential upside.
➡️ Follow me for more structured trade ideas based on price action, options, and macro timing.

Tesla (TSLA) 1-hour chartTesla (TSLA) 1-hour chart im provided, here are the key bullish target points indicated by the chart analysis:
📈 Bullish Target Points (Upside Levels):
First Target Point:
🔹 Around $338.00 – $340.00
This level is marked as the initial breakout target, likely based on recent price structure and resistance zone.
Second Target Point (Extended Target):
🔹 Around $362.00 – $364.00
This is the higher target zone, representing a potential move if bullish momentum continues strongly. Likely aligning with a measured move or previous highs.
🧠 Context:
Price has broken out of a descending triangle/wedge pattern, a bullish signal.
It's also moving above the Ichimoku cloud, showing short-term bullish trend continuation.
Holding above the breakout level (around $305–$308) is critical to maintain upward momentum.
