Tesla (TSLA) 1-hour chartTesla (TSLA) 1-hour chart im provided, here are the key bullish target points indicated by the chart analysis:
📈 Bullish Target Points (Upside Levels):
First Target Point:
🔹 Around $338.00 – $340.00
This level is marked as the initial breakout target, likely based on recent price structure and resistance zone.
Second Target Point (Extended Target):
🔹 Around $362.00 – $364.00
This is the higher target zone, representing a potential move if bullish momentum continues strongly. Likely aligning with a measured move or previous highs.
🧠 Context:
Price has broken out of a descending triangle/wedge pattern, a bullish signal.
It's also moving above the Ichimoku cloud, showing short-term bullish trend continuation.
Holding above the breakout level (around $305–$308) is critical to maintain upward momentum.

AAPL: The Rally Might Not Be OverWhile many tech giants have already reached new all-time highs, Apple is still lagging behind — NASDAQ:AAPL hasn’t yet broken out. This may represent both a risk and an opportunity for latecomers.
Investor caution remains due to potential tariffs on Apple products from China, with the decision now postponed until August.
This uncertainty may be holding the price back, but could also lead to a strong accumulation phase if no negative headlines emerge in the near term.
Technicals:
• A breakout above $215 could open the way toward $249 (previous high).
• Support at $197 remains strong.
• Stochastic is in overbought, but MACD confirms bullish momentum.
NASDAQ:AAPL may start catching up with the broader market — especially if tariff fears subside. Watch closely for a confirmed breakout above $215.

$IONQ – Breakout Watch at $48 After Months of ConsolidationNYSE:IONQ has been basing since January, quietly marinating under the $48 level — and now we’re approaching the trigger zone. Technically, it’s a great setup. But context is everything.
🔹 The Setup
Multi-month base under $48 — a breakout above that level could release serious energy.
The structure is clean, and the volume profile is tightening — signs that something is brewing.
🔹 My Concerns (Let’s Keep It Real):
Price action has been weak — this stock hasn’t traded clean lately.
Late-cycle behavior: Even A+ setups have been failing lately — breakouts aren’t sticking like they should.
Market conditions matter: I need to see risk-on confirmation from NASDAQ:QQQ , AMEX:IWM , CRYPTOCAP:BTC , and crypto names before trusting this breakout.
🔹 My Trade Plan:
1️⃣ No Anticipation Here: Only trading this on A+ intraday setup — strong volume, clean trigger through $48.
2️⃣ Risk Control: Tight stop — can’t give it room in this tape.
3️⃣ Market Check: I want to see risk-on flows:
✅ NASDAQ:QQQ strong
✅ AMEX:IWM green
✅ CRYPTOCAP:BTC & crypto names moving
✅ Speculative names showing juice
Why I’m Watching It Anyway:
Long base = stored energy
If the market flips risk-on and NYSE:IONQ catches a bid, this could move fast
But patience is key — not every setup needs to be taken

Sometimes the market bring us amazing opportunitiesDollar Tree NASDAQ:DLTR is bringing us an historical buy opportunity.
The $60 zone has been a major support since 2016 and now we have tested it twice. When this happens there are 2 scenarios:
1. A very big rally demonstrating that this support level is still strong (+40% minimum opportunity) .
2. A fast break downwards facing a very bad situation and a continuation of the bearish situation.
How to Trade in this situation?
There is a simple strategy to handle the risk in this situation where a win is almost sure.
If you simply expect 100% of the position to return a 40%, you can be stuck here for a while and also lose your 5% as a Stop Loss.
Try this:
All positions have a 5% stop loss.
50% take profits at 5%
50% take profits at 40%
This way, with a very very high probability your 1st half will make enough money (5%) to cover the Stop of the live position.
So, you are in a risk free trade probably in just some days.
Worst case?
You keep losing a 5%!
Want more trades with great risk return?
Feel free to follow for daily trades! If you are still reading, thank you :)

Coinbase (COIN) Shares Reach All-Time HighCoinbase (COIN) Shares Reach All-Time High
According to the chart of Coinbase Global (COIN), the share price of the cryptocurrency exchange has reached a historical all-time high (closing price).
The bullish sentiment has been supported by the following factors:
→ Bitcoin price rally. Yesterday, we analysed the BTC/USD chart and anticipated that bulls might attempt to set a new record. Following the publication, Bitcoin made a strong upward move, breaking above the $118,000 level.
→ Passage of the GENIUS bill in the US , which establishes a regulatory framework for the use of stablecoins.
Can COIN stock continue to climb?
Technical Analysis of Coinbase (COIN) Share Price
At the end of June, our analysis of the COIN chart highlighted the following:
→ From a broader perspective, COIN’s price fluctuations over the past year had formed an ascending channel (marked in grey).
→ The ongoing intermediate rally (marked in blue) had the potential to drive the price towards the upper boundary of this grey channel.
This scenario has materialised: today, COIN shares are trading near the upper edge of the grey channel. However, several factors now warrant a bearish outlook:
→ The upper boundary of the channel may act as resistance;
→ The psychological level of $400 could also serve as resistance;
→ Shareholders may be tempted to lock in profits;
→ A potential bearish divergence on the RSI indicator.
It is possible that in the near term, COIN bulls will attempt to break through the $400 level. However, if buying momentum weakens, the conditions may favour a price correction — which would appear justified after a nearly 60% rally since early June.
This article represents the opinion of the Companies operating under the FXOpen brand only. It is not to be construed as an offer, solicitation, or recommendation with respect to products and services provided by the Companies operating under the FXOpen brand, nor is it to be considered financial advice.

Big Deal in RARE EARTHS space with MP! USAR, TMC, CRML next!Big deal with the DOD and MP yesterday. I am looking at some other plays here in sympathy. Neither had much action yesterday USAR, TMC, CRML but if we take out yesterdays intraday highs on these I think we could play some catch up!
Lets dig into the levels im watching and the overall setups on these! Metals stocks are not always the best stocks to trade they can fart around a lot intraday vs tech stocks so be careful with your entries and make sure the volume is there!

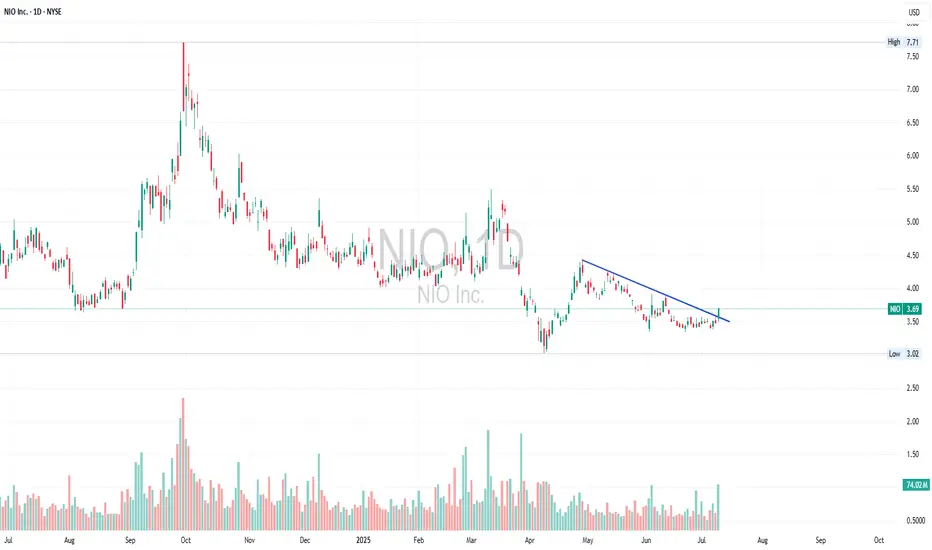
NIO INC ADR - Short Range Trend Line Breakout - Morgan StanleyNIO INC ADR - Short Range Trend Line Breakout - Morgan Stanley Overweight Rating reiterated with a prive Target of 5.80 USD with L90 ONVO about to Launch on Aug 1st. Will it continue the upside momentum or fade, fingers crossed..
EIX is presenting a fantastic second chance for traders. 🔴 EIX is presenting a fantastic second chance for traders.
A new opportunity has appeared on the NYSE:EIX chart. A few days ago, we had the breakout of a double top, which has already set a risk-free trade in motion. Now, it offers a chance for those who missed out to enter a new trade by taking advantage of a pull-back.
The last pull-back offered by EIX in July 2024 generated over a 20% return in 2 months, so we shouldn't overlook the pullbacks of this stock.
✅ What pattern is unfolding in EIX?
NYSE:EIX has created a technically perfect double top pattern. We have two identical highs, and it has just broken the support line at the same time as the 2024 upward trendline was broken.
It seems we are entering an interesting bearish phase for traders.
💰 How to trade this chart pattern?
A double top chart pattern is typically traded by selling when the support line is first broken.
In this case, a pullback is occurring to the support line, making it an interesting area to sell again.
By doing this, you can set the Stop Loss at a 1.5% risk and the take profits at 6% or 10%.
🛡️ The risk management strategy
As we have done in so many previous ideas, remember you can split the position in 2.
- 50% of the position in a take profits, at least, as large as your stop loss (adapt SL and this 1st TP to local supports/resistance levels). In this case, a 3% TP for 1,5% SL (see the chart).
- 50% of the position to a price as large as the previous pattern, which would mean a profit of 10%.
You can also use the 6% Take profits or even split the Take profits in two, searching for 6 and 10% profits.
✴️ ENJOY AND FOLLOW for more 😊

NYSE:DT (Dynatrace) local stop on its way to 60$+Since April 2025, Dynatrace has established a local uptrend. Based on the daily chart, the recent drop below $53 appears to have fulfilled one of the likely targets for wave iv. This may represent wave iv of a five-wave impulse originating from the April low. If correct, wave v is expected to push above the high of wave iii.
There are two potential trade setups:
Trade 1: Entry at the current price (~$53.00), with a stop-loss at $52.34.
Trade 2: Entry at $51.54, with a final stop-loss at $48.89. This entry level is supported by a price gap and Fibonacci retracement zone, making it technically stronger.
In both cases, the initial target is $57.55. A potential resistance zone lies above $60.70, based on prior selling activity.

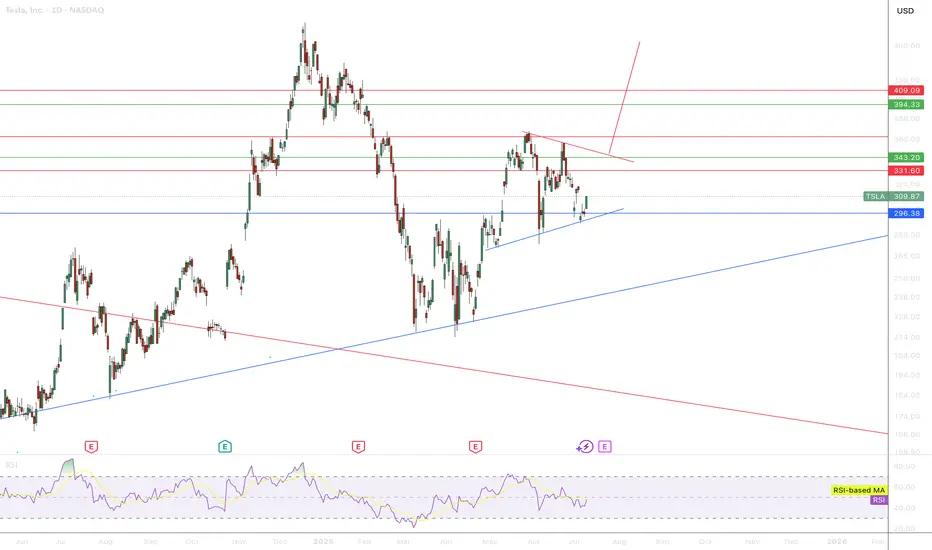
Triangle Pattern in TSLALooking at 4H-1D Chart, there is a triangle pattern emerging which may target 400 area. Good luck.
Can Strategic Minerals Transform National Security?MP Materials has experienced a significant market revaluation, with its stock surging over 50% following a pivotal public-private partnership with the U.S. Department of Defense (DoD). This multi-billion-dollar agreement, which includes a $400 million equity investment, substantial additional funding, and a $150 million loan, aims to rapidly establish a robust, end-to-end U.S. rare earth magnet supply chain. This strategic collaboration is designed to curtail the nation's reliance on foreign sources for these critical materials, which are indispensable for advanced technology systems across both defense and commercial applications, from F-35 fighter jets to electric vehicles.
The partnership underscores a profound geopolitical imperative: countering China's near-monopoly over the global rare earth supply chain. China dominates rare earth mining, refining, and magnet production, a leverage it has demonstrably used through export restrictions amidst escalating trade tensions with the U.S. These actions highlighted acute U.S. vulnerabilities and the imperative for domestic independence, propelling the DoD's "mine to magnet" strategy aimed at achieving self-sufficiency by 2027. The DoD's substantial investment and its new position as MP Materials' largest shareholder signal a decisive shift in U.S. industrial policy, directly challenging China's influence and asserting economic sovereignty in a vital sector.
Central to the deal's financial attractiveness and long-term stability is a 10-year price floor of $110 per kilogram for key rare earths, significantly higher than historical averages. This guarantee not only ensures MP Materials' profitability, even against potential market manipulation, but also de-risks its ambitious expansion plans, including new magnet manufacturing facilities expected to produce 10,000 metric tons annually. This comprehensive financial and demand certainty transforms MP Materials from a commodity producer vulnerable to market whims into a strategic national asset, attracting further private investment and setting a powerful precedent for securing other critical mineral supply chains in the Western Hemisphere.

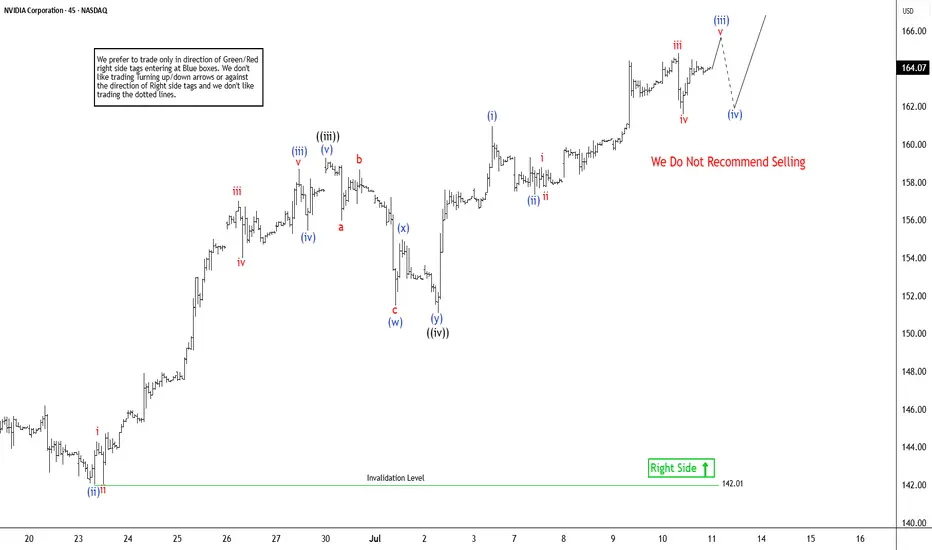
NVIDIA ($NVDA) Elliott Wave Outlook: Larger Pullback on the HoriNvidia (NVDA) continues its remarkable ascent, consistently reaching new all-time highs and reinforcing a robust bullish outlook. The ongoing rally, which began from a significant low on April 7, 2025, remains structured as an impulsive wave pattern, indicative of strong upward momentum. However, despite the potential for further short-term gains, the cycle appears mature. This suggests a larger-degree pullback could be imminent. Investors should exercise caution when considering chasing this rally in shorter time frames, as the risk of a corrective move grows.
In the short term, the cycle initiated from the June 2 low is progressing as a lower-degree impulse. From this low, wave ((i)) peaked at $144, followed by a corrective pullback in wave ((ii)) that concluded at $137.88. The stock then surged in wave ((iii)) to $159.42. The subsequent wave ((iv)) correction unfolded as a double-three structure, with wave (w) ending at $151.49, wave (x) at $154.98, and wave (y) completing at $151.10, finalizing wave ((iv)). Currently, Nvidia is advancing in wave ((v)), exhibiting a five-wave subdivision. Within this, wave (i) of ((v)) reached $160.98, with a minor pullback in wave (ii) concluding at $157.34. As long as the pivotal low at $142.01 holds, any near-term pullbacks are likely to attract buyers in a 3, 7, or 11-swing pattern, supporting further upside potential. This technical setup underscores Nvidia’s strength but highlights the need for prudent risk management.
LUNR: It's time to run!LUNR: It's time to run!
Wait n see!
"The market offers endless opportunities, but your capital is limited — safeguard it wisely."
.
US STOCKS- WALL STREET DREAM- LET'S THE MARKET SPEAK!

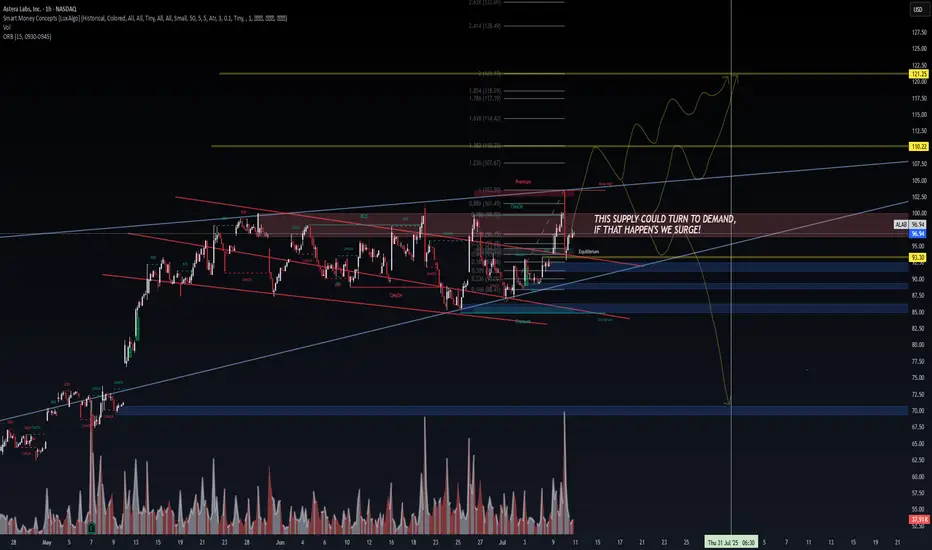
ALAB | Smart Money Compression → Breakout Threat🔭 ALAB | Smart Money Compression → Breakout Threat
Posted by: VolanX Quant Systems | July 10, 2025
We're at a critical inflection point on $ALAB.
The previous supply zone (highlighted in red) is under pressure — one more CHoCH + BOS and it may flip to DEMAND. If that happens, we don’t trickle...
We surge.
🧠 VolanX DSS Notes:
SMC Structure: Multiple CHoCHs + recent BOS confirm internal strength
Volume spike confirms interest at this price level
0.886 Fib rejection zone tagged @ ~$101.49
Equilibrium sits near $95 — ideal backtest zone
Bullish path = target range $110.22 → $122.50
Bearish scenario only resumes below $93.30, where supply holds and volume fades
“This supply could turn to demand — if that happens, we surge!”
🛠️ Risk Layering:
Entry: $96.50–$97.00
Risk: Close below $93.30 invalidates thesis
Reward: Multi-leg rally toward golden pocket + extended fibs
📉 If demand fails to hold, expect retracement into deep discount zones between $72–$77.
🧬 LSTM-backed directional bias: UP (70% confidence)
📊 Options flow is light but positive risk sentiment observed
#SmartMoneyConcepts #ALAB #VolanX #OrderBlock #CHoCH #BreakOfStructure #QuantTrading #SupplyDemand #FibonacciLevels #LSTM #LiquidityZones #WaveAnalysis #TradingView #InstitutionalFlow #DSS
Stablecoins, a huge piece of cake to be distributedThe core of stablecoins lies in payment and opening up channels for sovereign currencies to communicate with the US dollar. In other words, whoever can gain an advantage in the field of payment and exchange in the future will be the biggest winner.
CIRCLE has the advantage of first-mover speculation, which is why NYSE:CRCL can soar 300%+ in the secondary market, but the current profit model of USDC is basically only the US dollar interest. In the future, the income will shrink significantly after the Fed cuts interest rates. The market will start to think after calming down.
Market transactions are always based on expectations, not the present. Can USDC dominate the world in the future? I don’t think so. The first obstacle is USDT, which goes without saying. Second, as the entrance to traffic, Binance and TRX have already stood on the side of Trump’s family’s USD1. Grabbing the market through political power is at least very effective during Trump’s term. Third, many sovereign countries around the world are also issuing stablecoins anchored to the US dollar. It is unknown who will win.
If it is short-term speculation, then any target can be traded. For value investment, CRCL faces many challenges and needs to take one step at a time. Heavy gambling is not my trading style.
I will add more views on stablecoins later.

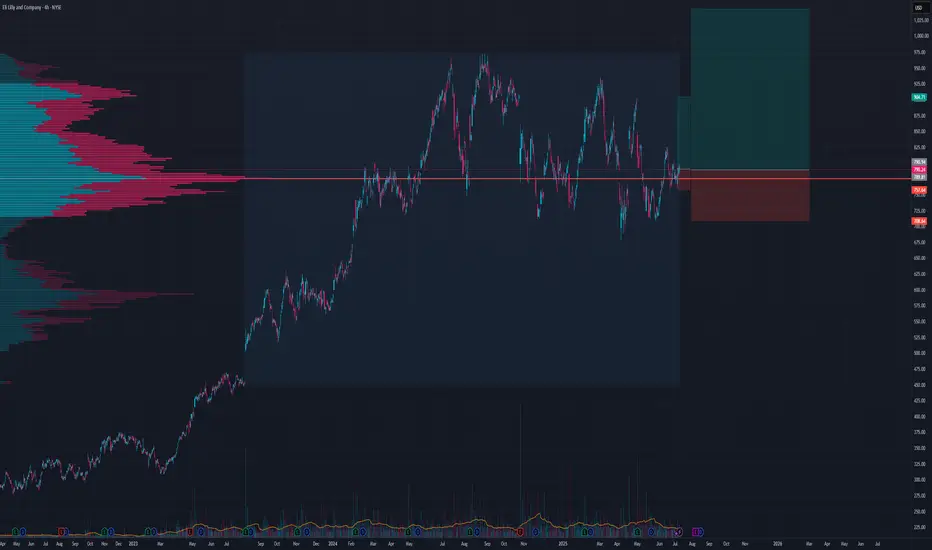
Long Healthcare and BiotechI think we will go for all time highs soon
TP 1 over 900
Got 2 stop losses on chart depending on time horizon and risk apatite
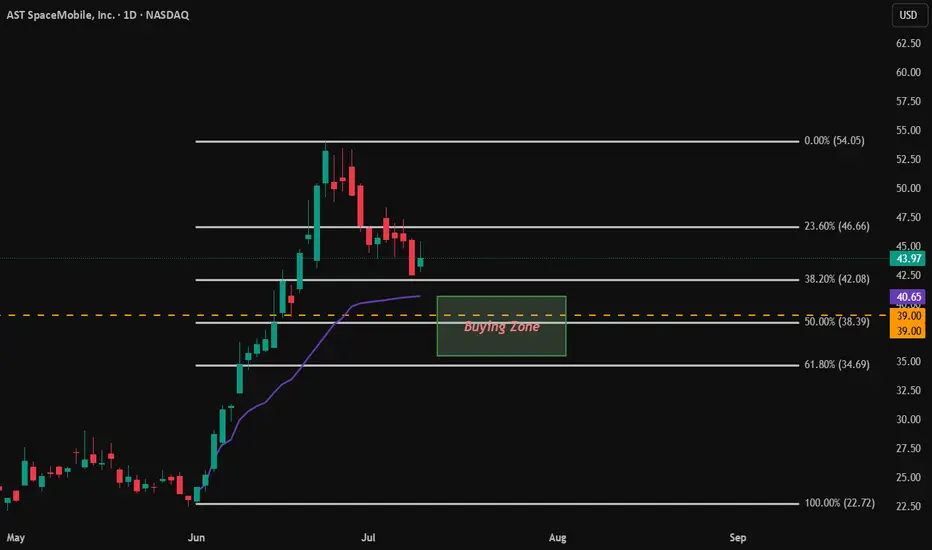
$ASTS Buying the dip. [Long]
Previous bull runs with 50.0% - 61.8% retracements each time.
Stock is still overvalued.
RSI on weekly and monthly confirm this.
50 SMA is still above 200 SMA, and better retracement will be healthy for a stronger bull run continuation.
Buying Zone: $35.50 - $40.65.
Key Levels and points of interest.
Wave 2 completion at 50%-61.8% retracement. This would place Wave 3 around a target range of $85 or higher.
$55-$57 range is around 45% increase from Wave 2 retracement. This happened during the second run and form a H&S pattern. We want our next run up to pass this $55-57 level.
This isn't intended for financial advice, merely personal analysis.
$JD | Potential long setupPotential reversal at the .618
If we just K.I.S.S. we might just get lucky.. at least that’s the idea! Right..??
Trade idea:
Potential long scenario playing out that is worth the shot for me, with proper risk management of course. For discussion purposes this is a very small trade in my portfolio, <1/2% of overall portfolio..
Trade:
I have drawn a Fibonacci from the wick low of ~$20.87 to the wick high of ~$46.81 on the monthly candle chart and you can see that the price is currently trading at the .618 fib. I have taken a trade at this level in anticipation of a reversal, which may or may not occur. There are tons of trades out there like the one I have mentioned, you don’t have to be right all of the time or even a majority of the time, you just have to know how to manage risk and take losses/profits at the right time.
Trade parameters:
Buy at the .618 fib or current market price: $31.22
Risk/Reward: 1:7.31🤑
(Risk 14% for potential 108%)
SL @ next fib zone .786: $26.69
For profit zones I have ran a fib from the top @ $108.44 to the bottom at $20.87 and will be using the fib zones as TP zones. The 3 different zones are listed below:
TP1: .236 fib @ ~$41.33 (~32%)
TP2: .382 fib @ ~$54.16 (~73%)
TP3: .50 fib @ ~$64.43 (~106%)
Estimated time frame for all 3 targets to be hit: 1-3 years
It is best to come up with a strategy before hand as to how much you plan to take at each level. For me, I plan on selling 1/4 at the first zone, 1/2 of what’s remaining at the next zone and then the rest at the final zone (may let a share or 2 ride for fun). Whether or not any of these zones are hit is obviously all up to the stock and whether it cooperates with my thesis! I chose to post this trade because I like the risk/reward opportunity here. If anyone has any opinions, would love to hear them!
Thanks and HaPpY tRaDiNg!
NOT FINANCIAL ADVICE!!!

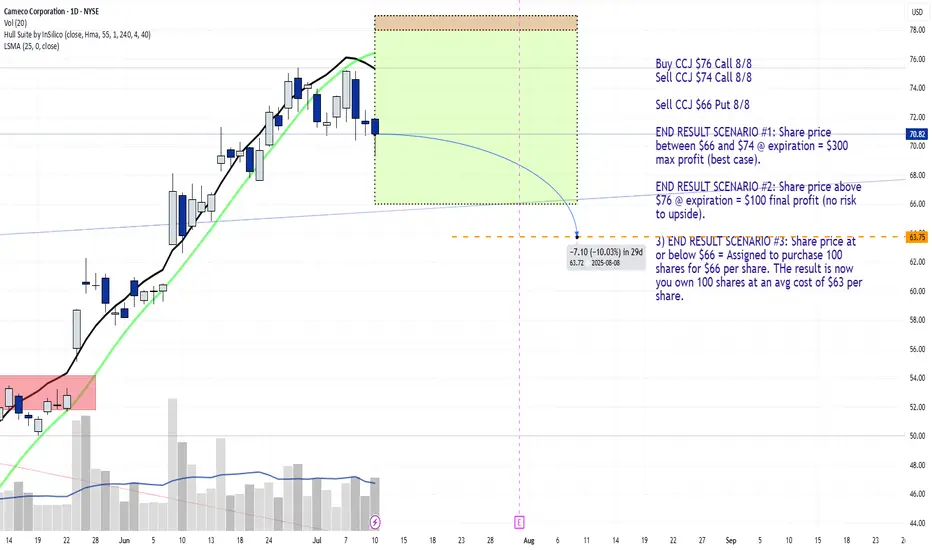
JADE LIZARD TRADE for 8/8 ExpirationNYSE:CCJ JL
Buy CCJ $76 Call 8/8
Sell CCJ $74 Call 8/8
Sell CCJ $66 Put 8/8
END RESULT SCENARIO #1: Share price between $66 and $74 @ expiration = $300 max profit (best case scenario).
END RESULT SCENARIO #2: Share price above $76 @ expiration = $100 final profit (no risk to upside).
3) END RESULT SCENARIO #3: Share price at or below $66 = Assigned to purchase 100 shares for $66 per share. THe result is now you own 100 shares at an avg cost of $63 per share.
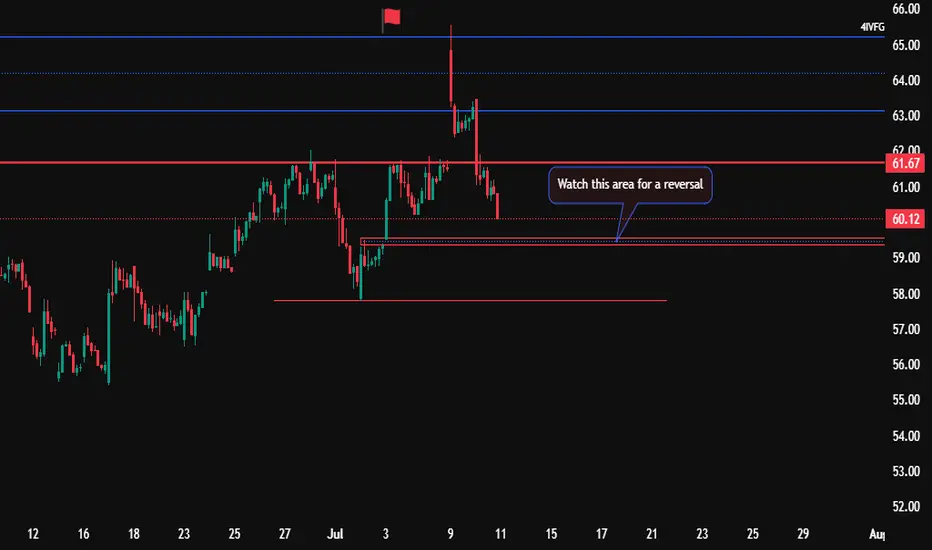
DOCS Potential ReversalWatching DOCS finally broke through 61 ish, coming back to fill the gap around 59.50.
Once it gets there and it will. Be waiting on my reversal pattern on lower time frame. Take 1-1 on the lower tfs. See if it breaks above or wants to go lower. Tight SLS until reversal confirmed on the 15. Take your 1-1s, get paid.
Oxford Industries | OXM | Long at $38.10Oxford Industries NYSE:OXM is an apparel company that designs, sources, markets, and distributes lifestyle brands like Tommy Bahama, Lilly Pulitzer, and Southern Tide. While I am not super bullish on the retail sector given the blaring recession signals, I also don't think this is the end of life as we know it... the anticipated downside is already priced-in for many retail brands.
From a technical analysis perspective, NYSE:OXM has entered my "crash" simple moving average zone. Typically, but not always, this is an area where value investors accumulate shares in anticipation of a future rise in share price. While the price is likely to dip near $28-$30 in the near-term, the last open price gap on the daily chart since the COVID-19 pandemic was closed today. Also, last week, an NYSE:OXM Officer and the CEO bought just over $600,000 in shares near $40 and the stock is currently trading at book value.
Fundamentals:
P/E = 7.4x (apparel sector average = 22.4x)
Forward P/E = 11.4x
Dividend = 7.25%
Debt-to-equity = .2x (healthy)
Regardless of some strong fundamentals, persistent macro volatility, consumer caution, and tariff pressures may delay recovery. Analysts expect flat to declining sales in 2025, with limited organic growth. Like I mentioned above, while there is likely short-term pain here, the fundamentals are there to potentially weather the storm.
Thus, at $38.10, NYSE:OXM is in a personal buy zone with the further decline between $28-$30 likely (where additional share accumulation will occur as long as the fundamentals do not change).
Targets into 2027
$45.00 (+18.0%)
$50.00 (+31.2%)

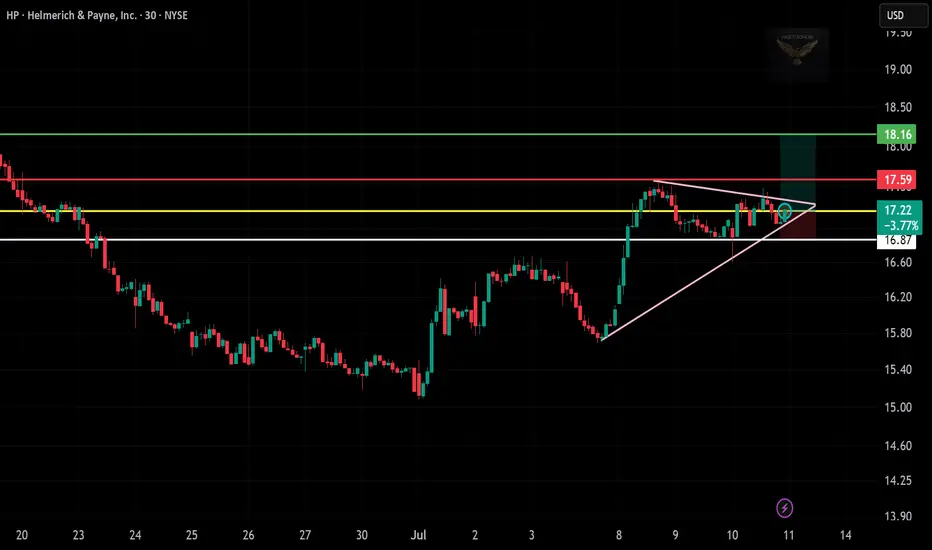
HP Trade Update – July 11, 2025🟢
HP has broken out of a tight symmetrical triangle after consolidating for nearly two days.
📍 Entry activated at $17.22, as price pushed above wedge resistance with bullish confirmation.
🎯 Targets are clear: $17.59 (first zone), $18.16 (extended level).
🛡️ Stop-loss positioned below $16.87 to protect the structure.
Volume is still building, but trendline support remains intact — a solid setup for breakout continuation. Watching closely for follow-through and buyer strength into next session.
🔍 Strategy: Symmetrical Triangle Breakout
📊 Sentiment: Bullish & Active
🗓️ Trade live — price holding breakout level.
COIN Trade Update – July 11, 2025🚀
COIN is climbing with strength, pushing higher inside a rising wedge formation.
Price action is tight but bullish — buyers defending trendline support beautifully.
📍 Entry activated at $388.97 after confirmation near wedge resistance.
🎯 Targets locked in: $393.55 and $399.60
🛡️ Risk managed with stop below $383.00 — structure still intact.
This is a classic breakout anticipation setup with momentum building. Watching closely for volume surge and resistance break. Trade active — bias remains bullish.
🔍 Strategy: Rising Wedge + Breakout Continuation
📊 Sentiment: Bullish Cautious
📅 Holding through the session — price near key breakout level.
