ALAB: High-Quality Breakout With Strong Structure and 3.2 R/RAstera Labs ( NASDAQ:ALAB ) just delivered a clean technical breakout above multi-week resistance, paired with bullish confirmation from momentum and Ichimoku structure. This isn’t a hype trade — this is what a textbook continuation breakout looks like.
📊 Key Technical Breakdown
Base Breakout
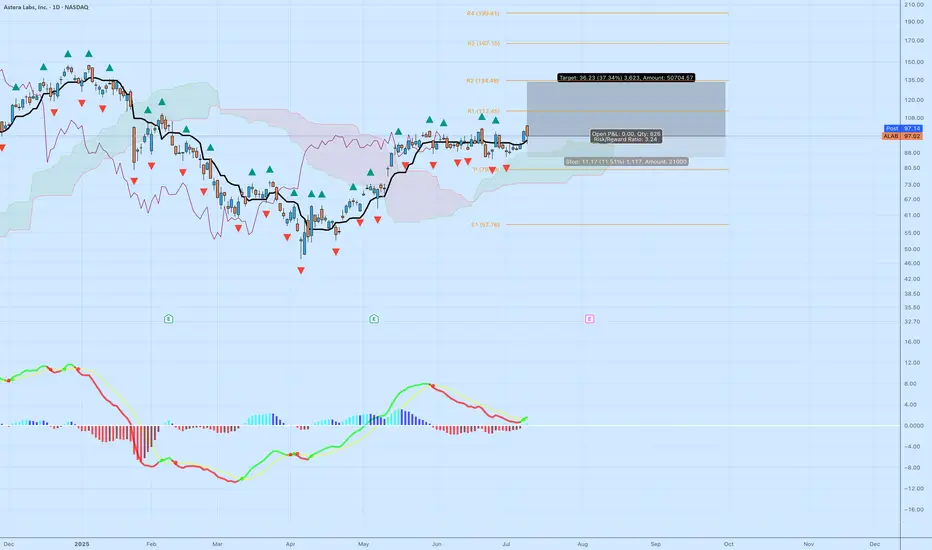
After weeks of tight consolidation, NASDAQ:ALAB just broke above horizontal resistance at ~$95. The breakout candle is strong, with above-average range and a decisive close.
Ichimoku Cloud
Price is well above the cloud — this confirms bullish trend.
The Kijun (black line) is sloping upward, and the cloud is thick and rising.
Pullbacks toward $88–90 could act as support if the breakout retests.
MACD Reversal
The MACD has flipped green, signaling a momentum shift.
Histogram is expanding upward again, showing renewed buying pressure.
This is happening as price reclaims the top of the recent range — a great alignment.
🎯 Trade Specs
Entry: $97.02
Target: $133.25 (+37.34%)
Stop: $85.32 (–11.51%)
Risk/Reward: 3.24 — solid skew for a growth name
Context: Strong prior trend, healthy consolidation, and now continuation. This isn’t a bottom-pick — it’s trend-following at a breakout moment.
🧠 Why This Trade Works
Structure: You’re not chasing green candles. This breakout comes after a long base and clears prior congestion.
Asymmetry: A 3.2+ R/R setup means you can be wrong more than half the time and still come out ahead — if you stick to your stops.
Momentum Alignment: Momentum and price are moving together — never fade a breakout with confirmation from both price action and indicators.
📌 Tip for Readers:
If you’re new to swing trading, study how this base formed and what conditions led to the breakout. The goal isn’t prediction — it’s positioning at the right moments with risk defined.
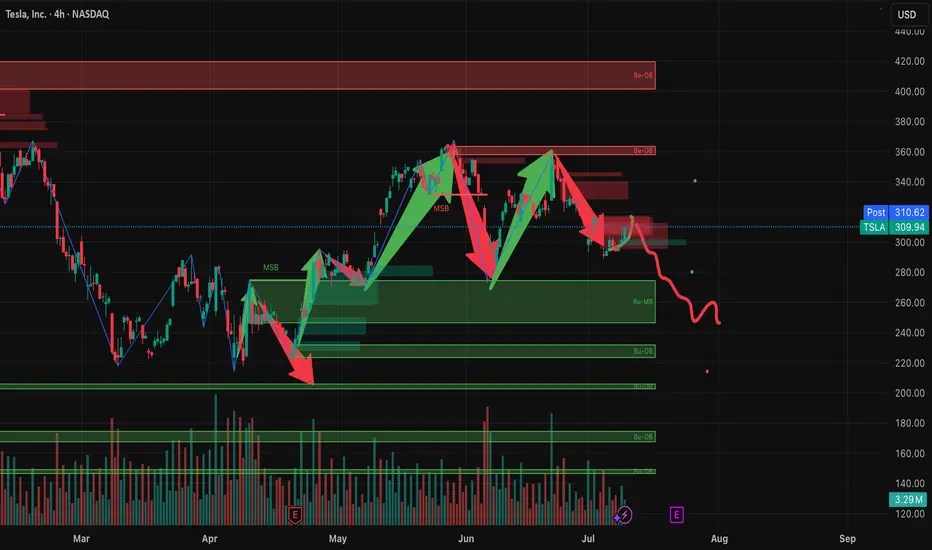
Tesla Flashes Bullish Reversal: Engulfing Candle and Volume PoinLet’s reassess TSLA now that we have this new candle (a big move +4.73%) in context. This changes things substantially, so I’ll reapply candlestick techniques, assess trend health, box positioning, and momentum.
Candlestick Analysis
The new candle:
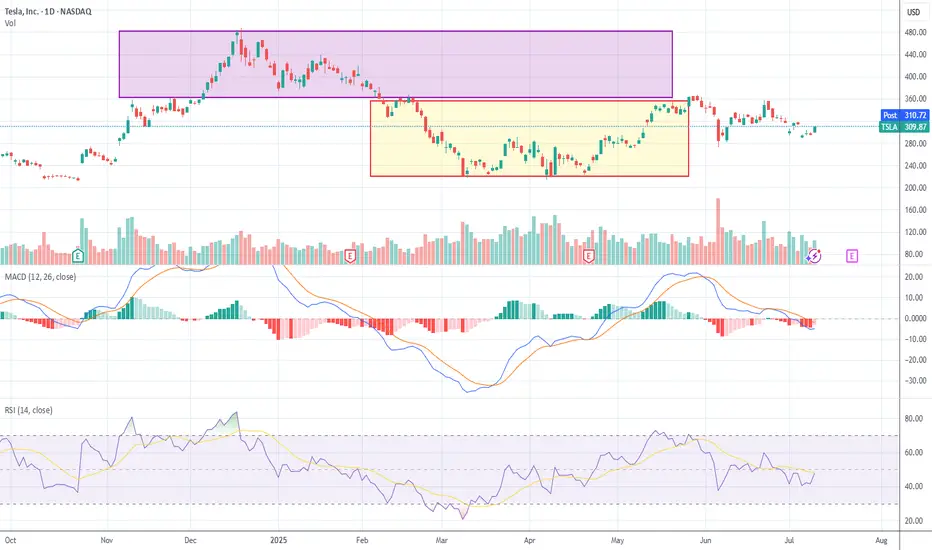
Large white body (+4.7%) closing at $309.87. Engulfing prior 2 candles’ real bodies → this is a Bullish Engulfing Pattern. Occurs near the 50% retracement ($290) zone (previous support). Volume expanded vs prior days → adds validity. Bullish engulfing after a down leg is an early reversal signal.
Context:
This happens after weeks of indecision candles (spinning tops / dojis) → classic “coiling” behavior before expansion.
Trend Health & Momentum
MACD: Still below zero but histogram bars turning less negative → momentum starting to shift.
RSI: Up to ~47.6, breaking out of its down channel. A move >50 would confirm momentum pivot.
Box Dynamics
TSLA just punched through the upper edge of Box 2 ($300) with conviction.
Now entering “no man’s land” between Box 2 ($300–$360) and Box 1 ($360–$465).
For a sustained breakout it must close above $306–310 range for 2-3 days. Ideally see follow-through with a test of $328 (78.6% Fib).
Tactical Breakdown
✅ Breakout case (higher probability now):
Bullish Engulfing + volume expansion at support zone.
Closing above $306-310 increases odds of a run toward $328 (78.6%) and possibly $360.
❌ Reversal back down (lower probability):
Only if TSLA immediately rejects $310 and falls back below $300 in the next 1–2 sessions.
This price action looks like accumulation showing its hand. Large white candle suggests buyers absorbing supply at prior resistance.
Breakout above $306 confirmed if follow-through continues. Odds for a reversal lower just dropped sharply after today’s engulfing.
Long 4HR AND Weekly ( Finishing Wave 1)
4HR
NASDAQ:AMD is close to potentially finishing Wave 5 of a larger degree wave 1.
$154 is the calculate Fib extension of Wave 1+3 for a wave 5 however, there is plenty room for the stock to run with multiple $160+ Analyst upgrades.
From the Close Price on 6/27 to $160 there is a potential 11% upside.
I believe any negative sentiment on trade with Canada will dissipate sooner than later as we seen throughout the entirety of the year so far with all trade talks failing to hold the markets down.
WEEKLY
The MACD has finally finished above the neutral zone increasing bullish sentiment and strength on this one moving forward as this is a bullish signal.
On both time frames this is a very clear breakout against the Multi year Resistance channel from its previous ATH with price against within the channel showing tons of strength in momentum.
A further outlook for this stock shows a possible wave 3 on the weekly chart targeting the upper trendline at over $300.
If you feel you missed the opportunity to get a long term position, there is always a second chance on on micro wave 2. That would give you retracements down to $100, $110, and $120. I'm rounding up the Fib levels for simplicity.
I currently hold 100 shares at an average of $118 and look to add more beneath my average.
I also am holding multiple contracts with a $140 strike out until the end of July and $160 strike out until September. I do not plan on trimming any contracts until the $150 stock price.
Use this information for educational purposes only as this is not financial advice.

LONG 4HR Wave Count Possibilities
Using the Weekly time frame, Wave 1+3 of a larger degree shows a possible extension to the 1.68 extension which is a common wave 5 of a larger degree target . That Price Target being $26.35.
In April of this year the price reacted to a Reversal Pivot Point but failed to form a proper impulse for wave 1. Price then gapped above the price resistance line for the year of 2025 and the 100 WMA.
As of now, price is expect to target $19.43 in a move to finish out wave 3 of a macro degree. Wave 4 typically retracing to the 0.236 or 0.382 level has been displayed to align with the current uptrend trendline.
I have also displayed the possible points of interest for Fib levels for an approach to finish out wave 5 of a macro degree. I expect Price to stall and face resistance in the golden pocket extension of the Fib levels.
None of this is financial advise and strictly for educational purpouses.

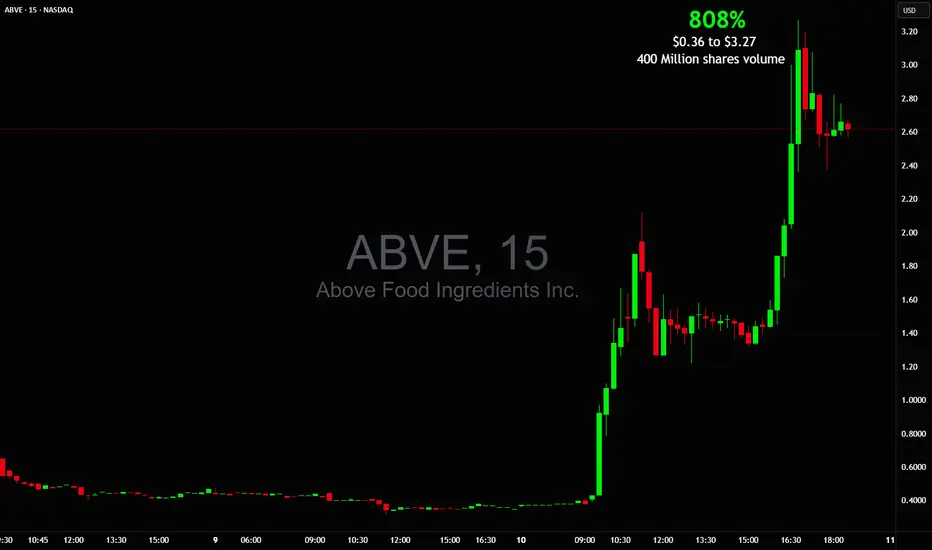
WOW! 808% in 1 day $0.36 to $3.27 on BIG 400M+ shares tradedMentioned it in chat several times with breakout prices
It traded more shares than NASDAQ:NVDA NASDAQ:TSLA NASDAQ:AAPL and NASDAQ:AMZN combined!
NASDAQ:ABVE picture perfect after hours squeeze
NBIS Bullish Technicals.
NBIS Fundamentals.
1. Massive Growth – The stock’s up a jaw-dropping 138% in just 3 months!
2. YTD Beast Mode – Up 81.6% so far in 2025.
3. Momentum Heating Up – Gained 36.9% over the last month alone.
4. Super Low Debt – Debt-to-equity at just 0.06 — strong balance sheet!
5. Sitting on Cash – Over $6.42/share in cash with a killer 9.59 quick ratio.
6. Insider Confidence – 20.71% insider ownership, they believe in what they’re building.
7. EPS Looking Strong – Projected +41.91% EPS growth next year.
8. Big Money Watching – 33.26% institutional ownership, eyes are on this.
9. Revenue Turnaround – Insane 381% sales growth QoQ, the shift is real.
10 Wall Street Thumbs Up – Consensus Buy rating, score of 1.25.
NBIS Technicals:
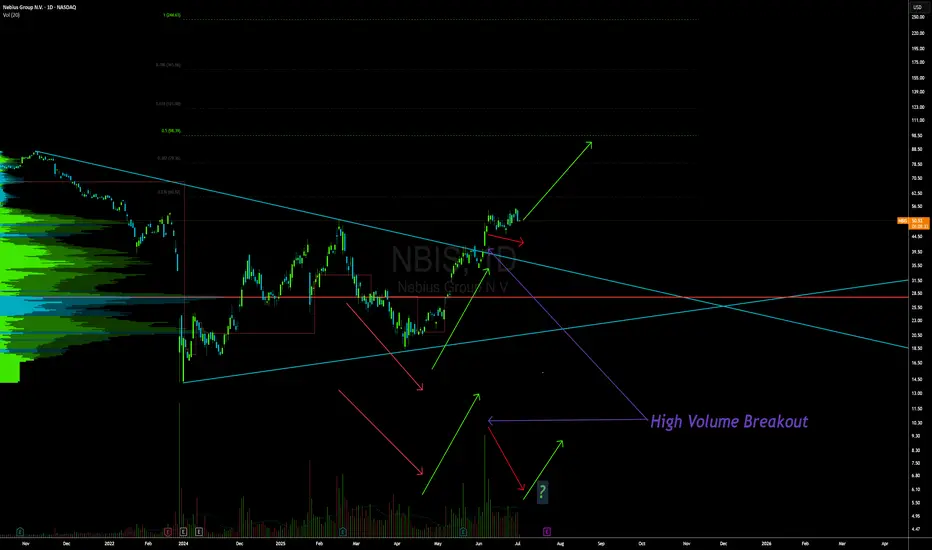
1. High-Volume Breakout spotted on the weekly chart — clear signal buyers are stepping in.
2. Broke out of long-term downtrend resistance with authority. Consolidating on low volume.
3. Price holding above key EMAs — bullish structure intact.
4. Fib targets in sight with potential room to stretch toward $90-$120+.
5. Volume expansion confirms real accumulation happening.
Watching for continued strength as this beast tries to reclaim lost ground and ride that momentum wave. With fundamentals this solid and technicals aligning.
JPMorgan Chase Wave Analysis – 10 July 2025- JPMorgan Chase reversed from support zone
- Likely to rise to resistance level 296.00
JPMorgan Chase recently reversed up from the support zone between the support level 280.00 (former multi-month high from January), support trendline of the daily up channel from April and the 38.2 Fibonacci correction of the upward impulse 1 from May.
The upward reversal from this support zone continues the active intermediate impulse wave (5) from the end of May.
Given the clear daily uptrend, JPMorgan Chase can be expected to rise to the next resistance level 296.00 (top of the previous impulse wave 1).

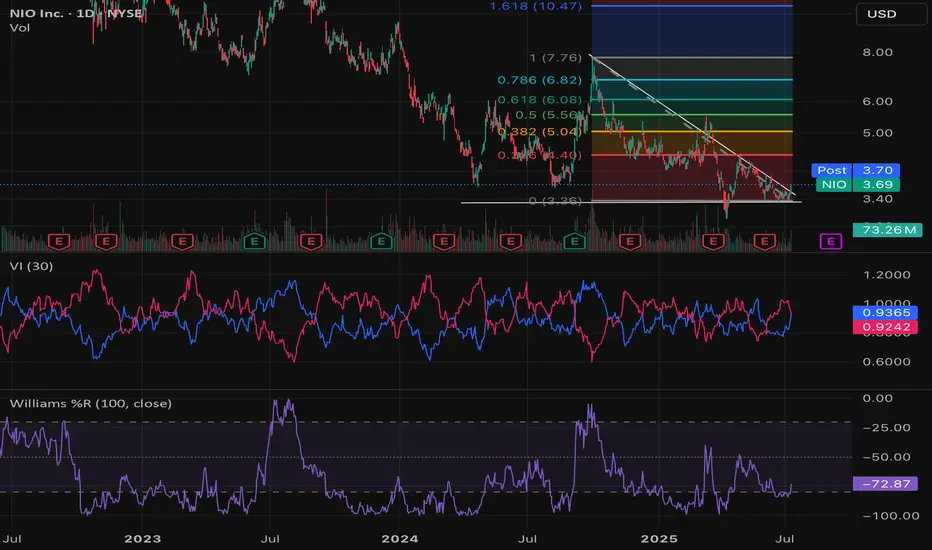
$NIO Breakout play- NYSE:NIO breakout play.
- I have marked the potential levels.
- NYSE:NIO moon time!
TSLA racing to break thru resistancearea 1: 340
area 2: 360
will be tuned into earnings to see if the jig is jiggin July 23rd.
Elon is busy. so let's see what's the dealio.
****280 is a key level
**300 needs to hold for these attempts

UNH... a double bottom would be niceso it doesn't have to happen, but I would love to see a double bottom around 245-250. it's just a technical idea that would give "ok we are ready to head back to 400." neckline would be 320-325.
watching and puts below 295. or rejects against 300.

Natural Gas - The Epic Reversal? Natural gas had an astonishing move to the upside. Closing up over 5% today.
This volatility can make all tarders head spin if youre not used to it.
Why did Nat gas pop today?
Partly from being oversold and into really good technical support, Natural gas inventories were released today at 10:30am.
The inventories showed a smaller build than the market expected which implies stronger demand. 56B consensus vs 53B actual.
This could potentially be the start to a new bullish trend.
Names like EQT & AR hit some major support today. Some call options on these names have been accumulated.


Will Boeing experience a price drop with China buying Airbus?My experience in simulating the price from price growth to the diamond ceiling drawn in the Boeing analysis, I think we should expect the price to grow to the $224 price range in the short term!
Good luck!
MJ.REZAEI

Why TSLA will Crash based On Copper TarrifsHere’s why that bearish outlook is gaining traction:
Copper costs are surging: Tesla uses over 180 pounds of copper per vehicle. With prices spiking 13% in a single day and a 50% tariff looming, production costs are rising fast.
Analysts are cutting price targets: UBS, JPMorgan, and Bank of America have all lowered their forecasts for Tesla, citing margin pressure and weakening demand3.
Brand sentiment is shaky: Tesla’s recent delivery miss and political controversies around Elon Musk have added to investor unease.
Tariff ripple effects: The broader trade war is expected to disrupt supply chains and inflate costs across the EV sector5.
That said, some analysts still see long-term upside if Tesla can pivot quickly—especially with its AI and autonomous driving ambitions. But for now, the market is reacting to the immediate risks.
Overall Enter Short for Gains of 3-5 percent.
More Upside in Wheaton Precious Metals? Wheaton Precious Metals has consolidated for more than a month, and some traders may think it’s poised to continue higher.
The first pattern on today’s chart is the April 21 high of $87.42. The silver company stayed below that level through June 2. It then shot above it and held the same price over the following month. That could suggest old resistance has become new support.
Second, WPM appears to have broken a falling trendline.
Third, the 8-day exponential moving average (EMA) has stayed above the 21-day EMA. That may reflect a bullish short-term trend.
Finally, Bollinger Band Width in the lower study highlights tighter movement. Will that price compression give way to price expansion?
Check out TradingView's The Leap competition sponsored by TradeStation.
TradeStation has, for decades, advanced the trading industry, providing access to stocks, options and futures. If you're born to trade, we could be for you. See our Overview for more.
Past performance, whether actual or indicated by historical tests of strategies, is no guarantee of future performance or success. There is a possibility that you may sustain a loss equal to or greater than your entire investment regardless of which asset class you trade (equities, options or futures); therefore, you should not invest or risk money that you cannot afford to lose. Online trading is not suitable for all investors. View the document titled Characteristics and Risks of Standardized Options at www.TradeStation.com . Before trading any asset class, customers must read the relevant risk disclosure statements on www.TradeStation.com . System access and trade placement and execution may be delayed or fail due to market volatility and volume, quote delays, system and software errors, Internet traffic, outages and other factors.
Securities and futures trading is offered to self-directed customers by TradeStation Securities, Inc., a broker-dealer registered with the Securities and Exchange Commission and a futures commission merchant licensed with the Commodity Futures Trading Commission). TradeStation Securities is a member of the Financial Industry Regulatory Authority, the National Futures Association, and a number of exchanges.
TradeStation Securities, Inc. and TradeStation Technologies, Inc. are each wholly owned subsidiaries of TradeStation Group, Inc., both operating, and providing products and services, under the TradeStation brand and trademark. When applying for, or purchasing, accounts, subscriptions, products and services, it is important that you know which company you will be dealing with. Visit www.TradeStation.com for further important information explaining what this means.

LIFE 360 legendary dealLife360 helps families stay connected and safe. It lets you share your location in real-time with loved ones, get alerts when someone arrives or leaves a specific spot, and even warns you if there's a car accident. Plus, it offers roadside assistance and identity theft protection. This could also have several applications in the industry and location of important packages.
Life360 is on a roll financially, with growing revenues and plans to expand with new tech, like a global satellite tracking network and services for pets in 2025 and seniors in 2026. They're also reducing losses and boosting income, which is a great sign for the future. With smarter advertising on the way, they're set to keep growing and innovating.
With this introduction, Life360 is a strong candidate for a long-term investment. However, our goal is to achieve fast profits with minimal risk, while continuing to search for other opportunities.
Last week, Life360 closed within a well-defined support zone around the 39.60 level. Purchasing at this level offers the potential for a 20% gain in the coming days , with a limited downside risk of only 3% to 4% (stop-loss zone).
Boosting the Trade to a Risk-Free Position
A common outcome for a multiple-bottom support pattern like this is a breakout, often followed by a rapid price decline. However, there is a strategy to capitalize on this scenario :
1. Buy 50% of the position with a take-profit (TP) at the first target.
2. Buy the remaining 50% with a TP at the second target area.
If the price rebounds to the first TP, we will s ecure a 6% profit, effectively ensuring a risk-free trade . In fact, this would result in an overall return of (6% × 50%) + (-4% × 50%) = 1% profit for the entire initial position.
If the price arrives to the 2nd target, a profit of over 13% will be done in few days combining both positions.

Cup & Handle to 81$ (and much more)Breakout successful from the red descending channel where we had left it in the previous idea.
The price is now completing the 'handle' of the pattern in question.
Resistance is around $81.5, and a close above it, accompanied by strong volume, could push the price back toward $100

Need a little pullback before long entryI am watching for a pull back to around the $191 area for a possible long entry. Keep on your
watchlist and I will update here if/when I initiate a trade.

STNG | Inverted H&S Breakout –Target +44% at 65 Major resistance📍 Ticker: NYSE:STNG (Scorpio Tankers Inc. – NYSE)
📆 Timeframe: 1D (Daily)
📉 Price: $45.62
📈 Pattern: Inverted Head & Shoulders + Breakout from Long-Term Falling Resistance
📊 Breakout Probability (estimated): 93% breakout success, 83% to measured target
🔍 Technical Setup:
STNG has completed a confirmed breakout from a textbook Inverted Head and Shoulders pattern, reinforced by a multi-month descending trendline break. This aligns with a multi-technical confluence zone, with the neckline holding as support.
✅ Classic reversal structure
📈 Strong breakout candle with volume > 2x average
🟢 RSI above 64 and no bearish divergence
📐 Measured move projection suggests two major upside targets
📏 Target Projections (from breakout at $41):
🎯 Target Price Return
Target 1 $51.98 +22.5%
Target 2 $65.83 +44.0%
📌 Both targets align with prior horizontal resistance and upper descending trendline intersections
🧠 Trade Plan:
📥 Entry Zone: $44.50 – $46.00 (post-breakout, wait for confirmed structure)
⛔ Stop-Loss (Trailing): Start below $40.00 → trail as price confirms above $48.00
🔁 Partial stop logic: Use under neckline, then adjust dynamically with trend support
📊 Estimated Probabilities:
📐 Pattern: Inverted Head & Shoulders
🔺 Breakout success rate: 93%
🎯 Target met probability: 83%
🔁 Throwback chance: 68% → ideal entry if price retests $41
⚠️ Technical Signals to Monitor:
🔎 Volume remains elevated → confirms institutional interest
✅ RSI trending above 60 → bullish momentum intact
📉 Wide base and upward neckline = higher success probability
📈 Price now in upward sloping channel → bias continues up unless trendline fails
💬 STNG is delivering a clean multi-pattern breakout, backed by volume, RSI confirmation, and a textbook technical structure. If momentum holds, this setup may be one of the highest-probability mid-term swing plays on the NYSE right now.
Follow @TargetTraders for high-probability technical trades
#STNG #TechnicalBreakout #InvertedHeadAndShoulders #PatternTrading #ChartPatterns #NYSEStocks #VolumeBreakout #SwingSetup #BreakoutTrade #SwingTrade #TargetTraders

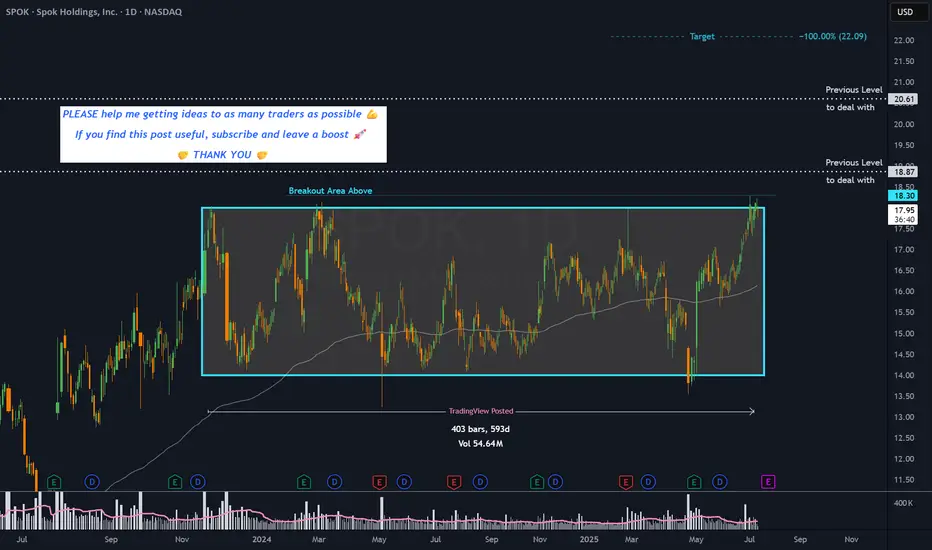
SPOK - 19 months RECTANGLE══════════════════════════════
Since 2014, my markets approach is to spot
trading opportunities based solely on the
development of
CLASSICAL CHART PATTERNS
🤝Let’s learn and grow together 🤝
══════════════════════════════
Hello Traders ✌
After a careful consideration I came to the conclusion that:
- it is crucial to be quick in alerting you with all the opportunities I spot and often I don't post a good pattern because I don't have the opportunity to write down a proper didactical comment;
- since my parameters to identify a Classical Pattern and its scenario are very well defined, many of my comments were and would be redundant;
- the information that I think is important is very simple and can easily be understood just by looking at charts;
For these reasons and hoping to give you a better help, I decided to write comments only when something very specific or interesting shows up, otherwise all the information is shown on the chart.
Thank you all for your support
🔎🔎🔎 ALWAYS REMEMBER
"A pattern IS NOT a Pattern until the breakout is completed. Before that moment it is just a bunch of colorful candlesticks on a chart of your watchlist"
═════════════════════════════
⚠ DISCLAIMER ⚠
Breakout Area, Target, Levels, each line drawn on this chart and any other content represent just The Art Of Charting’s personal opinion and it is posted purely for educational purposes. Therefore it must not be taken as a direct or indirect investing recommendations or advices. Entry Point, Initial Stop Loss and Targets depend on your personal and unique Trading Plan Tactics and Money Management rules, Any action taken upon these information is at your own risk.
═════════════════════════════
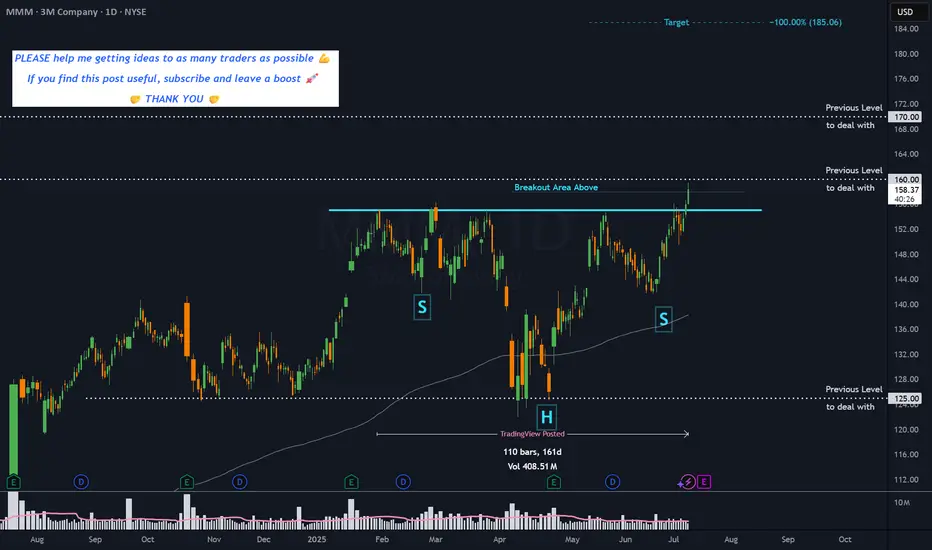
MMM - 5 months HEAD & SHOULDERS CONTINUATION══════════════════════════════
Since 2014, my markets approach is to spot
trading opportunities based solely on the
development of
CLASSICAL CHART PATTERNS
🤝Let’s learn and grow together 🤝
══════════════════════════════
Hello Traders ✌
After a careful consideration I came to the conclusion that:
- it is crucial to be quick in alerting you with all the opportunities I spot and often I don't post a good pattern because I don't have the opportunity to write down a proper didactical comment;
- since my parameters to identify a Classical Pattern and its scenario are very well defined, many of my comments were and would be redundant;
- the information that I think is important is very simple and can easily be understood just by looking at charts;
For these reasons and hoping to give you a better help, I decided to write comments only when something very specific or interesting shows up, otherwise all the information is shown on the chart.
Thank you all for your support
🔎🔎🔎 ALWAYS REMEMBER
"A pattern IS NOT a Pattern until the breakout is completed. Before that moment it is just a bunch of colorful candlesticks on a chart of your watchlist"
═════════════════════════════
⚠ DISCLAIMER ⚠
Breakout Area, Target, Levels, each line drawn on this chart and any other content represent just The Art Of Charting’s personal opinion and it is posted purely for educational purposes. Therefore it must not be taken as a direct or indirect investing recommendations or advices. Entry Point, Initial Stop Loss and Targets depend on your personal and unique Trading Plan Tactics and Money Management rules, Any action taken upon these information is at your own risk.
═════════════════════════════
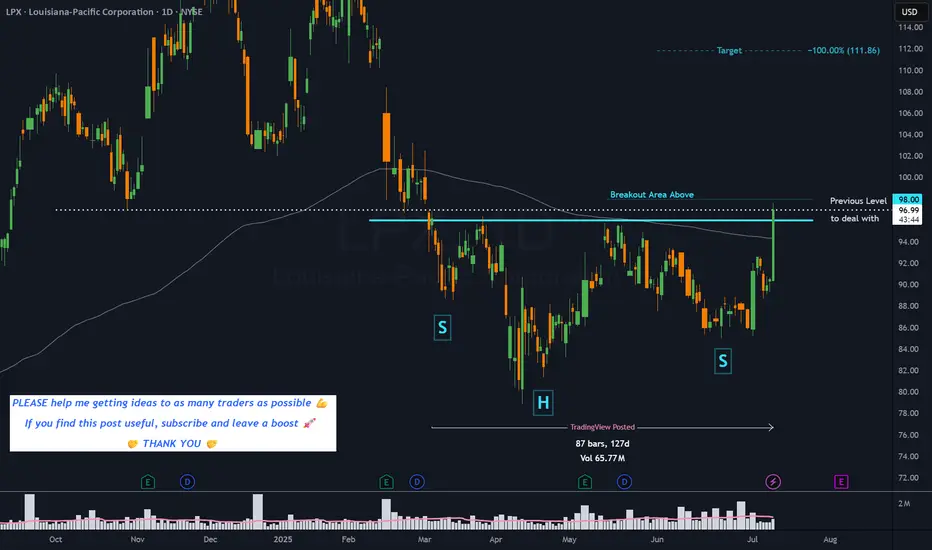
LPX - 4 months HEAD & SHOULDERS══════════════════════════════
Since 2014, my markets approach is to spot
trading opportunities based solely on the
development of
CLASSICAL CHART PATTERNS
🤝Let’s learn and grow together 🤝
══════════════════════════════
Hello Traders ✌
After a careful consideration I came to the conclusion that:
- it is crucial to be quick in alerting you with all the opportunities I spot and often I don't post a good pattern because I don't have the opportunity to write down a proper didactical comment;
- since my parameters to identify a Classical Pattern and its scenario are very well defined, many of my comments were and would be redundant;
- the information that I think is important is very simple and can easily be understood just by looking at charts;
For these reasons and hoping to give you a better help, I decided to write comments only when something very specific or interesting shows up, otherwise all the information is shown on the chart.
Thank you all for your support
🔎🔎🔎 ALWAYS REMEMBER
"A pattern IS NOT a Pattern until the breakout is completed. Before that moment it is just a bunch of colorful candlesticks on a chart of your watchlist"
═════════════════════════════
⚠ DISCLAIMER ⚠
Breakout Area, Target, Levels, each line drawn on this chart and any other content represent just The Art Of Charting’s personal opinion and it is posted purely for educational purposes. Therefore it must not be taken as a direct or indirect investing recommendations or advices. Entry Point, Initial Stop Loss and Targets depend on your personal and unique Trading Plan Tactics and Money Management rules, Any action taken upon these information is at your own risk.
═════════════════════════════
Franco-Nevada Breakout — Is $160 the Launchpad?With gold breaking to new all-time highs and capital rotating into high-quality royalty names, Franco-Nevada looks poised to lead the charge in the next leg of the bull market.
After spending nearly 3 years in a wide consolidation ($106–160), FNV has now posted a clean monthly close above $160 — the key resistance level that capped every rally since 2020. This is not just any breakout — it's the classic "base + breakout" structure that often precedes major upside moves.
🔍 Technical Highlights:
✅ Multi-year base breakout confirmed on monthly close
✅ Strong confluence of Ichimoku, MAs & low-volume node just above $160
✅ $160 flips from resistance to structural support (role reversal)
🎯 Measured Move Target: $230
📍 Initial Target Zone: $208–215
📈 Retest of $160 offers a ~30% upside with tight risk
🛑 Risk Management: A pullback that holds $160 on weekly/monthly close would validate the breakout.
Breakdown below $160 on volume would put the move on hold and reintroduce range risk.
💡 Bottom Line: This is a textbook breakout with asymmetric risk/reward. While gold gets the headlines, Franco-Nevada may quietly be leading the charge in royalty sector performance.
