Break of downward sloping channel LongNike has swept liquidity and is now showing a strong bounce to the upside.
Although I didn’t manage to enter the initial long, I am monitoring for a break above the current downward-sloping channel. A clean breakout followed by a retest would provide a more reliable entry point. I’m not aiming to catch the absolute bottom—I’d rather wait for confirmation of trend reversal.
A move above the monthly level at 79.46 would be an additional sign of strength and increase conviction in the long setup.
There is still significant overhead resistance, particularly around the point of control aligned with the anchored VWAP near 92.50. That area would be my first target. However, if momentum continues, there is potential for a move towards the 122 level.

Golden Cross on GME WeeklyGME Chart Breakdown, Déjà Vu or Destiny? Something big just lit up the weekly chart, the 50 MA has pierced through the 200 MA, forming that golden cross traders dream about. On the weekly timeframe. Not a drill.
Now, let’s rewind. The last time this pattern appeared? January 2021. The infamous squeeze. Back then, GME didn’t just nudge upward, it catapulted nearly 4000%, going from a $3 floor to $120 in a blink.
Fast forward to today, new golden cross, new setup, and a $23 floor. If history rhymes even remotely, we’re staring down a hypothetical $1000 per share move. Yes, one thousand.
Is lightning about to strike twice? Stay tuned to find out!

TSLA Long Idea — Buying the Support After News-Driven DipNASDAQ:TSLA price has stabilized near the key $290–291 support zone, a level that has previously triggered rebounds. This presents a solid entry opportunity with limited downside risk.
Context: The recent drop was triggered by headlines involving the U.S. President and Elon Musk. If this was mainly speculative noise, now could be the best time to buy, as the market absorbs the news and finds technical support.
Technical Setup:
• Strong support at $290–291 holding firm.
• Stochastic is in the oversold zone and starting to turn upward.
• Bollinger Bands tightening — breakout likely.
• Target: $307.45 (+4.57%)
• Stop-loss: $289.09 (−1.68%)
• Risk/Reward Ratio: 2.72
Expected move by July 9, 2025. With strong technical signals and fading news impact, this setup offers a favorable risk/reward for bulls looking to ride a rebound.

3M is skyrocketing againAfter a period of sideways trading, 3M has clearly shown where its resistance levels are—and this is dynamite for traders. If the price breaks above the current resistance, we could be in for a very interesting rally, especially if it also surpasses the previous all-time high at 165.
This offers a great opportunity to enter a position in 3M with the potential for a 10% or greater profit in just a few weeks, while keeping your stop loss at 2-3%.
This trade can be done with minimal risk. To learn more about the strategy, follow ;)

JPM + $500B Capital Forecast + Banks to Profit from Tar NYSE:JPM , 4H chart
ALVO13 Insight: A strong mix of technical structure and positive fundamentals.Technical Setup (Elliott Waves):
The chart suggests a potential start of wave (5) after a completed correction (4).
Stochastic is in the oversold zone, and $280 support is holding — a key signal for a possible reversal.
Key Levels:
• Support: $280.00–280.47
• Resistance: $295.73–298.02
• Target (Wave 5): $315.67
Fundamental Factors:
JPMorgan forecasts up to $500B in new equity inflows from retail and institutional investors during H2 2025. This could lift the market, especially financials.
Banks are likely to benefit from upcoming trade tariffs — via increased demand for hedging, transaction fees, and advisory services.
PM remains one of the most solid U.S. banks, with strong dividend policies and excellent return on equity (ROE).
ALVO13 Trade Idea:
• Entry: $282–286 (confirmation-based)
• Stop-loss: below $280
• Take-profit: $315+
• Risk/Reward: 3:1
Break below $280 invalidates the bullish wave 5 scenario.

Triple top in AM🧱 1. Pattern: Triple Top
At the top of the chart, you’ll notice the label “Triple top pattern”.
This is a bearish pattern that appears when the price hits the same resistance level three times but fails to break above it.
💡 It usually means the buyers are getting weaker, and the price might start going down.
📉 2. Sell Signal (Breakdown)
The price has dropped below the blue support line, entering what’s marked as the “Sell zone”.
This breakdown confirms the triple top pattern and can be a signal to enter a short (sell) trade , expecting further decline.
🎯 3. Profit Target (Take Profit)
✅ The “Take profits” level is marked below the sell zone, with a potential gain of +3.3%.
This is the target area where traders might want to exit the trade and secure profits if the price keeps dropping.
🛑 4. Stop Loss (Risk Control)
A “Stop loss” is placed just above the breakout area with a 2.6% risk.
This is your safety limit — if the price goes back up instead of down, the trade will automatically close to avoid bigger losses.
📦 5. Volume Profile (Right Side Bars)
On the right side, the yellow and blue bars show the Volume Profile — where the most buying/selling happened.
💡 These zones often act as support or resistance because they show where lots of traders are interested in the stock.
✅ Quick Summary
A Triple Top pattern has formed — a sign the stock may start falling.
The price broke support and entered the sell zone.
There's a profit target set at +3.3%.
A stop loss is placed at 2.6% to manage risk.
Volume data supports these zones as key decision areas.

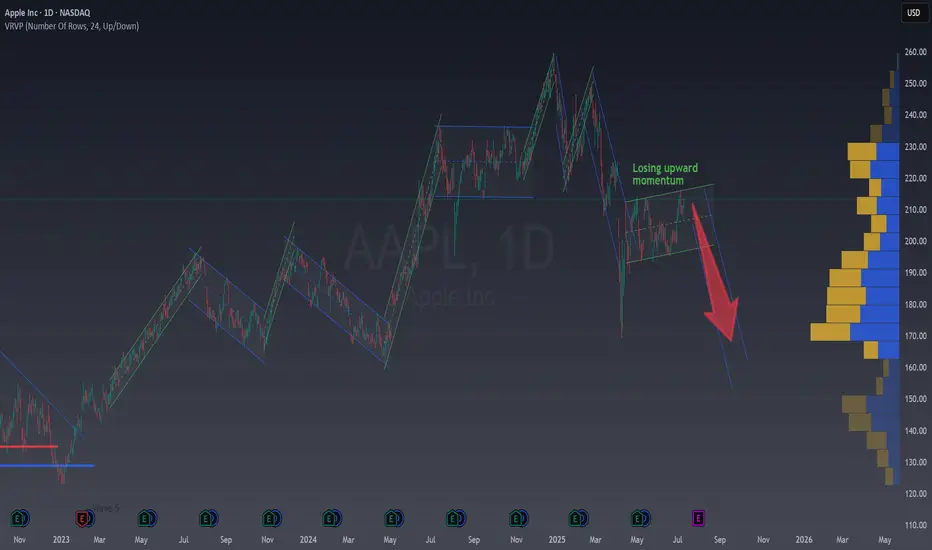
Apple in 2025: Why the Bulls Are Losing SteamApple’s stock has clearly lost its bullish momentum this year, and the chart you shared sums it up perfectly.
Let’s break down what’s happening and why investors are shifting focus to companies like Nvidia and Microsoft.
Chart Says :
Weak Rebounds (green), Bearish Pressure (blue channels are now more agresive)
Downtrend Channels: The chart shows Apple forming lower highs and lower lows, bouncing inside downward channels (not real channels, but are very ilustrative of how the price is moving trendy or not in each direction).
Each recovery (green) is weaker than the last, and the most recent upward move is still capped by resistance.
Bearish Patterns : The price action is dominated by failed breakouts and new descending channels, signaling that sellers are in control.
Volume & Participation: There’s no strong buying volume to support a real reversal. This makes any rally fragile and prone to quick pullbacks.
Why Is the Market Doubting Apple?
Slowing Growth : Apple’s revenue growth has stalled, especially in China, where sales dropped 13% year-over-year. The latest iPhone launch was underwhelming, and services aren't growing fast enough to offset weak hardware sales.
Falling Behind in AI: While Nvidia and Microsoft are leading the AI revolution, Apple is seen as late to the party. Their recent AI announcements disappointed investors looking for bold innovation.
External Pressures: New tariffs and global tensions are hitting Apple harder than its peers, since more than 60% of its sales are international.
Analyst Downgrades: Several analysts have lowered their price targets and ratings, reflecting concerns about Apple’s future growth. We've recently seen someanalyst showing prices under $200.
Key Takeaway
Apple is struggling to regain its former strength. The chart shows persistent bearishness, and the fundamentals back it up: slow growth, weak innovation, and external risks. Meanwhile, Nvidia and Microsoft are capturing investor attention with explosive growth and leadership in AI.
Until Apple delivers a real catalyst, the path of least resistance remains down or sideways, not up.
Do you think apple can surprise with some new AI innovation unexpected for all of us?
IBM eyes on $282.88: Golden Genesis fib a Key Support to uptrendIBM has been in a strong uptrend but looking top-ish.
It has pulled back to a Golden Genesis fib at $282.88
Look for a bounce but perhaps after a couple orbits.
.
See "Related Publications" for previous charts like this BOTTOM CALL:
Hit the BOOST and FOLLOW for more such PRECISE and TIMELY charts.
============================================================
.

Long TESLATrading Fam,
Today my indicator has signaled a BUY on $TSLA. The technicals align. M pattern looks to have completed at strong support (RED TL) and is bouncing upwards inside of a solid liquidity block. Buyers are stepping in. I'm in at $315 and will shoot for $430 (probably taking some profit along the way). My SL is currently $241 but will trail as we enter profit.
Best,
Stew

A way to find Historical BottomsWhen it comes to trading stocks, one of the most powerful skills you can develop is the ability to spot historical bottoms , those rare moments when a stock finishes its downtrend and starts a new upward journey. Catching these bottoms means entering trades with low risk and high reward potential , riding the wave of a new trend from the very beginning.
The Power of Double Bottoms
One of the most reliable chart patterns for identifying market bottoms is the Double Bottom. This pattern acts like a springboard for price, signaling that sellers are losing control and buyers are stepping in, showing a clear floor
Here’s how it works:
First Bottom : The stock drops to a new low, but then buyers push it up.
Second Bottom: After a short rally, the price falls again, often to a similar level as the first bottom , but this time, it doesn’t go lower. Buyers step in once more.
Breakout : When the price rises above the high point between the two bottoms, it confirms the pattern and suggests a new uptrend is beginning.
This structure creates a clear “floor” in the market, showing where demand outweighs supply. Traders love this setup because it gives a logical place to set stop-losses, keeping risk low.
Learning from the Chart
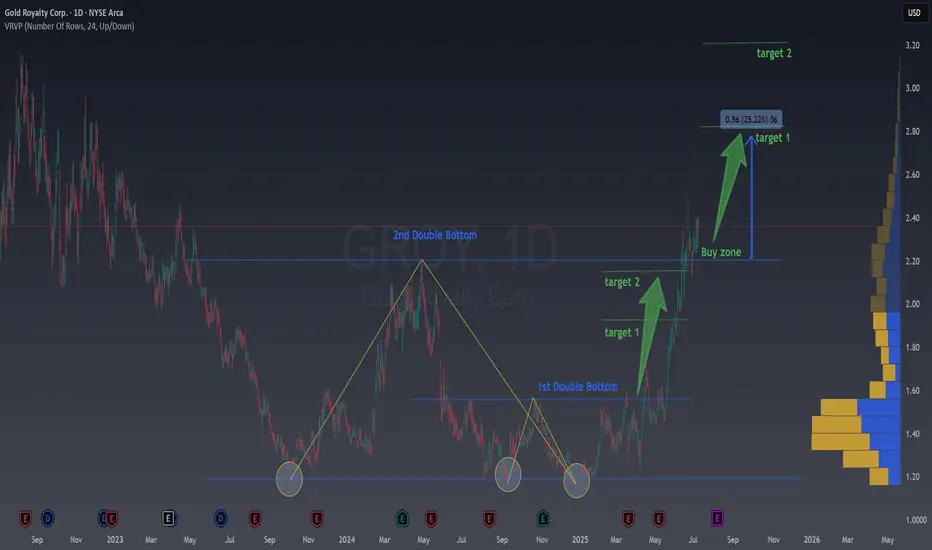
Let’s look at the provided chart of Gold Royalty Corp. (GROY) to see this in action. The chart highlights two Double Bottom patterns that formed over several months.
1st Double Bottom: Notice how the price hits a low, bounces, and then returns to the same area before bouncing again. This repeated support signals a strong bottom.
2nd Double Bottom: The pattern repeats, confirming even more buyers are entering at this level.
After these patterns form, the price breaks out above the resistance level (the high between the two bottoms). This breakout is often the ideal buy zone, the moment when a new trend is likely starting, and risk is minimized because your stop can be placed just below the recent lows.
Why Double Bottoms Work
Double Bottoms are powerful because they reflect real market psychology:
Capitulation : Sellers exhaust themselves on the first dip.
Testing : The second dip tests the market’s conviction, if buyers step in again, it’s a strong sign of a bottom.
Confirmation : The breakout above resistance confirms that demand is back in control.
How to Trade Double Bottoms
Here’s a simple, actionable approach:
Identify the Pattern : Look for two distinct lows at roughly the same price level, separated by a moderate rally.
Wait for Confirmation : Only enter when the price breaks above the high between the two bottoms.
Set Your Stop : Place your stop-loss just below some important local low or some fibo levels that we always share in our newsletter.
Target the Move: Use previous resistance levels or Fibo levels.
Example from the Chart
In the GROY chart, after the second Double Bottom, the price broke out and rallied strongly, hitting both target levels marked on the chart. Traders who entered at the breakout enjoyed a substantial move with limited downside.
Take away
Spotting Double Bottoms isn’t about predicting the future—it’s about reading the market’s story. By focusing on these patterns, you can find historical bottoms with confidence, enter trades with low risk, and position yourself to ride the next big trend. The best part? You don’t need to catch every bottom, just the clear, confirmed ones. That’s how you build consistency and success in trading.
If you’re new to chart patterns, start by looking for Double Bottoms on historical charts. Practice spotting them, and you’ll soon see how they can transform your trading approach.
META Holds Bullish Ground Above Support at $714.0#META dipped to a high volume area at $720.8, while critical support stands tall at $714.0. The market is bullish above this level, with the next target at $748.8.

Delta Air Lines, Inc. (DAL) on the verge of testing resistanceAs shown in the chart studies, premarket trading for the DAL stock indicates that price is trading 10% in the green, breaking through key resistances at the 3M level of US$51.80. Overhead, attention will now be on two barriers of resistance: the 1M level at US$57.51 and the 3M base at US$60.16.
FP Markets Research Team

SelectQuote | SLQT | Long at $2.18SelectQuote NYSE:SLQT is currently resting within my historical simple moving average zone. This often signals consolidation and a future move (in this case, let's hope up). Looking at the company's financials, NYSE:SLQT is currently profitable. For Q3 2025 (ended March 31, 2025), the company reported a net income of $26.0 million, up from $8.6 million in Q3 2024. This follows a strong Q2 2025 with a net income of $53.2 million. While like most companies there are likely headwinds in 2025 (earnings are projected at a loss of -$0.20 per share due to seasonal fluctuations and investments in 2025 (e.g., new Kansas facility)), profitability is likely to stabilize in 2026, with EPS forecasts of $0.05, supported by improved Medicare reimbursement rates and operational efficiencies. Ongoing Department of Justice allegations could pose risks... but SelectQuote’s recent $350M investment and cost management suggest profitability may continue if legal issues are resolved favorably.
Thus, at $2.18, NYSE:SLQT is in a personal buy zone. There is a potential for the price to dip to the bottom of the historical simple moving average channel (near $1.25) in the near-term, but time will tell.
Targets:
$2.64
$4.24

A bit of profit taking on NVDA and then up again?NASDAQ:NVDA is the most talked about and everyone is capitalizing on that. Let's take a look.
NASDAQ:NVDA
Let us know what you think in the comments below.
Thank you.
75.2% of retail investor accounts lose money when trading CFDs with this provider. You should consider whether you understand how CFDs work and whether you can afford to take the high risk of losing your money. Past performance is not necessarily indicative of future results. The value of investments may fall as well as rise and the investor may not get back the amount initially invested. This content is not intended for nor applicable to residents of the UK. Cryptocurrency CFDs and spread bets are restricted in the UK for all retail clients.

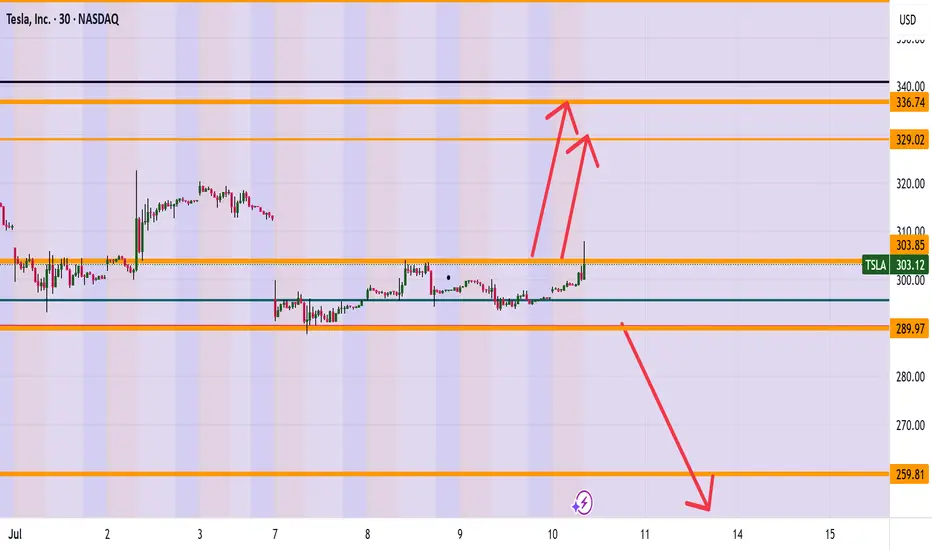
TESLA (TSLA) ARE WE HEADING TO 336? Morning Folks
It appears we are trying to break the highs of 304 and if we are successful a nice range up to 327-336 makes sense. However be careful if sink back down under 289 which then can see levels of 259 getting hit.
What are your thoughts on Tesla? Put in the comments section below
Kris Mindbloome Exchange
Trade Smarter Live Better
JNJ watch $156.72-158.17: Double Golden Fib zone about to break?JNJ struggling against Double Goldens at $156.72-158.17
After many tests from underside, it looks ready to break.
Above this zone are only scattered clouds for some ways.

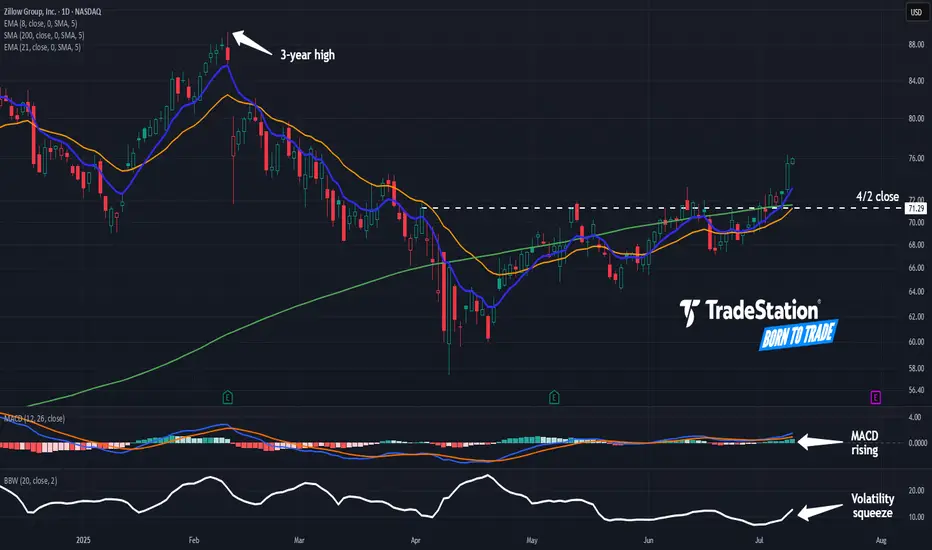
Zillow May Be Coming to LifeZillow has been in a tight range for months, but now it may be coming to life.
The first pattern on today’s chart is the April 2 close of $71.29. Z closed above it last week and is extending the move, which may confirm a breakout.
Second, prices pushed above the rising 200-day simple moving average. That may reflect a bullish long-term trend in the housing tech stock.
Third, the 8-day exponential moving average (EMA) is above the 21-day EMA. MACD is also rising. Those signals may be consistent with short-term bullishness.
Finally, Bollinger Band Width hit a two-year low last week. Could that price compression give rise to expansion?
Check out TradingView's The Leap competition sponsored by TradeStation.
TradeStation has, for decades, advanced the trading industry, providing access to stocks, options and futures. If you're born to trade, we could be for you. See our Overview for more.
Past performance, whether actual or indicated by historical tests of strategies, is no guarantee of future performance or success. There is a possibility that you may sustain a loss equal to or greater than your entire investment regardless of which asset class you trade (equities, options or futures); therefore, you should not invest or risk money that you cannot afford to lose. Online trading is not suitable for all investors. View the document titled Characteristics and Risks of Standardized Options at www.TradeStation.com . Before trading any asset class, customers must read the relevant risk disclosure statements on www.TradeStation.com . System access and trade placement and execution may be delayed or fail due to market volatility and volume, quote delays, system and software errors, Internet traffic, outages and other factors.
Securities and futures trading is offered to self-directed customers by TradeStation Securities, Inc., a broker-dealer registered with the Securities and Exchange Commission and a futures commission merchant licensed with the Commodity Futures Trading Commission). TradeStation Securities is a member of the Financial Industry Regulatory Authority, the National Futures Association, and a number of exchanges.
Options trading is not suitable for all investors. Your TradeStation Securities’ account application to trade options will be considered and approved or disapproved based on all relevant factors, including your trading experience. See www.TradeStation.com . Visit www.TradeStation.com for full details on the costs and fees associated with options.
Margin trading involves risks, and it is important that you fully understand those risks before trading on margin. The Margin Disclosure Statement outlines many of those risks, including that you can lose more funds than you deposit in your margin account; your brokerage firm can force the sale of securities in your account; your brokerage firm can sell your securities without contacting you; and you are not entitled to an extension of time on a margin call. Review the Margin Disclosure Statement at www.TradeStation.com .
TradeStation Securities, Inc. and TradeStation Technologies, Inc. are each wholly owned subsidiaries of TradeStation Group, Inc., both operating, and providing products and services, under the TradeStation brand and trademark. When applying for, or purchasing, accounts, subscriptions, products and services, it is important that you know which company you will be dealing with. Visit www.TradeStation.com for further important information explaining what this means.
AMD Clears Resistance, Eyes $147.8 on Bullish ReboundAMD broke above $139.8, making the primary trend bullish. A pullback to this level can provide a discount to join the bull market, with a target at $147.8.

Juggernaut to ATH PT : $750-850- Absolute juggernaut of a company. Top tier management and solid execution lately deserves premium valuation.
- NASDAQ:INTU is moving up market i.e targeting on mid markets as compared to just focussing on SMBs ( Small & Medium Sized Businesses )
- Company has a MOAT all those FUD regarding simplification of tax laws/rules was overblown.
- Company should do well irrespective of the MACRO. Even, if US enters recession, People gotta file taxes and do accounting. Some segments will show weakness in case of recession like Mailchimp and Credit Karma. But TurboTax and Quickbooks are all weather products.
- Final take: NASDAQ:INTU should break to all time highs if the upcoming quarter impresses.
- PT: 750-850

PLTR: Sell ideaSell idea on PLTR as you can see on the chart if and only if we have the breakout with force
the Belkhayate Iceberg, the vwap and the support line by the sellers.

3D TriangleThe ultimate indecision, we have asymmetrical triangle on a 3 Day Chart, however the downward movement in the price pattern may reverse due to the RSI pattern, but it seems bears and bulls will move with conviction once a breakout of the triangle happens.

TSLA: Buy ideaBuy idea on TSLA as you can see on the chart after the breakout with force the resistance line by the buyers.

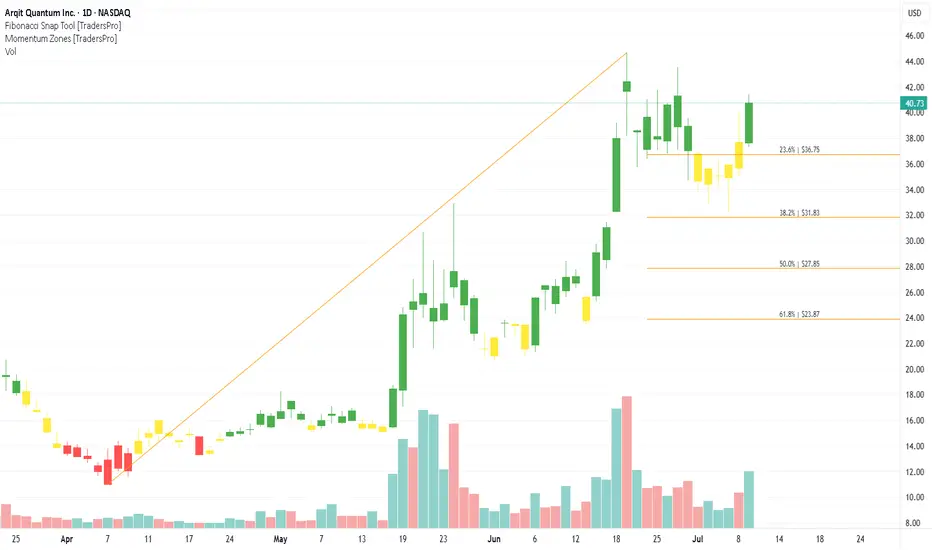
Arqit Quantum Inc. (ARQQ) Powers Quantum SecurityArqit Quantum Inc. (ARQQ) is a cybersecurity company pioneering quantum-safe encryption technology. Its platform, QuantumCloud™, is designed to protect data from current and future threats, including those posed by quantum computers. Arqit’s growth is driven by increasing global awareness of cybersecurity risks, the push for next-generation encryption, and strategic partnerships with governments and defense sectors seeking advanced data protection.
On the chart, a confirmation bar with rising volume signals strong buyer interest. The price has entered the momentum zone after moving above the .236 Fibonacci level. A trailing stop can be set just below that level using the Fibonacci snap tool to secure profits while riding the trend.