SelectQuote | SLQT | Long at $2.18SelectQuote NYSE:SLQT is currently resting within my historical simple moving average zone. This often signals consolidation and a future move (in this case, let's hope up). Looking at the company's financials, NYSE:SLQT is currently profitable. For Q3 2025 (ended March 31, 2025), the company reported a net income of $26.0 million, up from $8.6 million in Q3 2024. This follows a strong Q2 2025 with a net income of $53.2 million. While like most companies there are likely headwinds in 2025 (earnings are projected at a loss of -$0.20 per share due to seasonal fluctuations and investments in 2025 (e.g., new Kansas facility)), profitability is likely to stabilize in 2026, with EPS forecasts of $0.05, supported by improved Medicare reimbursement rates and operational efficiencies. Ongoing Department of Justice allegations could pose risks... but SelectQuote’s recent $350M investment and cost management suggest profitability may continue if legal issues are resolved favorably.
Thus, at $2.18, NYSE:SLQT is in a personal buy zone. There is a potential for the price to dip to the bottom of the historical simple moving average channel (near $1.25) in the near-term, but time will tell.
Targets:
$2.64
$4.24

A bit of profit taking on NVDA and then up again?NASDAQ:NVDA is the most talked about and everyone is capitalizing on that. Let's take a look.
NASDAQ:NVDA
Let us know what you think in the comments below.
Thank you.
75.2% of retail investor accounts lose money when trading CFDs with this provider. You should consider whether you understand how CFDs work and whether you can afford to take the high risk of losing your money. Past performance is not necessarily indicative of future results. The value of investments may fall as well as rise and the investor may not get back the amount initially invested. This content is not intended for nor applicable to residents of the UK. Cryptocurrency CFDs and spread bets are restricted in the UK for all retail clients.

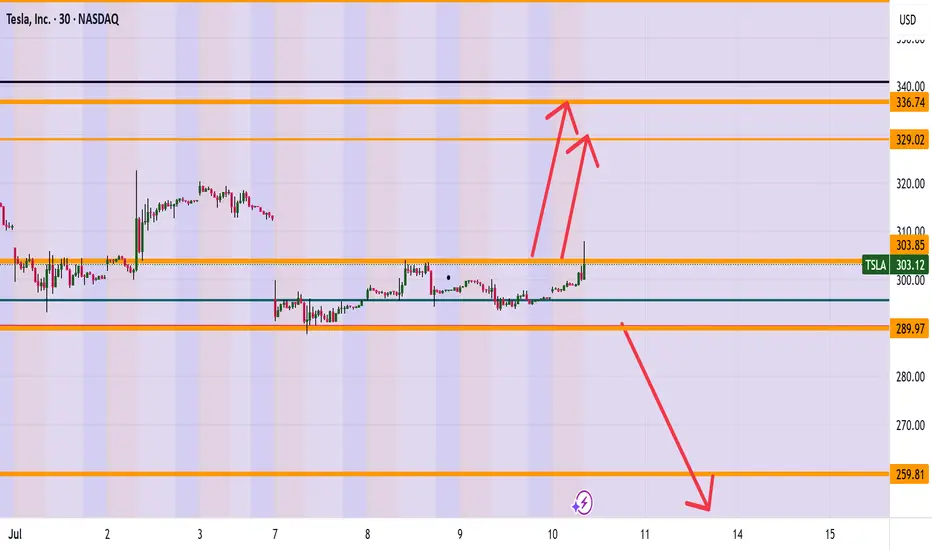
TESLA (TSLA) ARE WE HEADING TO 336? Morning Folks
It appears we are trying to break the highs of 304 and if we are successful a nice range up to 327-336 makes sense. However be careful if sink back down under 289 which then can see levels of 259 getting hit.
What are your thoughts on Tesla? Put in the comments section below
Kris Mindbloome Exchange
Trade Smarter Live Better
JNJ watch $156.72-158.17: Double Golden Fib zone about to break?JNJ struggling against Double Goldens at $156.72-158.17
After many tests from underside, it looks ready to break.
Above this zone are only scattered clouds for some ways.

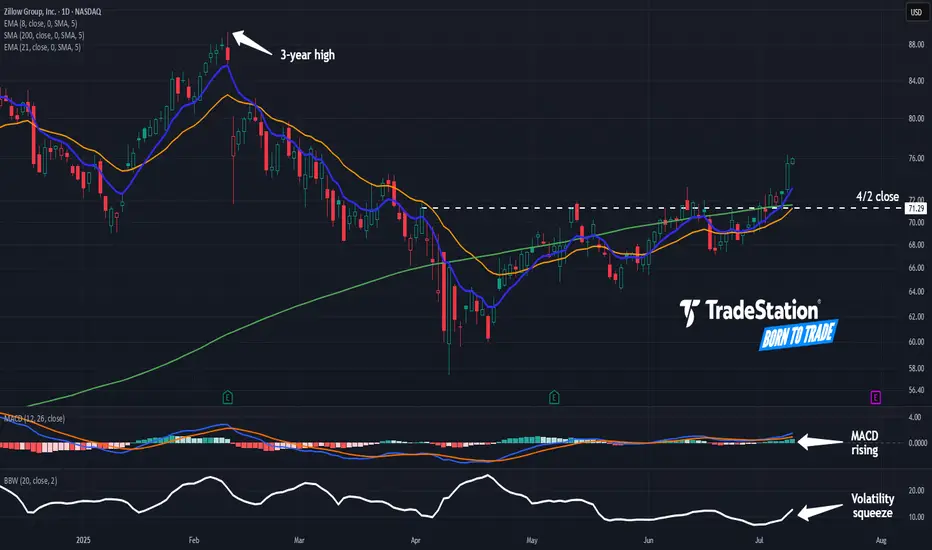
Zillow May Be Coming to LifeZillow has been in a tight range for months, but now it may be coming to life.
The first pattern on today’s chart is the April 2 close of $71.29. Z closed above it last week and is extending the move, which may confirm a breakout.
Second, prices pushed above the rising 200-day simple moving average. That may reflect a bullish long-term trend in the housing tech stock.
Third, the 8-day exponential moving average (EMA) is above the 21-day EMA. MACD is also rising. Those signals may be consistent with short-term bullishness.
Finally, Bollinger Band Width hit a two-year low last week. Could that price compression give rise to expansion?
Check out TradingView's The Leap competition sponsored by TradeStation.
TradeStation has, for decades, advanced the trading industry, providing access to stocks, options and futures. If you're born to trade, we could be for you. See our Overview for more.
Past performance, whether actual or indicated by historical tests of strategies, is no guarantee of future performance or success. There is a possibility that you may sustain a loss equal to or greater than your entire investment regardless of which asset class you trade (equities, options or futures); therefore, you should not invest or risk money that you cannot afford to lose. Online trading is not suitable for all investors. View the document titled Characteristics and Risks of Standardized Options at www.TradeStation.com . Before trading any asset class, customers must read the relevant risk disclosure statements on www.TradeStation.com . System access and trade placement and execution may be delayed or fail due to market volatility and volume, quote delays, system and software errors, Internet traffic, outages and other factors.
Securities and futures trading is offered to self-directed customers by TradeStation Securities, Inc., a broker-dealer registered with the Securities and Exchange Commission and a futures commission merchant licensed with the Commodity Futures Trading Commission). TradeStation Securities is a member of the Financial Industry Regulatory Authority, the National Futures Association, and a number of exchanges.
Options trading is not suitable for all investors. Your TradeStation Securities’ account application to trade options will be considered and approved or disapproved based on all relevant factors, including your trading experience. See www.TradeStation.com . Visit www.TradeStation.com for full details on the costs and fees associated with options.
Margin trading involves risks, and it is important that you fully understand those risks before trading on margin. The Margin Disclosure Statement outlines many of those risks, including that you can lose more funds than you deposit in your margin account; your brokerage firm can force the sale of securities in your account; your brokerage firm can sell your securities without contacting you; and you are not entitled to an extension of time on a margin call. Review the Margin Disclosure Statement at www.TradeStation.com .
TradeStation Securities, Inc. and TradeStation Technologies, Inc. are each wholly owned subsidiaries of TradeStation Group, Inc., both operating, and providing products and services, under the TradeStation brand and trademark. When applying for, or purchasing, accounts, subscriptions, products and services, it is important that you know which company you will be dealing with. Visit www.TradeStation.com for further important information explaining what this means.
AMD Clears Resistance, Eyes $147.8 on Bullish ReboundAMD broke above $139.8, making the primary trend bullish. A pullback to this level can provide a discount to join the bull market, with a target at $147.8.

Juggernaut to ATH PT : $750-850- Absolute juggernaut of a company. Top tier management and solid execution lately deserves premium valuation.
- NASDAQ:INTU is moving up market i.e targeting on mid markets as compared to just focussing on SMBs ( Small & Medium Sized Businesses )
- Company has a MOAT all those FUD regarding simplification of tax laws/rules was overblown.
- Company should do well irrespective of the MACRO. Even, if US enters recession, People gotta file taxes and do accounting. Some segments will show weakness in case of recession like Mailchimp and Credit Karma. But TurboTax and Quickbooks are all weather products.
- Final take: NASDAQ:INTU should break to all time highs if the upcoming quarter impresses.
- PT: 750-850

PLTR: Sell ideaSell idea on PLTR as you can see on the chart if and only if we have the breakout with force
the Belkhayate Iceberg, the vwap and the support line by the sellers.

3D TriangleThe ultimate indecision, we have asymmetrical triangle on a 3 Day Chart, however the downward movement in the price pattern may reverse due to the RSI pattern, but it seems bears and bulls will move with conviction once a breakout of the triangle happens.

TSLA: Buy ideaBuy idea on TSLA as you can see on the chart after the breakout with force the resistance line by the buyers.

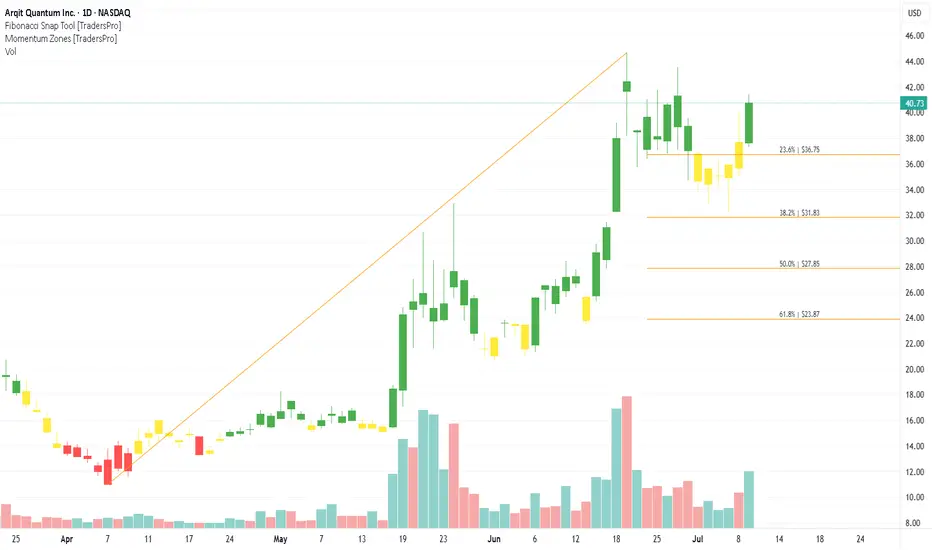
Arqit Quantum Inc. (ARQQ) Powers Quantum SecurityArqit Quantum Inc. (ARQQ) is a cybersecurity company pioneering quantum-safe encryption technology. Its platform, QuantumCloud™, is designed to protect data from current and future threats, including those posed by quantum computers. Arqit’s growth is driven by increasing global awareness of cybersecurity risks, the push for next-generation encryption, and strategic partnerships with governments and defense sectors seeking advanced data protection.
On the chart, a confirmation bar with rising volume signals strong buyer interest. The price has entered the momentum zone after moving above the .236 Fibonacci level. A trailing stop can be set just below that level using the Fibonacci snap tool to secure profits while riding the trend.
Microstrategy: Renewed Upside MicroStrategy has continued to face downward pressure recently but is now showing more decisive signs of an upward move. We still see greater upside potential in the current magenta wave , though we expect the peak to form below resistance at $671.32. Afterward, the bearish wave should complete turquoise wave 2—while still holding above support at $153.49. Wave 3 should then usher in a longer upward phase, with momentum likely to ease only well above the $671.32 level. At the same time, there remains a 33% probability that the stock has already entered this upward phase. In that scenario, turquoise wave alt. 2 would already be complete, and the price would move directly above $671.32 as part of wave alt. 3.
📈 Over 190 precise analyses, clear entry points, and defined Target Zones - that's what we do.

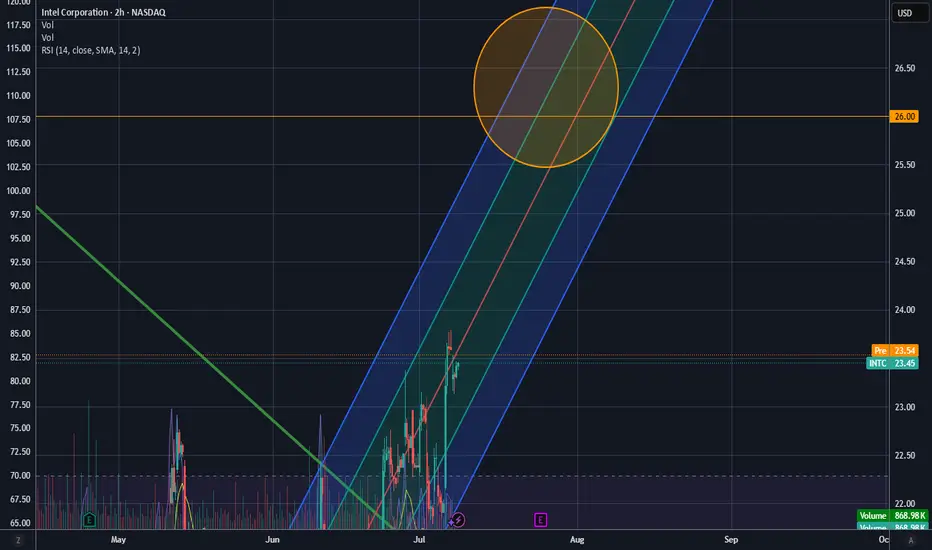
I could be wrong.... but: Earnings breakout? Intel has certainly tested the patience of investors lately. That said, it’s in these moments — when sentiment turns and many walk away — that opportunity quietly builds. I’m maintaining my position, currently averaging around $24 per share alongside a sizable options exposure.
What makes this cycle feel different? It reminds me of Intel’s rally under Pat Gelsinger when the stock surged to $50, but this time the momentum seems more organic, driven by operational improvements and emerging tailwinds rather than speculative hype.
We’ll see how it plays out, but I’ve been meaning to put this out there: I’m still here, still holding, and watching this story unfold. Let’s go.
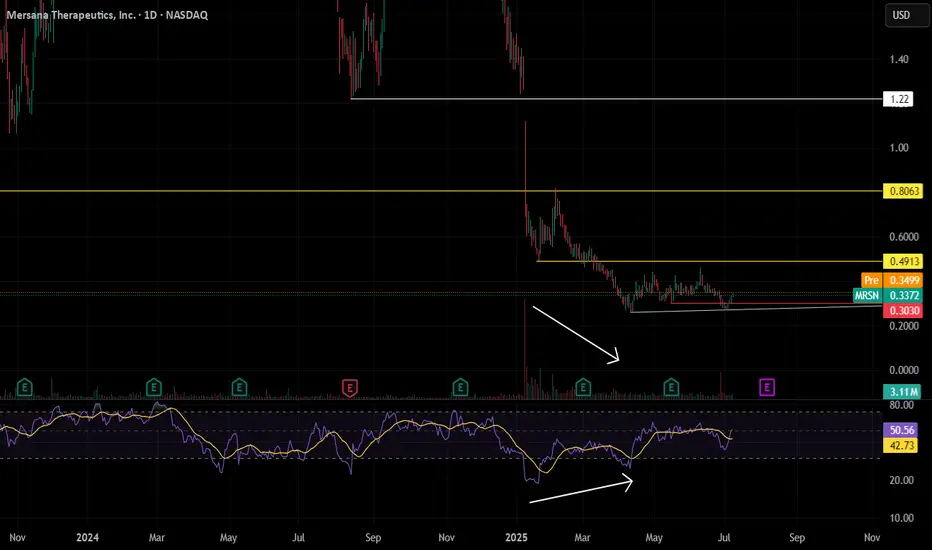
MRSN MRSN is exhibiting a positive divergence followed by a consolidating sideways movement.
The initial target is 0.491, followed by 0.806
This stock has the potential to move rapidly above $1
Importantly, set a stop loss at 0.2999
Royal Gold (RGLD) Poised for Growth with $3.5B Sandstorm Acq.🚀 **Royal Gold (RGLD) Poised for Growth with $3.5B Sandstorm Acquisition!** 🥇
Royal Gold ( NASDAQ:RGLD ) is making waves with its $3.5B all-stock acquisition of Sandstorm Gold ( NYSE:SAND ) and a $196M cash buyout of Horizon Copper, announced July 7, 2025. Here’s why this could be a game-changer for investors! 📈
**🔥 Financial Highlights:**
- **Q2 2025 Performance**: Sold 40,600 GEOs at $3,248/oz gold, $32.91/oz silver, with an impressive 87% gross margin. $11.1B market cap reflects strength. 💰
- **Acquisition Impact**: Sandstorm deal adds 40 producing assets, boosting 2025 GEO production by 26%. Expect revenue & earnings growth post-Q4 2025 close. 🚀
- **Dividend Confidence**: Declared $0.45/share Q3 dividend, signaling robust cash flows. 💸
**📊 Sector Edge & Valuation**:
- **Undervalued?** Compared to Wheaton ($56B) & Franco-Nevada ($44B), Royal Gold’s lower valuation (per RBC Capital) could signal a bargain. Post-deal scale (75% gold revenue) may close the gap. 📉
- **Performance**: Sandstorm’s record Q1 2025 results + Royal Gold’s aggressive expansion outpace peers in growth potential. 🚀
**⚠️ Risks to Watch**:
- 6%–8.5% stock dip post-announcement reflects dilution fears (~19M new shares). 📉
- Commodity price volatility & regulatory approvals (due Q4 2025) pose risks. ⚖️
**🎯 SWOT Snapshot**:
- **Strengths**: Enhanced portfolio, 87% margins, leading North American royalty player.
- **Opportunities**: Analyst optimism (BMO $197 target) & copper exposure via Horizon.
- **Weaknesses**: Short-term dilution concerns.
- **Threats**: Commodity price swings, peer competition.
**💡 Why Buy Now?**
Royal Gold’s stock dip could be a buying opportunity, with analysts like BMO ($197 target) and unusual options activity signaling confidence. If precious metals stay hot ($3,342.80/oz gold futures), RGLD’s diversified portfolio could shine! 🌟
📅 **Deal Close**: Q4 2025, pending approvals.
🔎 **Dive Deeper**: Check Royal Gold’s IR page or Yahoo Finance for details.
What’s your take on NASDAQ:RGLD ’s big move? Bullish or cautious? 🐂🐻 #StockMarket #Gold #Investing

QSI - grinding upQSI is showing an upward trend, accompanied by a gradual increase in volume
The initial target is set at 2.43. If it closes with strong volume, the subsequent targets are 3.79 and then 5.33
My stop loss will be triggered if it closes below the orange trend line, which is around 1.70

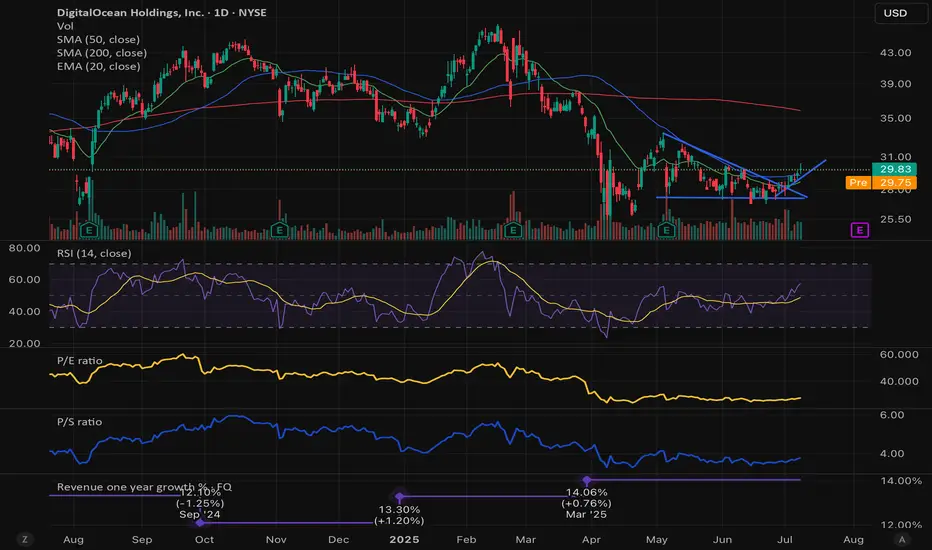
DOCN is taking offGreat value, IMO the safest bet on AI infrastructure. With forward P/E 15X, ARR 2.5X and elevated short interest. Holding
Tempus AI getting some firepowerLooks like we have got support here at $57 area. MACD looking good and overall structure points to further upside. First target $69. If it pushes through then final target $78.

Steal the Breakout: Broadcom Bulls Are In!💎🔓 "Broadcom Break-In: Bullish Vault Raid in Progress!" 🔓💎
🌟Hi! Hola! Ola! Bonjour! Hallo! Marhaba!🌟
Dear Money Makers & Market Robbers 🤑💰✈️,
It’s time for a high-stakes raid on BROADCOM, INC (AVGO) — all based on our secret Thief Trading Strategy™, combining sharp technicals & a sniff of fundamentals.
🕵️♂️ Mission Brief:
Our target is the Bullish Vault – a swing/day trade play with upside momentum. The chart reveals a possible trap at overbought zones where unsuspecting bears get lured in... and we walk out rich! 😏💸
🎯 The Heist Blueprint:
📥 Entry (Buy-In Point):
🚪 “The vault’s open – grab the bullish bags!”
Swipe any bullish setup on the 15m/30m timeframe
Ideal: Buy Limit near recent swing low (support levels)
📳 Set alerts to stay ready – we rob smart, not fast
🛑 Stop-Loss (Escape Plan):
Place SL below recent 30m swing low — approx. 269.00
Adjust by your lot size & number of trades
Don't risk the whole bag – we ain't greedy thieves 😈
📈 Target (Take-Profit Point):
🎯 First Exit Zone: 296.00
💨 Or vanish before the cops (market reversal) arrive
🧲 Scalpers’ Secret:
Only scalp long – don’t fight the bullish flow
Got big capital? Enter early. Small bag? Join the swing crew
Use Trailing SL to guard your stolen gains 🏦🔐
💡 Behind the Heist:
AVGO is showing bullishness thanks to:
📰 Macro Drivers • COT Reports • Institutional Bias
📊 Sentiment Analysis • Index Correlations
💥 Geopolitical Developments – Always stay updated
🔎 Want more intel? Dive into the news, fundamentals, & positioning data that power this trade idea 💣
⚠️ Trade Smart, Thieves:
📛 News events cause chaos – avoid fresh entries during releases
📉 Use trailing stops to secure your loot & dodge slippage
💖 Like the Heist Plan? Hit Boost!
Let’s build the most notorious money-making crew on TradingView! 🚀
Daily gains using the Thief Style™ – not for the faint-hearted.
🔒 Stay sharp, trade like a phantom, and keep stacking that digital cash!
💬 Drop a comment if you’re in the gang – another plan’s coming soon! 🤑🐱👤
📌 Note: This is a general market analysis. Do your own due diligence before risking real capital.
📌 Stay updated — the market changes fast. Adapt or get trapped.

CRC | Long | Strong Cash Flow | (July 2025)CRC | Long | Strong Cash Flow & Carbon Transition Story | (July 2025)
1️⃣ Short Insight Summary:
CRC is showing solid momentum as it combines strong cash flow from oil & gas with an expanding carbon capture strategy. Price action suggests a possible breakout on its second attempt at resistance.
2️⃣ Trade Parameters:
Bias: Long ✅
Entry: Watching current resistance zone closely on the 4-hour chart; money inflows confirmed on daily.
Stop Loss: Around $44 (invisible stop loss level to manage risk).
TP1: $53 💰
TP2: $57 💰
Partial Exits: Letting a portion run towards $63 for extended upside potential.
3️⃣ Key Notes:
We see strong institutional support, recent acquisition synergies from Aera Energy, and potential tailwinds from the Carbon TerraVault (CTV) project. Watch for volume confirmation and the upcoming Q2 earnings report on August 5, which could act as a catalyst. Be cautious of commodity price volatility and regulatory timelines for CCS projects.
4️⃣ Optional Follow-up Note:
Will monitor closely and share updates as the trade develops, especially if earnings significantly shift sentiment.
Please LIKE 👍, FOLLOW ✅, SHARE 🙌 and COMMENT ✍ if you enjoy this idea! Also share your ideas and charts in the comments section below! This is the best way to keep it relevant, support us, keep the content here free and allow the idea to reach as many people as possible.
Disclaimer: This is not a financial advise. Always conduct your own research. This content may include enhancements made using AI.

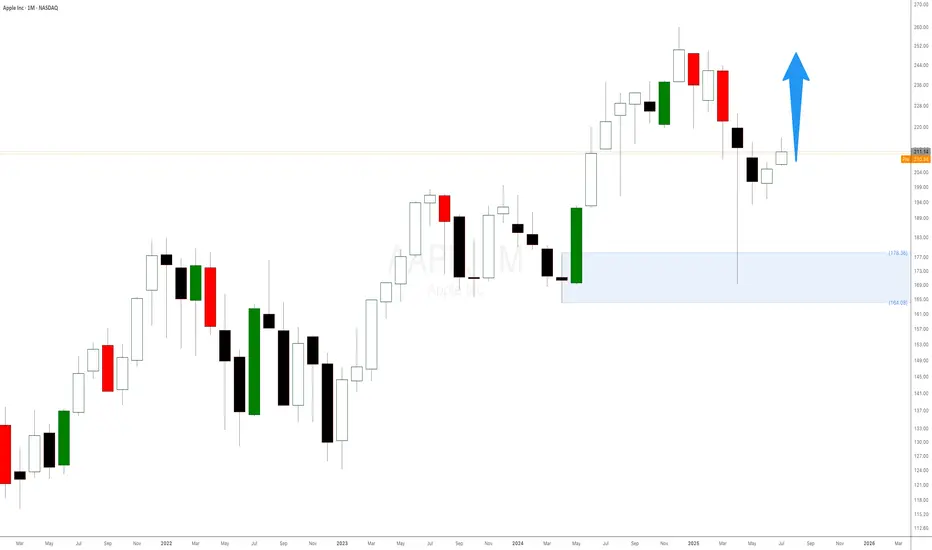
Apple Stock Is Surging! Here’s What Most People MissWhen it comes to trading, we don’t care about the latest news headlines or whether some analyst has upgraded or downgraded Apple stock. We focus on one thing and one thing only: the undeniable forces of supply and demand imbalances on higher timeframes.
Right now, Apple’s monthly chart is a textbook example of how waiting for a strong demand imbalance pays off. That $178 monthly level is no random number. It’s the exact origin of a massive bullish impulse that happened in June 2024 — the kind of move that only happens when smart money and big institutions step in, creating an imbalance that pushes the price away rapidly.
📈 It’s Not About Fundamentals. It’s About Imbalances.
Most retail traders waste time chasing news, earnings, or rumours about iPhone sales. But if you think about it, all those factors are already priced in once a strong imbalance is formed. Institutions don’t wait for tomorrow’s news — they plan their positions weeks or months ahead, and those footprints are visible right on your chart.
The $178 level indicates a significant drop in supply and a surge in demand large enough to propel Apple higher, marked by consecutive large bullish candlesticks. That’s our signal — nothing more, nothing less.
NVIDIA: Sell ideaSell idea on NVIDIA as you can see on the chart if only and only if we have the breakout with force the support line and the vwap indicator by a big red candle follow by a large red volume.

Nvidia Market Capitalisation Reaches $4 TrillionNvidia Market Capitalisation Reaches $4 Trillion
Yesterday, Nvidia’s (NVDA) share price surpassed $162 for the first time in history. As a result, the company’s market capitalisation briefly exceeded $4 trillion during intraday trading (according to CNBC), making Nvidia the first publicly listed company to reach this milestone.
The rise in NVDA’s share price is being driven by both bullish sentiment across the broader equity market—which appears optimistic ahead of the upcoming Q2 earnings season—and evidence of sustained demand for Nvidia’s products, as artificial intelligence technologies continue to gain widespread adoption.
Noteworthy developments include:
→ Nvidia may begin producing a specialised AI chip for the Chinese market this autumn, potentially circumventing current export restrictions;
→ Perplexity, a company backed by Nvidia, is launching an AI-powered browser aimed at competing with Google Chrome.
Technical Analysis of NVDA Chart
In our previous analysis of NVDA’s price action, we:
→ Drew an ascending channel;
→ Highlighted bullish conviction in overcoming the $145–150 resistance zone.
The channel remains valid, with the current price trading near its upper boundary. However, the RSI indicator is showing signs of bearish divergence, suggesting that the stock may be vulnerable to a near-term correction—potentially towards the median line of the existing upward channel.
At the same time, a major shift in the prevailing bullish trend appears unlikely. The $145–150 range may serve as a key support zone for NVDA in the foreseeable future.
This article represents the opinion of the Companies operating under the FXOpen brand only. It is not to be construed as an offer, solicitation, or recommendation with respect to products and services provided by the Companies operating under the FXOpen brand, nor is it to be considered financial advice.
