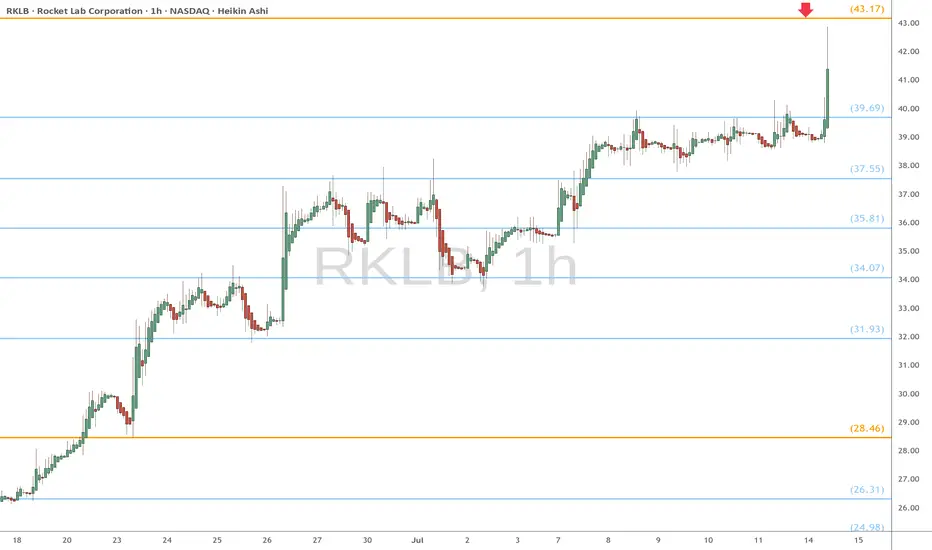
RKLB heads up at $43.17: Golden Genesis fib may knock it downRKLB has been rocketing upward from $4 to $43.
It is about to hit a Golden Genesis fib at $43.17
Expectng a dip from it, or a few orbits at least.
How expensive is Nvidia today?How expensive is NASDAQ:NVDA today?
❗ You're paying $40 today for $1 of next year's earnings
That's what Nvidia's forward P/E 40x means at current $172 per share
AI might be the future but you're prepaying for it like it's 2060 🤖

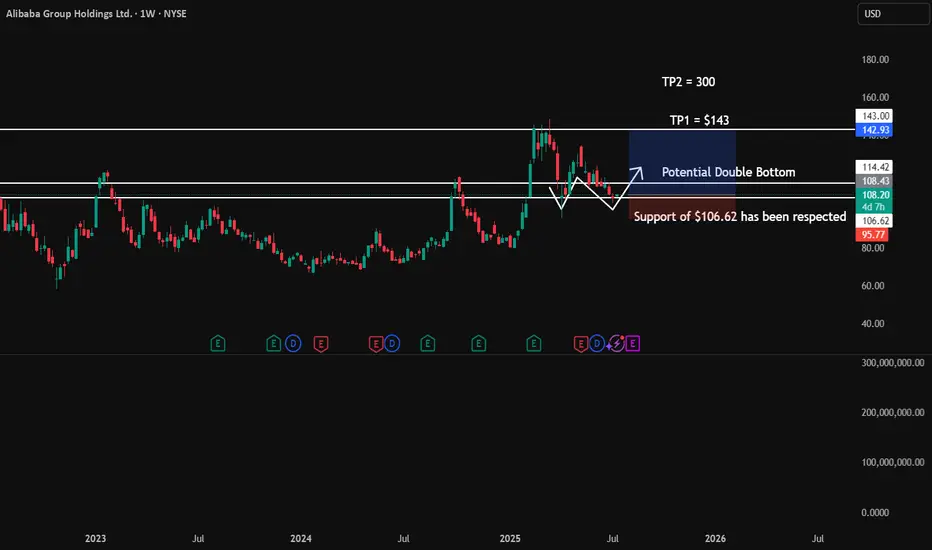
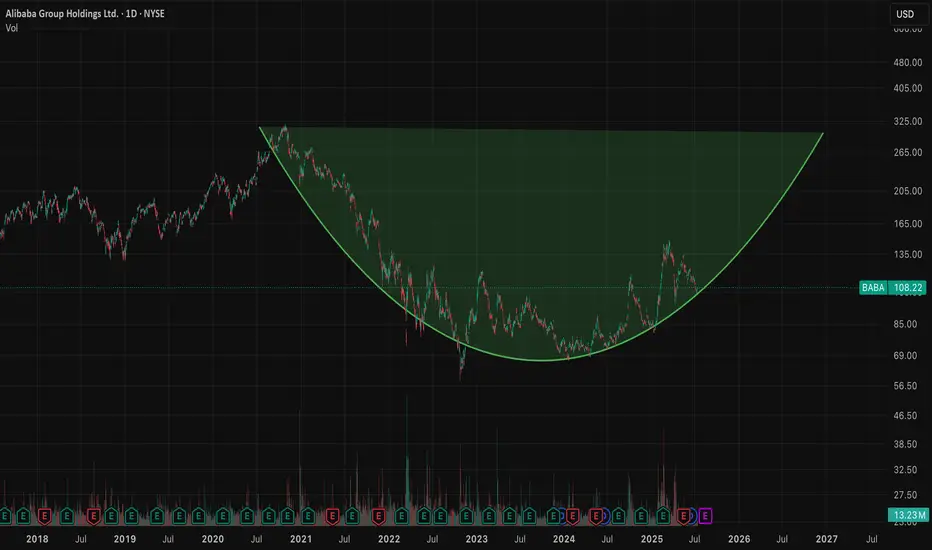
BABA longPotential double bottom to be formed on the Weekly TF.
I think well into Aug and Sept, this will mature.
$143 is a key price value zone.
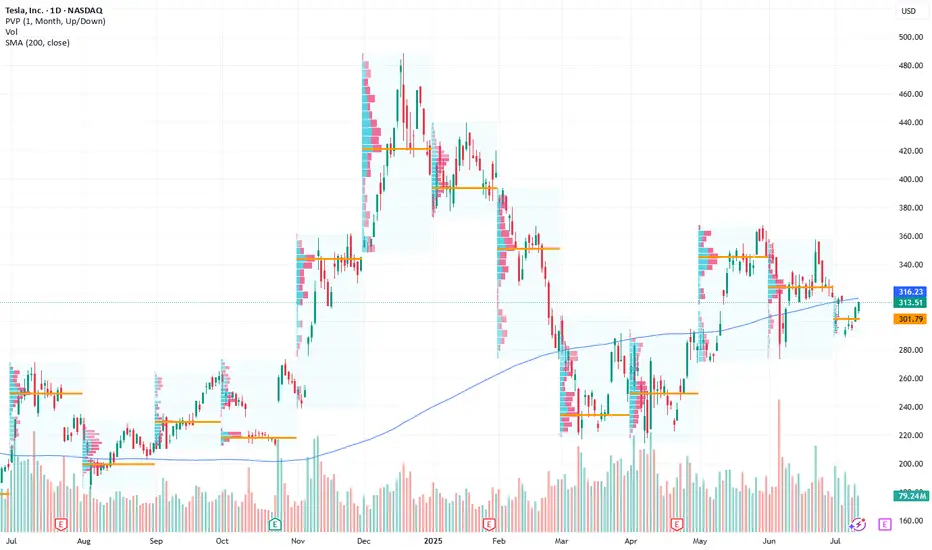
Tesla’s Next Move: Bullish Play Amid AI and Volatility Current Price: $313.51
Direction: LONG
Targets:
- T1 = $319.00
- T2 = $329.15
Stop Levels:
- S1 = $307.75
- S2 = $303.60
**Wisdom of Professional Traders:**
This analysis synthesizes insights from thousands of professional traders and market experts, leveraging collective intelligence to identify high-probability trade setups. The wisdom of crowds principle suggests that aggregated market perspectives from experienced professionals often outperform individual forecasts, reducing cognitive biases and highlighting consensus opportunities in Tesla.
**Key Insights:**
Tesla’s recent AI innovation and its expanding robo-taxi footprint signal long-term growth potential while short-term volatility requires strategic entry points. Market sentiment has significantly improved with positive news about the integration of Gro 4 AI, enhancing Tesla’s autonomous vehicle advancements. Trading at critical levels, Tesla offers a potential buying opportunity near key support zones.
The rallying investor focus on Tesla’s technological edge places it among the leaders in automation-driven growth. Despite macroeconomic pressures, Tesla’s proactive efforts in leveraging cost efficiencies and scaling autonomous solutions are helping to sustain bullish momentum.
**Recent Performance:**
Tesla demonstrated notable resilience during a turbulent earnings season, holding strong amidst mixed market signals. Recent delivery figures reflected a 13% year-over-year decline, which stirred concerns. Yet, the stock was buoyed by positive AI-related news and the market-wide optimism surrounding automation technologies, enabling Tesla to maintain its pivotal price range.
**Expert Analysis:**
Analysts acknowledge Tesla’s robust innovation pipeline centered around driver assistance and robo-taxi functionality powered by the Gro 4 AI platform. Concerns related to Elon Musk’s focus and governance have tempered enthusiasm for some traders, but these have largely been offset by Tesla’s strategic actions to sustain revenue and growth. Tesla’s prominent role in setting the market narrative for autonomous vehicles and broader EV adoption ensures ongoing support from long-term investors.
Tesla’s recent moves are growing investor confidence as it seeks to hedge against broader economic uncertainties and mitigate risks around regulatory changes. Its expansion strategy continues to highlight its leadership within the EV space, while early adopters of its AI-driven solutions may set the pace for sustainable revenue expansion.
**News Impact:**
The integration of Gro 4 AI is expected to significantly enhance Tesla’s robo-taxi and autonomous vehicle functionality, enabling it to capture market share in urban mobility services. Tesla’s announcement of an expanded robo-taxi fleet targeting key metropolitan areas could help offset delivery declines and drive future recurring revenues. While concerns about Elon Musk’s governance persist, ongoing innovation continues to support Tesla’s bullish outlook in global EV markets.
**Trading Recommendation:**
Tesla’s current price action signals an advantageous entry point for a long position, reinforced by recent bullish news and industry-leading innovations. Short-term traders can target $319.00 and $329.15 while maintaining disciplined stop-loss levels at $307.75 and $303.60. With strong support from institutional sentiment and expanding AI applications in its product line, Tesla offers substantial upside for bullish investors.
Potential 23% Move in TSSIThere is a high change of reversal in TSSI. This is due to a number of factors:
1. Both the 30min and 150min time frames are showing that the price is overextended to the downside on the custom Data Distribution script. (Yellow dots)
2. The custom USI script has shown a buy signal on the 30min chart. (Background changed to green)
3. There was a good reversal candle on the 30min chart.

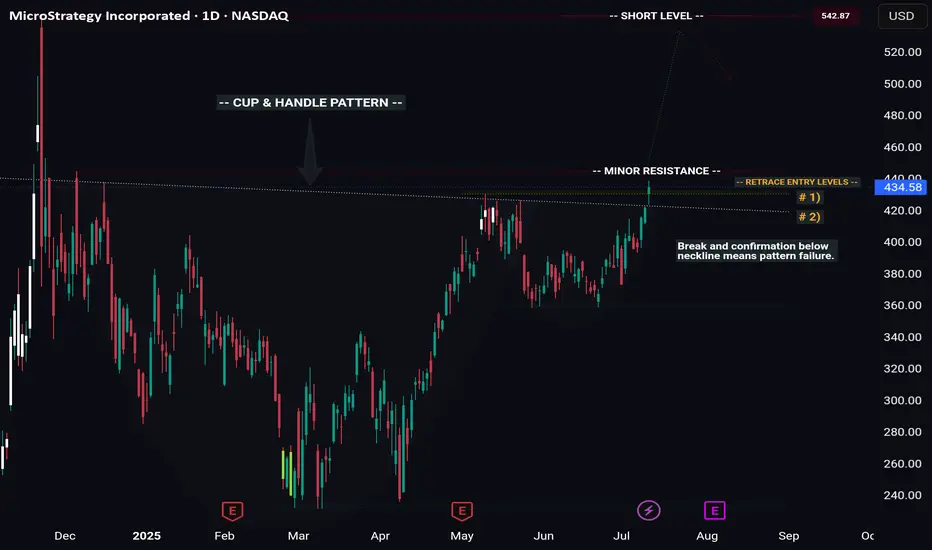
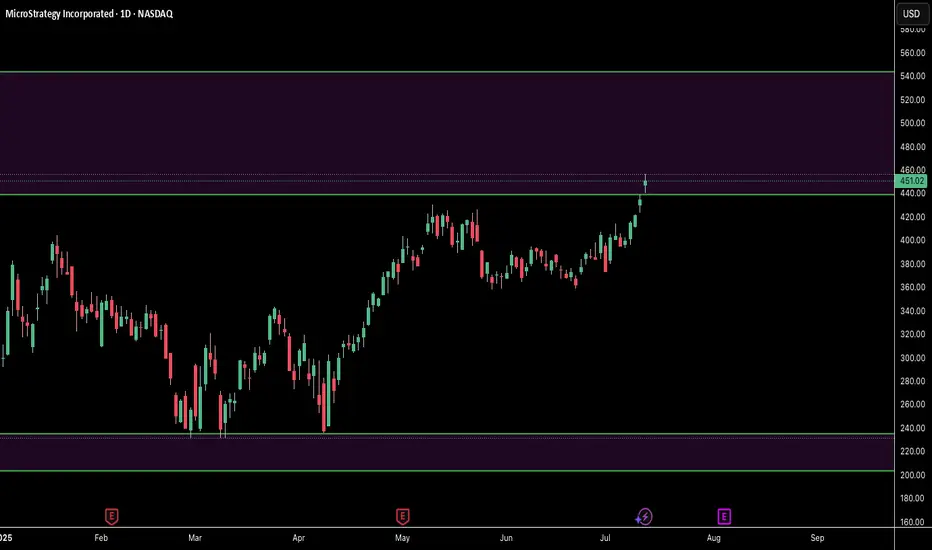
MSTR -- Cup & Handle Breakout // Long & Short SetupsHello Traders!
There is a beautiful cup and handle pattern that has formed on MSTR (Microstrategy).
This pattern offers us a wonderful long setup, as well as a potential short at the all time high.
Pattern Failure: If price both breaks and confirms below the C&P neckline the pattern is void.
Price will likely temporarily pull back from the all time high, giving us our short setup. However you'll want to be in and out quick considering price will likely continue to new highs after pulling back.
I will be swing trading the long setup and likely day trading the short setup.
Have fun and best of luck to everyone on their trading journey!
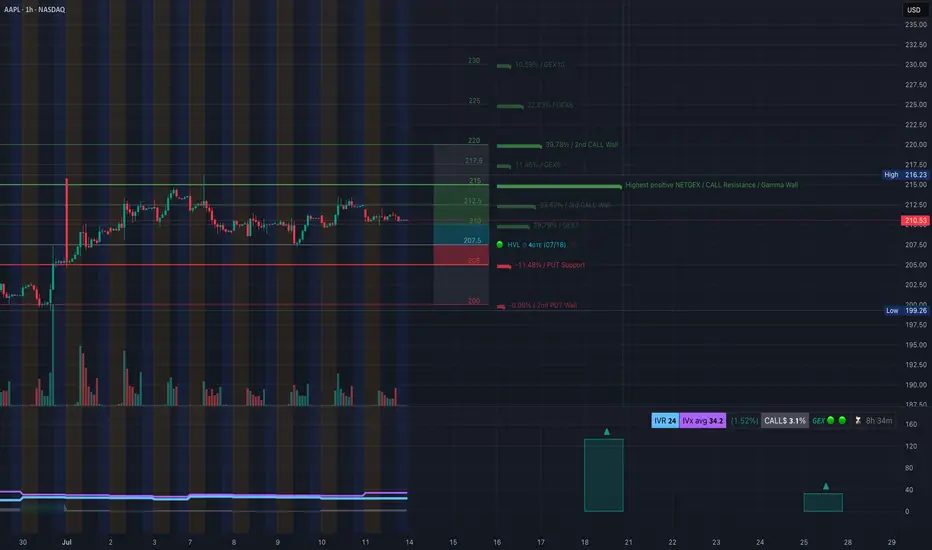
AAPL at a Pivotal Zone! TA for July 14AAPL at a Pivotal Zone! GEX & Price Action Align for Major Move 📉📈
🧠 GEX Sentiment (Options-Based Insight)
* Current Price: $210.53
* GEX Zone Traps:
* Below Price:
* 🟥 Put Support at $205 (-11.48%)
* 🔻 PUT Wall at $200 (-9.06%) — strong floor
* Above Price:
* 🟩 CALL Walls at:
* $212.5 → 29.79% GEX7
* $215 → 38.62% GEX6 (3rd largest resistance)
* $217.5 → 11.45% GEX9
* $220 → 39.78% GEX2 (heavy resistance zone)
* 🟩 Max GEX Cluster: $215–$220
* 🔺GEX10 spike at $230 → unlikely unless squeeze
* IVR/IVX:
* IVR: 24 (low volatility environment)
* IVX: 34.2 → Soft volatility bounce
* Call/Put Flow:
* Calls: 3.1% favored
* GEX trend: 🌕🌕🌕 (Neutral-to-Bullish if over $212.5)
📦 Interpretation:
Gamma compression is strong near $212.5–$215. If AAPL stays above $210.5 and reclaims $212.5, options market opens up space toward $217.5–$220. Below $207.5 = risk of drop toward $205 then $200 PUT wall.
🕹️ Option Trade Ideas Based on GEX
Bullish Strategy (IF Breaks $212.5):
* Trade: Buy AAPL 215c or 217.5c (Jul 19 or 26 expiry)
* Trigger: Hold above $212.5
* Target: $217.5–$220
* Stop: Break below $209.8
Bearish Strategy (IF Breaks $207.5):
* Trade: Buy AAPL 205p or 200p (Jul 19 or 26 expiry)
* Trigger: Loss of $207.5 with momentum
* Target: $205 → $200
* Stop: Reclaim of $210.5
🔍 1-Hour Chart Analysis (Price Action)
* Structure: Sideways consolidation between $207.5–$213.5
* Key Levels:
* Demand: $205–$207.5 (Buyers defended)
* CHoCH (Change of Character) confirmed near $209.8
* Resistance: $213.48 (rejected multiple times)
* Trendline: Rising wedge forming under liquidity sweep zone
* Liquidity Pools: Resting above $215 and below $205
* FVG/OB Zones: Thin FVG at $209.8–210.5 and mid OB around $207
📈 Scenario 1 (Bullish):
* If price bounces off $210 again and breaks $212.5 with volume, watch for sweep of $215–$217.5
* Watch for re-entry above CHoCH/BOS confluence near $211.5
📉 Scenario 2 (Bearish):
* If we break $207.5 and fail to reclaim $210.5 → liquidity vacuum opens toward $205 and $200
✅ My Thoughts & Suggestions
* Direction Bias: Neutral > Bullish if $212.5 is claimed, otherwise range-bound.
* Best Risk/Reward: Wait for $212.5 breakout confirmation OR $207.5 breakdown.
* Scalpers: Use $210.5–212.5 as chop zone — fade edges.
* Swing Traders: Only enter on clear breakouts with stop discipline.
🔒 Disclaimer:
This analysis is for educational purposes only and does not constitute financial advice. Always do your own research and manage your risk before trading.
SMCI: Watching Monitoring price action closely. Momentum remains positive, and volume is supportive of continuation. Awaiting confirmation before entering, but setup favors a potential move higher.

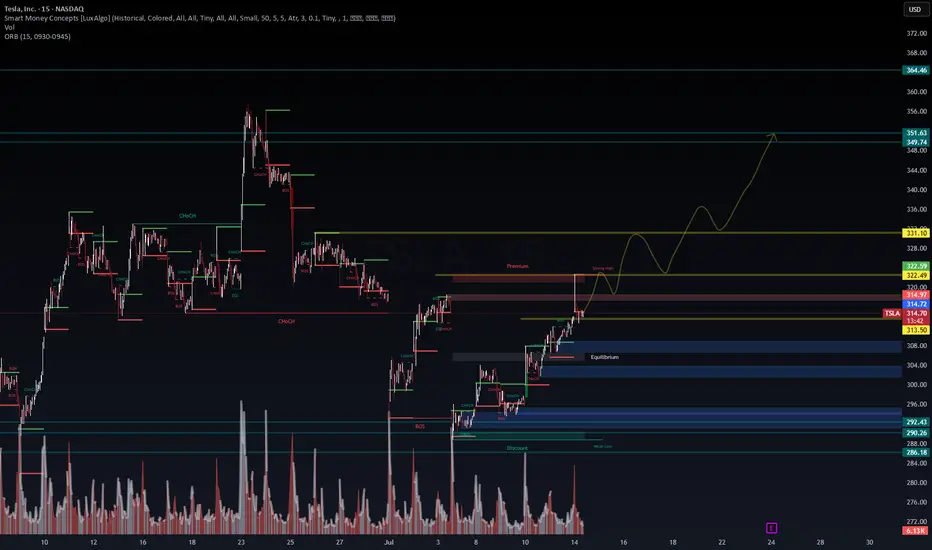
TSLA | Breakout Fuel Loaded – Will the Trend Accelerate Toward 🚗 TSLA | Breakout Fuel Loaded – Will the Trend Accelerate Toward $350?
🔍 Chart Type: 15m
🧠 System: Smart Money Concepts (LuxAlgo) + WaverVanir DSS
📊 Volume: 2.08M
🧭 Narrative: Liquidity Engine + Bullish Flow Momentum
📈 Current Price: $314.78
Clean breakout above BoS and ChgofCHoCH
Currently testing Strong High within a defined Premium Zone
EMA Stack (20/50/100/200) is bullishly aligned
📌 Key Levels to Watch:
📍 Premium Resistance: ~$315–$318
⚖️ Equilibrium Support: ~$309
💧 Discount Liquidity Zones: $292.43, $290.26
🚀 Upside Targets:
Minor: $322.49
Mid: $331.10
Major: $349.74 → $351.63 (projected wave peak)
📈 Bullish Case (Preferred by DSS Flow Model):
Retest of strong high → rally toward $322 then $331
Momentum and volume support trend acceleration
Break of $331 opens path toward $349.74–$351.63 (final wave)
📉 Bearish Invalidator:
Break below equilibrium ($309) → Discount zone retest
Watch $292–$286 for final liquidity sweep if rejection occurs
📅 Catalyst:
Earnings (📦 E icon marked) + macro tech sentiment could ignite explosive continuation
Market structure favors liquidity vacuum toward premium targets
🧠 VolanX DSS Sentiment: STRONG BULLISH
✅ Structure: Uptrend
✅ Volume: Expanding
✅ Momentum: Aligned
🟡 Risk: Premium rejection short-term possible
🔁 Executed via VolanX AI Scanner + WaverVanir DSS Engine
📊 “The Edge Is a System. The System Is Intelligence.”™
#WaverVanir #TSLA #SmartMoneyConcepts #PriceAction #LiquidityZones #Tesla #TechnicalAnalysis #VolanX #InstitutionalEdge #AITrading #QuantFinance
Nvidia at a CrossroadsNvidia at a Crossroads: Unstoppable Growth, Geopolitical Tensions, and Fears of Talent Drain to China
Ion Jauregui – Analyst at ActivTrades
Nvidia’s rise as a central player in the artificial intelligence revolution has not been a solitary journey. The company, now valued at over $4 trillion, has built a complex network of suppliers, strategic clients, and industrial partners that fuel its growth. However, this success has also placed the firm under the scrutiny of U.S. authorities, especially amid growing fears of knowledge transfer to China.
Washington on Alert: National Security Risks?
The U.S. government has begun to closely monitor the hiring of foreign talent in strategic sectors. One of its main concerns is the potential unintentional transfer of advanced military knowledge to China through engineers working at companies like Nvidia. The company’s chips power everything from data centers to autonomous systems, and part of its strength lies in the know-how contributed by its employees—many of whom are of Asian descent—to the development of these key technologies.
Although the company benefits enormously from hiring highly skilled engineers—many of them trained in U.S. universities—there is concern in Capitol Hill and the Pentagon that some of these specialists, directly or indirectly, could end up collaborating with China’s People’s Liberation Army. The U.S. Department of Commerce and the Pentagon have increased scrutiny of technical staff with links to China, particularly after identifying several cases of dual-nationality engineers involved in sensitive projects. According to intelligence sources cited by outlets such as Bloomberg and The Washington Post, internal investigations have been launched to review hiring policies at key semiconductor companies. There is concern that without stricter measures, U.S. technological know-how—especially related to dual-use civilian-military GPUs—could leak and accelerate the development of Chinese military capabilities, including AI for warfare.
The Ecosystem Powering Nvidia
Nvidia does not manufacture its own chips: it relies primarily on Taiwan Semiconductor Manufacturing Company (TSMC), which produces its most advanced units—such as the H100 and the new B200 Blackwell chips—using 3 and 4 nanometer processes. Pressure from the U.S. government to relocate production led TSMC to build a factory in Arizona as a geostrategic response to ensure supply on American soil.
Additionally, companies like SK Hynix, Micron, Wistron, and Flex form a key supply chain, providing everything from HBM memory to full system assembly. In parallel, Nvidia has accelerated development of the HBM4 chip amid growing competition from new players such as AMD and AI divisions of Chinese firms.
An AI-Powered Empire: Voracious Clients and Strategic Alliances
Meanwhile, Nvidia’s rise has been meteoric. From a napkin sketch in 1993 to a market cap surpassing $4 trillion, the company has gone from revolutionizing video games to becoming the heart of artificial intelligence. The key lies in its GPUs (such as the H100 and the new B200), which power language models like ChatGPT and Llama-4.
Its supplier network includes TSMC, SK Hynix, Micron, and Wistron, while on the demand side, Microsoft, Meta, Amazon, Alphabet, and Super Micro are among the giants boosting its revenue. In fact, Microsoft alone accounts for nearly 19% of Nvidia’s revenue. Microsoft leads with over $29 billion invested, while Meta allocates more than 9% of Nvidia’s total revenue to training its Llama-4 model. Even Amazon, which develops its own Trainium and Graviton chips, continues to purchase Nvidia GPUs due to high customer demand for cutting-edge products.
Now, all hopes are pinned on the new generation of Blackwell chips. The B200 promises performance up to 30 times higher than the H100 in generative AI tasks, positioning it as the new industry standard. But as the market matures, competition, regulation, and geopolitical risks are all intensifying.
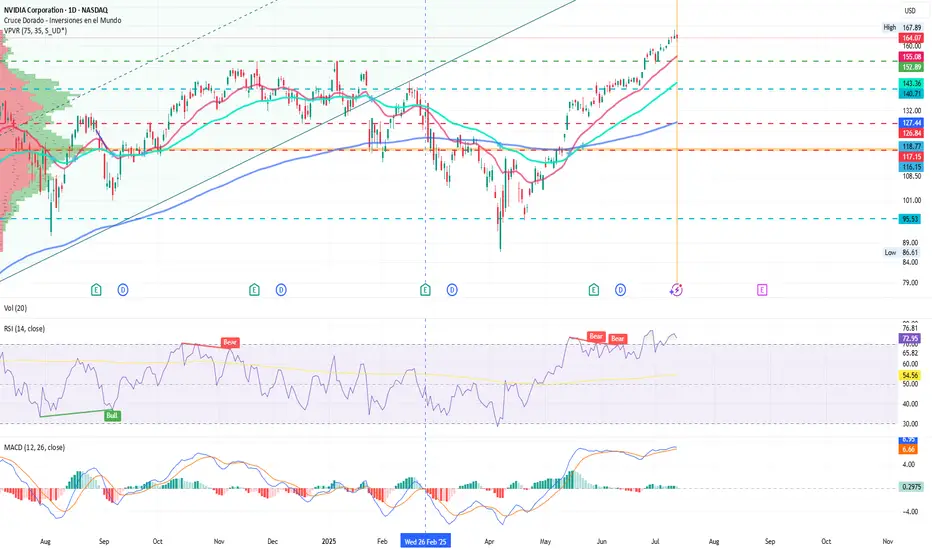
Technical Analysis of Nvidia (NVDA)
Nvidia (NVDA) shares closed yesterday at $164.07, slightly below its all-time high of $167.89. On the daily chart, we observe a consolidation movement after hitting a new record high on Friday. The price remains within an upward channel that began in January 2024.
Key Support: $141.75 (above the 50-session moving average), a level defended by buyers during recent pullbacks.
Immediate Resistance: $167.89 (all-time high). A breakout with volume could open the door to $180 as the next psychological target.
Technical Indicators:
The daily RSI stands at 72.95%, reflecting strong overbought conditions and suggesting continued buying interest.
The moving averages remain in a wide bullish crossover, with no clear sign of directional reversal.
The volume point of control (POC) sits at $118, at the lower end of the consolidation zone.
The MACD continues in a bullish crossover pattern, although it’s starting to show a loss of momentum. This could signal that the price push is weakening, indicating a bearish divergence between price and volume.
The technical outlook remains bullish, but a short-term pause or sideways movement is not out of the question—especially if regulatory pressure or the next quarterly results fail to meet high market expectations. The key level to watch is around $141 as the structural support to maintain the uptrend.
The Future? A Mix of Innovation and Oversight
Nvidia embodies the spirit of Silicon Valley, but its privileged position also makes it a central piece on the global geopolitical chessboard. While its technology drives scientific, medical, and consumer advancements, its ties to Asia and openness to foreign talent will continue to spark friction with Washington.
The big question is whether it can continue to lead the AI race without destabilizing the delicate balance between national security and technological innovation. Time—and the regulators—will tell.
*******************************************************************************************
The information provided does not constitute investment research. The material has not been prepared in accordance with the legal requirements designed to promote the independence of investment research and such should be considered a marketing communication.
All information has been prepared by ActivTrades ("AT"). The information does not contain a record of AT's prices, or an offer of or solicitation for a transaction in any financial instrument. No representation or warranty is given as to the accuracy or completeness of this information.
Any material provided does not have regard to the specific investment objective and financial situation of any person who may receive it. Past performance and forecasting are not a synonym of a reliable indicator of future performance. AT provides an execution-only service. Consequently, any person acting on the information provided does so at their own risk. Political risk is unpredictable. Central bank actions can vary. Platform tools do not guarantee success.
Trade Idea: $HOOD – $106C by 7/25 | Bullish Setup🧠 Thesis:
After topping out at $100, NASDAQ:HOOD pulled back ~10%. I believe this recent pullback sets up a healthy base for a continuation move back toward $100+ in the coming sessions. If momentum kicks in, we could see a push toward the $106 level by expiration.
📊 Key Levels:
Resistance: $95.60 → $97.34 → $99.77 → $102 → $106
Support: $94.00 (uptrend line), $92.97 (higher low), $90.97 (must hold for bulls)
📌 Trade Strategy:
I'm scaling into the $106 Calls expiring 7/25.
Looking for:
A breakout above $97.34 to trigger upside momentum
Profit-taking zones around $99.77 and $102
Final target near $106 (ITM zone)
Risk is managed below $92.97.
🧭 Notes:
Watching broader market sentiment and NASDAQ:QQQ correlation closely. Volume confirmation will be key on any breakout attempts.

BABA – Dollar Cost Averaging Opportunityhi Traders,
Let's have a look at BABA.
Alibaba (BABA) appears to be approaching the end of its correction phase within a well-defined ascending channel. Based on the current price action and technical setup, we believe now is a good time to begin dollar cost averaging into this stock.
Our identified buy zone lies between $108 and $100, where price intersects the lower trendline support and key EMAs (20/50/100/200). This area offers a strong risk-reward setup for medium- and long-term investors.
The mid-term target for this trade is $160, which aligns with the upper channel resistance and previous price structure. However, from a long-term perspective, we anticipate that BABA will resume its growth trajectory and eventually surpass its previous all-time highs.
Supporting this idea, the RSI is stabilizing in neutral territory, suggesting that momentum is resetting and may shift bullish as price finds support.
Summary:
🔁 Strategy: Dollar cost averaging
🟩 Buy zone: $108 – $100
🎯 Mid-term target: $160
🚀 Long-term view: Return to growth and new ATH
📉 Correction nearing completion; bullish structure remains intact
This setup offers an attractive entry point for patient investors aiming to ride the next major upside cycle in Alibaba.

MSTR returning to ATHMSTR returning to ATH. Will MSTR continue or not? MSTR returning to ATH. Will MSTR continue or not?MSTR returning to ATH. Will MSTR continue or not?MSTR returning to ATH. Will MSTR continue or not?MSTR returning to ATH. Will MSTR continue or not?MSTR returning to ATH. Will MSTR continue or not?MSTR returning to ATH. Will MSTR continue or not?
MP eyes on $49.43: Golden Genesis fib stopped the news spikeMP is now partially owned by the DOD, which spiked the price.
That massive move smacked into the Golden Genesis at $49.43
Look for a Break-n-Retest for idea long, or Dip-to-Fib below.

NVDA GEX Options Sentiment Analysis for July 14🧠 GEX Breakdown
* Key Gamma Resistance (Call Wall):
* $164.94 → Highest NET positive GEX (Gamma Wall) – Major resistance where market makers start hedging against further upside.
* $167.89 (local high) → aligns with 1st rejection wick.
* $170 → 2nd CALL Wall (67.29%) – max squeeze potential if $165 breaks with volume.
* Call Side Build-up:
* $167 – 20.62%
* $170 – 67.29%
Stacked CALL walls above = gamma trap if breached, but tough resistance ahead.
* Put Support Walls:
* $152.50 – Strongest downside gamma support
* $148–149 – Layered 2nd/3rd PUT Wall zone
📊 Options Flow Insights
* IVR: 5.6 (very low) → cheap premiums, low expected move
* IVX avg: 44.1
* Call/Put Bias:
* Calls: 11.8% dominance
* GEX Sentiment: ⚠️ Bearish Reversal Risk (high call saturation at resistance)
✅ Suggested Option Plays (Based on GEX Only)
🔸Bearish Rejection Play
* If NVDA rejects $164.94–$165.20 zone (Gamma + Supply confluence):
* Buy puts targeting $160 or $158
* Trade idea:
* Buy: NVDA 160p (Jul 19 expiry or same week)
* Entry: If price stalls/rejects $164.90–$165.20
* Target: $161 → $158
* Stop: Close above $166.00
🔸Bullish Gamma Squeeze (Only if $165 Breaks Cleanly)
* If price breaks and holds above $165.50 with strength
* Buy calls targeting $170 (2nd CALL Wall)
* Trade idea:
* Buy: NVDA 170c (Jul 19 or 26 expiry)
* Entry: $165.60+ breakout + strong volume
* Target: $169–$170
* Stop: Below $163.80
🕯 1-Hour Chart – Price Action Analysis
Market Structure
* CHoCH → BOS → BOS → creating a clear bullish leg, but current supply box at $165 is rejecting price short term.
* Trendline support: Still holding from July 8 lows
* Liquidity zone: $160.96–$161.10 (first demand zone)
Current Setup
* Price is hovering under supply zone + GEX wall → indicating indecision or potential short-term top
* MACD weakening + volume declining = possible pause or reversal
* Clean higher-low structure still intact for now
🎯 Trade Plan Based on 1H Chart
🟢 Bullish Intraday Plan
* Entry: $161.00–$160.50 demand block
* Confirmation: Bullish engulfing or rejection wick
* Target: $164.94 then $167
* Stop-loss: Below $159.80
🔴 Bearish Intraday Plan
* Entry: $164.90–$165.20 inside supply
* Confirmation: Weakening candle (doji or long wick) + no breakout
* Target: $161.00 then $158.80
* Stop-loss: Above $166.10
✍️ My Thoughts
NVDA is coiling just under a heavy GEX resistance wall. If $165 can't break, downside correction to $161–$158 is probable. GEX suggests sellers may be in control unless bulls force a gamma squeeze over $165. Stay patient — let the levels react.
This breakdown is for educational purposes only and not financial advice. Always manage your risk.

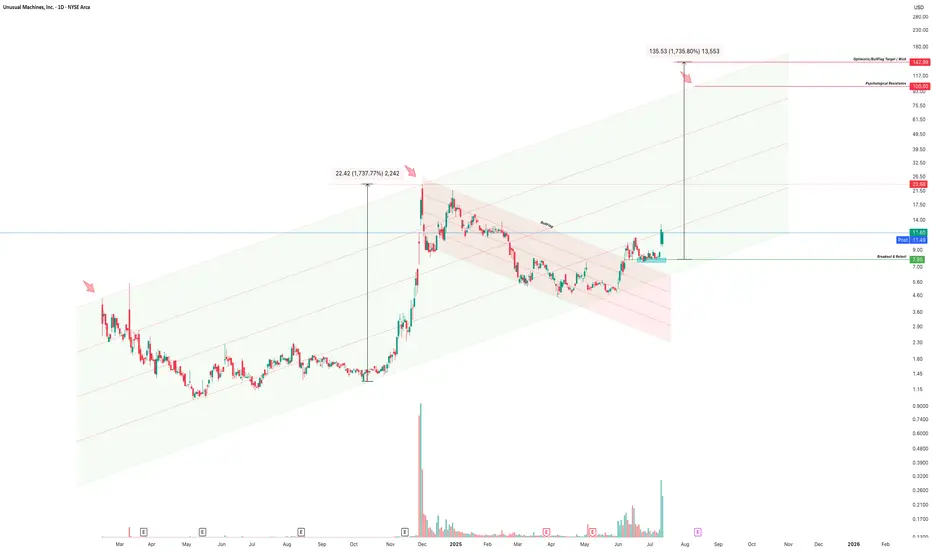
UMAC To the Moon The daily chart of Unusual Machines, Inc. (UMAC) reinforces a bullish breakout continuation setup, A Bullish flag within its rising channel .
🧠 Technical Highlights
Initial Surge: The stock launched from consolidation to a high near $24.00 in late 2024, gaining +1,737% during the move.
Consolidation Phase: The price corrected within a bull flag/descending channel structure (highlighted in red), followed by a breakout above channel resistance.
Breakout & Retest: Price broke out above the $7.80 resistance zone, tested it, and bounced — confirming support conversion. Current price: $11.60.
📏 Measured Move & Channel Analysis
Measured Move: Using the height of the initial rally (22.42 points) and projecting from the breakout zone ($7.80), a bullish price target of $143.34 is calculated — a 1,735% upside.
Bullish Regression Channel: A broader green ascending channel suggests the long-term trend structure remains intact and price may climb along the mid- to upper-channel lines.
📌 Key Resistance Levels
Zone Price Notes
Local Resistance $21.50–$23.68 Former high area from late 2024
Psychological Levels $50 / $100 Round-number zones where traders often react
Optimism/Bull Trap Zone $142.99 Target area where parabolic move may exhaust
✅ Validation Checklist
✔ Breakout above flag/channel with increasing volume
✔ Successful retest of breakout zone (~$7.80)
✔ Trend confirmation with higher highs and volume spike
✔ Clear structure supporting measured move thesis
🧭 Strategy Thoughts
Entry Confirmation: Ideal entry occurred around the breakout/retest near $7.80–$9.00
Risk Management: Protective stop could be placed under $7.00 if newly initiated
Profit Zones: Consider scaling out at $23, $50, $100, and holding a moonshot tranche toward $143
Current market cap = 230M .
A surge to estimated levels would bring this stock up to 5B.
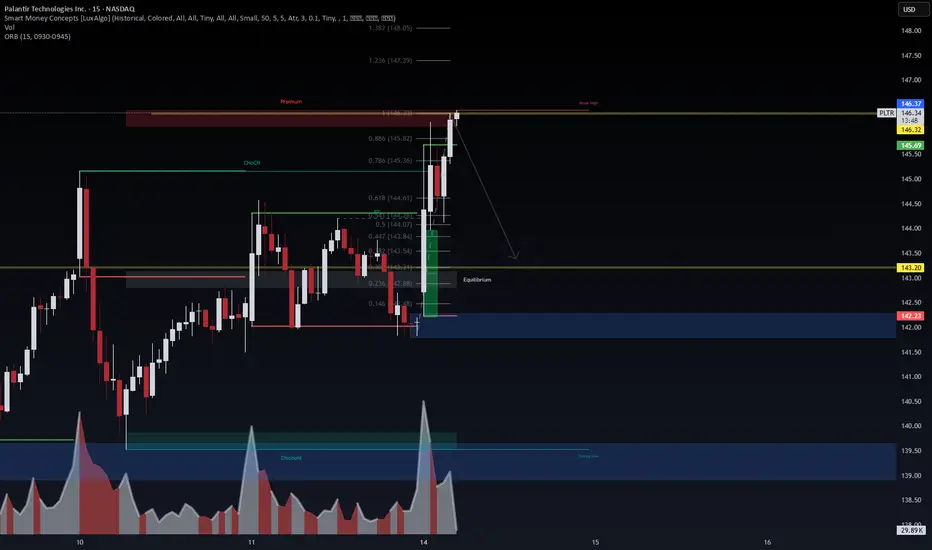
PLTR - Premium Rejection Detected | Bearish Flow Confirms Put🧠 WaverVanir DSS | 15-min SMC x Options Flow x Liquidity
Palantir ( NASDAQ:PLTR ) has just tapped the 0.886–1.0 Fibonacci zone inside the Premium zone near $146.32, where price wicked above the weak high. This aligns with key liquidity exhaustion, suggesting a short-term distribution phase.
Meanwhile, our scanner picked up notable $144 Puts expiring July 18:
🧾 3,500 contracts traded with IV at 80.4%
🔁 Volume > OI → fresh bearish positioning
📉 $2.76 premium → traders paying up to hedge downside risk
🧩 Trade Breakdown:
Price action: Smart Money Premium rejection from $146.32 with reversal wick
Volume: Spike into imbalance zone below $143.20 = next probable draw
Options Flow: Bearish bets on $144 puts line up with chart thesis
ORB (9:30–9:45): High at $145.69, rejected cleanly at structure
🧭 Target Zone: $142.23 (discount block)
🚨 Risk Level: Above $146.50 invalidates short idea
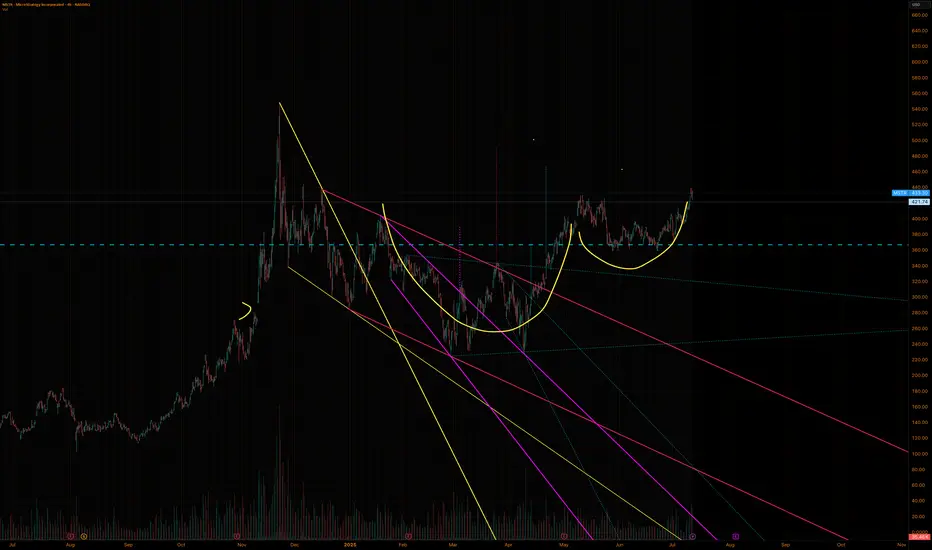
Cup and handleAfter many months, we now have a cup and handle formation. Regardless of Michael Saylor's constant buying, we have a bull flag in play that takes us to $491 USD.
NFLX Price ActionNASDAQ:NFLX showing strong bearish momentum on the 1H. If it breaks below the key $1230 level, next support sits near $1215 — watch for continuation flush 👀🔥

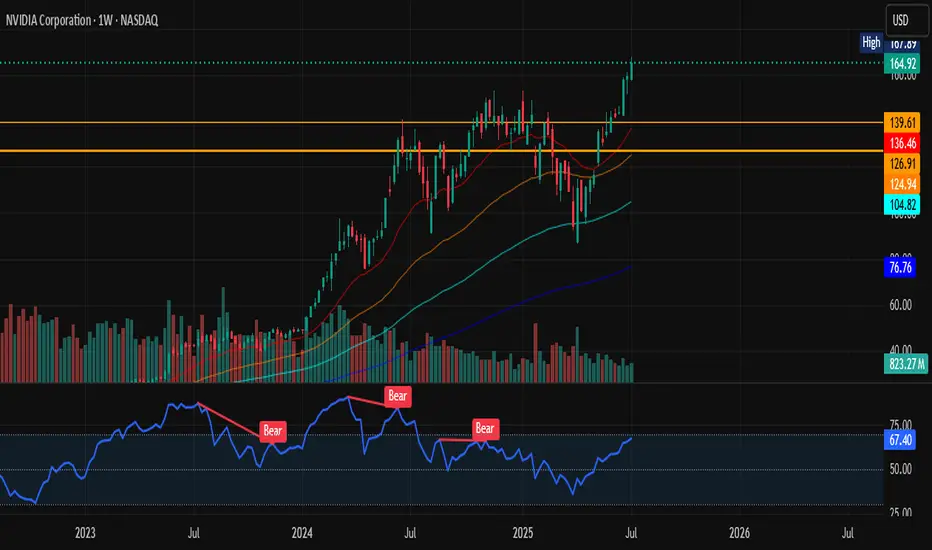
NVIDIA Technical Breakdown NASDAQ:NVDA has broken above the previous congestion/resistance zone (~$139–$145). This zone was tested multiple times and now acts as a support base.
Volume on the breakout week is strong and supporting the move.
Weekly RSI is 67.40, approaching overbought but NOT YET overheated (no bearish divergence). RSI broke past prior Bear zones, signaling renewed strength. Only time will tell.
All-time high territory so proceed with caution. Always due YOUR OWN research.
Bullish long-term trend intact as price is above all EMAs (not too shabby).
I wouldn't be surprised for a pull back soon; maybe 145ish.
Happy Sunday ya'll!
**As always: this isn't financial advice. Please seek professionals on any investments.
$BABA 160+ before year end looks realistic thanks $NVDA- NASDAQ:NVDA export ban lifted for China will be beneficial for NASDAQ:NVDA for sure but main advantages would be for NYSE:BABA as they can get the shovels from the shop as well so that they can compete in Gold Rush and compete with NASDAQ:GOOGL , NASDAQ:META and other private companies like Open AI and Anthropic.
- There are good universities in China and NYSE:BABA is regional big tech in China which gets great talent. I'm confident that NYSE:BABA would be able to compete with NASDAQ:META & NASDAQ:GOOGL in building LLMs even better with this export ban lift.
- Long NYSE:BABA and short/avoid NASDAQ:META ( overvalued )
$HIMS - ORBCLEAN breakout for NYSE:HIMS today.
DP_ORB Indicator marked it at candle close outside of ORB Zone, with confirmation bias from a higher high, and volume. All take profits were hit!
If you want the DP_ORB Indicator for FREE:

Correlation between 2021 squeeze and 2024-2025 price actionRefer to my 2021 squeeze post idea, you can see a very similar pattern, I predict 30s mid august followed by another dip. MOASS? Probably not but maybe assuming crime has run out of tricks
