BOX: The reasonable and logical chartNYSE:BOX :
The reasonable and logical chart between spread and volume.
Why dont you find a simple chart, simple way like this?
.
US STOCKS- WALL STREET DREAM- LET'S THE MARKET SPEAK!

NVDA Breakout Mode! 📈🔥
🚀 Price flying above resistance zone 🟢
🎯 Target: $157.69 | 🔻 Stop: $155.87
⚡ Riding the AI wave with strength! 💡
📊 Chart powered by #ProfittoPath 📈
#NVDA #NVIDIA #AIStocks #BreakoutTrade #TradingView

AXP Long Trade Alert!📈 🚀
🔼 Breakout confirmed above resistance 💥
🎯 Target: $315.36 | 🛡 Stop: Tight
💡 Setup: Trendline + Bullish Momentum ⚡
📊 Chart powered by #ProfittoPath 🔍
#AXP #LongTrade #BreakoutPlay #StockMarket #TradingView

Buy if it's Hold 395Double bottom with SMA 10,20,50 acts as support... needs bitcoin to push higher so this name start moving higher

WULF / 2hAs anticipated, an expected spike high pointed well to the extreme of the diagonal's 4th wave at 4.14 today.
Wave Analysis >> The expanded diagonal in an ending formation will soon conclude the entire correction in ongoing wave b(circled). Now, a further decline of 15% lies ahead on the last subdivision of the ending diagonal wave (c).
The retracement target remains intact >> 3.20
Trend Analysis >> The trend will turn upward very soon to a Minute degree impulsive wave c(circled) after completion of correcting down in the same degree wave b(circled).
#CryptoStocks #WULF #BTCMining #Bitcoin #BTC

$NASDAQ:IREN Under the radarThe best trades have strong fundamentals, strong technical analyses, strong catalysts, and are in a hot theme sector.
If you get 3/4, it's still a good play; if you get all 4, you make the trade.
IREN has 4/4.

FSLR Unduly beat down = margin of safetyProfitable company that makes 1 billion in net income with 20 percent margins.
Unduly punished stock. Mainly serves businesses over residential, so the solar tax credit drama is not as relevant. Solar is the future and will only become more commonplace.
Still going strong from its bounce and eyeing the 170-200 level.

Sharing ScreenerSharing Screener with Others
There is no option to share my screeners with others so one can add Screener to a Layout and Publish. Then allow layout sharing which will give a sharable link
Step 1: Activate Screener on Chart using right side bar
Step 2: Save Layout as new name
Step 3: Publish Layout
Step 4: Share Layout and copy link
BLDR Bullishtriple bottom with price finally breaking out of this walling wedge. Daily MACD is very close to crossing above zero and weekly MACD just crossed. As the market continues, I see rotation into sectors underperforming like homebuilders and BLDR is known for agressive moves. Further, increasing pressure to cut rates helps them as well. I want to see $150 before july 31st earnings

HOOD - STOCK ANALYSIS: Market leader weekly chart bases and HOOD STOCK ANALYSIS
· What will the reader learn? Hi, in this stock analysis we’re going to talk about HOOD. Recently leading the way with super strong market action and being a clear leader.
· STAGE: 2 with continuation uptrend and currently going for ATH. It has given some great opportunities along the three base counts.
· Base counting: When the stock forms a base (5W min.) and breakouts, I want to see that breakout go +20% min. If it doesn’t, I still see it as the same base count (same color). Only when the breakout move goes +20% I’ll consider the new base as an extra count (different color).
Summary
· HOOD provides commission free trading serving over 25.8 million funded accounts.
Fundamental Overview (as of writing of this article)
· EPS: Growing triple digits
· Sales: Growing strong +36% +115% +50%
· Funds: Increasing, institutional money flowing in
· Industry Ranking: 32
· Composite Rating: 98
· RS Rating: 98
· EPS Rating: 81
· Acc/Dis Rating: A-
Technical Analysis
· Stage: 2
· Weekly Charts:
NASDAQ:HOOD
· Bases:
o 1: Tried to go 3 times. +76% move after it
o 2&3: Completely different base personalities (one shallow and one deep) but great results so far on both.
Final Thoughts:
· I think HOOD has been a great trader and has given many great opportunities. This is so far the TML so not going to make any suggestions for targets because these type of stocks can continue beyond what you think.
· So far is extended, the key to get in is to wait for bases on fundamentally sound stocks, so for now holding current position but not adding.
Do you agree with my analysis? And if not, what do you think I missed?

CLSK / 2hAccording to the prior analysis, NASDAQ:CLSK continued to retrace up by 5.5% today, as expected.
Wave Analysis >> The retracement in impulse c of the flat correction in (x) may have ended at 10.74 today, and the anticipated following decline of 25% will soon develop a three-wave sequence abc as wave (y) to conclude the entire correction in ongoing wave ii(circled).
The retracing down target >> 7.93
Trend Analysis >> After the conclusion of the entire correction in the Minute degree wave ii(circled), the trend will turn upward soon to an impulsive third wave in the same degree.
#CryptoStocks #CLSK #BTCMining #Bitcoin #BTC

The Sky is the limit.Potential reversal incoming as recent fundamentals are currently aligned with technicals near the stocks 52 week low. Current price action is of interest especially during a time when the company is being added to the Russell 2000 index on June 27/25 after market close.
With an addressable market with their increasing product line and potential uptick in revenue growth in the second half of 2025, there are signs of accumulation near the lows basing it on the volume bars.
current resistance we can use the ichimoku cloud cover as resistance r.1 1.58usd
support of 1.19 usd
below this 0.92USD

Possible inverse head and shoulders pattern forming.NASDAQ:LUNR If the price rises above the neck line there could be continuation to the upside towards +/- $12.00

Big move for AMD monday inverted H&S greatly confirmed 150USD!!!The pattern have been greatly confirmed for me and i will sell my amd this week at 150 USD and i will wait at july when a drop will occurs to rebuy and i will cumulate more stock or more profits in cash.
The information and publications are not meant to be, and do not constitute, financial, investment, trading, or other types of advice or recommendations.
Thank you!
Subcribe TSXGanG! (For real chart)

$NVDA | Fib Expansion Points to $212.81 → Is the AI Supercycle JWaverVanir International LLC | Weekly Fibonacci Roadmap
📅 June 25, 2025 | +7.27% Day | Post-Stock Split Momentum
NVIDIA ( NASDAQ:NVDA ) continues to dominate the AI-driven tech rally. After reclaiming the 1.618 Fibonacci level ($128.35), price has broken above the 0.886 retracement ($146.72) and is now pressing higher with bullish volume.
🧠 Fibonacci Insights:
🔺 1.786 Fib Extension: $207.76
🎯 Primary Target: $212.81 (Golden Projection)
🚀 Long-term Fib targets extend into $250–290+ zone (2.618–3.0 extensions)
🔻 Red trendline below signals well-respected diagonal support since early 2023
📊 Price Outlook:
Current Price: $154.31
Short-term Path: Bullish breakout → $168.21 → $178.43
Next Major Resistance: $212.81
Support to Hold: $139.93 / $128.35 (previous Fib clusters)
🧩 Catalysts Ahead:
Q2 Earnings (Late August 2025) – Focus on AI/data center revenue acceleration.
NVIDIA Blackwell GPU shipments – Institutional uptake will confirm pipeline robustness.
AI Sovereign Demand – U.S., UAE, Singapore and Saudi Arabia investing in GPU infrastructure.
AI Arms Race – Competitive moat widening vs. AMD, Intel.
AI App Ecosystem Expansion – Surge in demand for inferencing chips (L4, L40, GB200).
Post-Stock Split Rotation – Retail inflow and fresh institutional allocations.
📌 Summary:
NVIDIA is not just a chipmaker — it’s the core of the modern AI stack. With clear Fibonacci structure and geopolitical tailwinds, the next target is $212.81. Watch dips into $140s for potential reload zones.
🔖 Hashtags:
#NVDA #NVIDIA #AIstocks #WaverVanir #FibExtension #FibonacciTrading #AIboom #BlackwellGPU #GPUpower #PostSplit #TechLeadership #TradingView #SMC #AIarmsrace

Google - Call and Put Credit Spread IdeaBuy Call (1 ITM) and/or Put Credit Spread (ATM) on Monday at enter zone
Take Profit at Bollinger Band Middle (Daily Chart)
Stop Loss if the price closes below 50 EMA at 10 mins. chart

NVDA DECISION TO MAKE watching NVDA on breakdown or failure of breakdown Harmonic. increased volume at double bottom and D PRZ suggests to me this will not breakdown, but i dont think it wont chop away my confidence either. ill just wait for the direction.

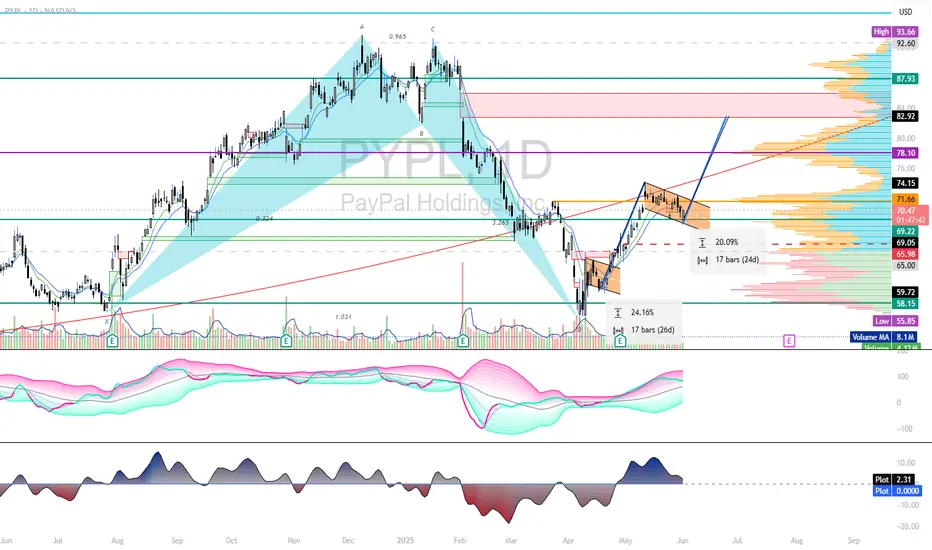
LONG (E-PAY)PAYPALHuge tail on this in larger frames, and another huge hmnc on daily. see flagging into gap...if info TL holds any weight ill find out. tossed coin at NASDAQ:PYPL $80 6-27-25 call @ 0.15; at that price...Why not.
TMUS shortT mobile run seems to been exhausted and setting up. Weekly and Daily setup so anticipate a lot of head spin but on my radar. For now short seems to be my bias. 242.25 shows to be POC before 220 target of max pain. 218-209 is the area of interest for base bullish harmonic.
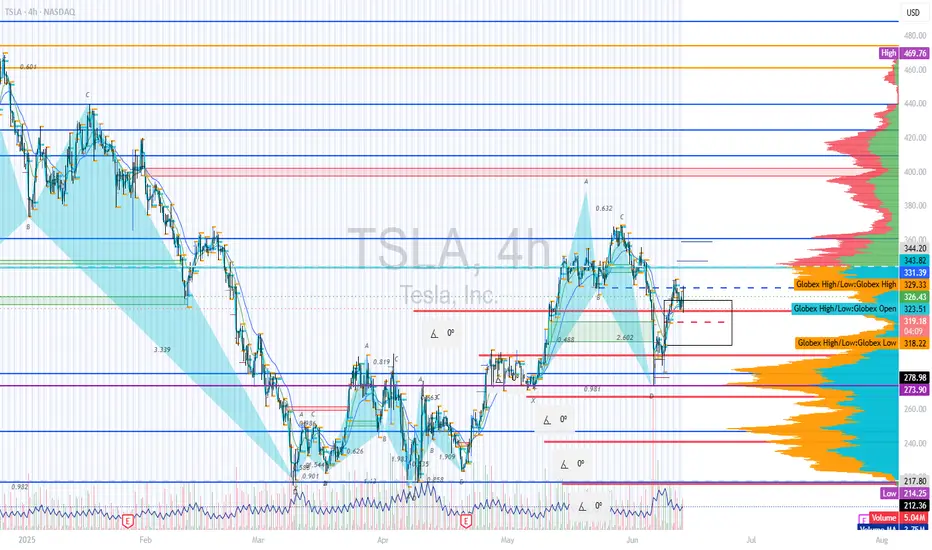
TSLA shortPart of a larger analysis, at the moment Tsla rejected 332 B pivot and imo retesting possible b.o. area. missed gap up open, retest of highs sent 305p strike. looking to close at 310-305 tgt zone. n.f.a. g.l.h.f
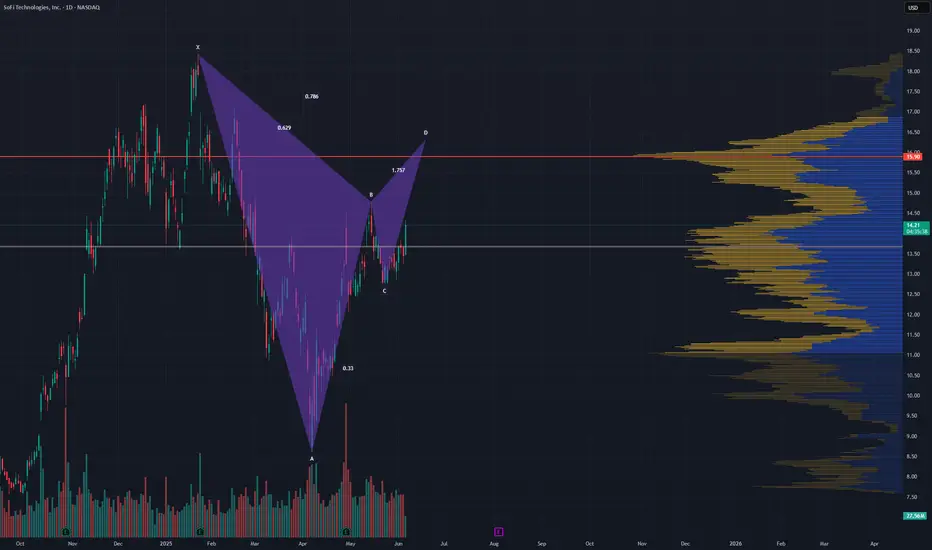
$SOFI looks like its forming a bearish Gartley Noticed this potential #Gartley #Harmonic on #SOFI the other day. I hope my 14c calls do get blessed with its completion.
I expect a retrace to 13.30 then 11.55 of the completion.
Citigroup Wave Analysis – 25 June 2025- Citigroup rose above the resistance level 78.60
- Likely to rise to resistance level 84.65
Citigroup recently rose above the resistance level 78.60, which stopped the previous minor impulse wave 3 at the start of June.
The breakout of the resistance level 78.60 accelerated the active short-term impulse wave 5, which belongs to the sharp intermediate impulse sequence (C) from the start of April.
Citigroup can be expected to rise to the next resistance level 84.65, former multi-month high from February.

AMD Wave Analysis – 25 June 2025
- AMD rose above the resistance level 136.16
- Likely to rise to resistance level 150.00
AMD recently broke the resistance zone between the resistance level 136.16 (former strong support from 2024) and the 61.8% Fibonacci correction of the downward impulse from last October.
The breakout of this resistance zone accelerated the active short-term impulse wave 3, which belongs to the multi-month upward impulse sequence (3) from the start of April.
AMD can be expected to rise to the next resistance level 150.00, former monthly high from November and the target for the completion of the active wave (3).
