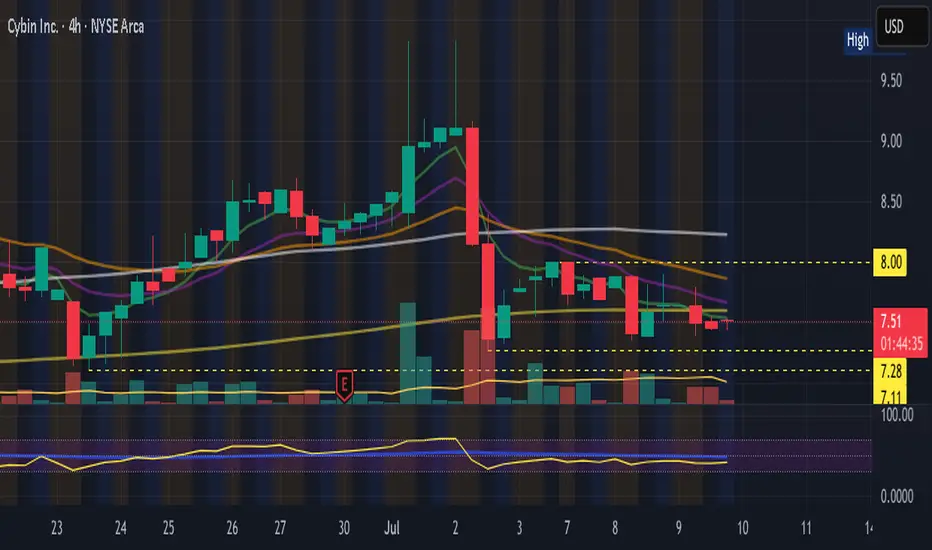
CYBN in sideways channel, bulls need to break above 8.01Nothing changes for me between 7.11 and 8.01. Break below and I will stop out of my swing and be very patient while I reassess, break above 8.01 and we look for a lower high below 9.83. Currently, 4hr EMA12 continues to be resistance on each little bounce attempt.
If you are bullish here, you have decent entry opportunity to play off of 7.11 support with a stop loss below that - you'll certainly be in a much better position with your position than I am with mine on this stock!
CMPS riding 4hr EMAsCMPS continues it's slow grind uptrend riding the 4hr 12EMA which hasn't been lost since reclaiming it a few days after the news dump. The daily chart is a stair-step (a higher low each consecutive candle) since the low of the dump and while notable, for me the guide is when the 4hr chart no longer rides the EMA12 upwards. Bottom to top of the bounce is now 66% and counting, and we know that healthy daily consolidation will come sooner or later.

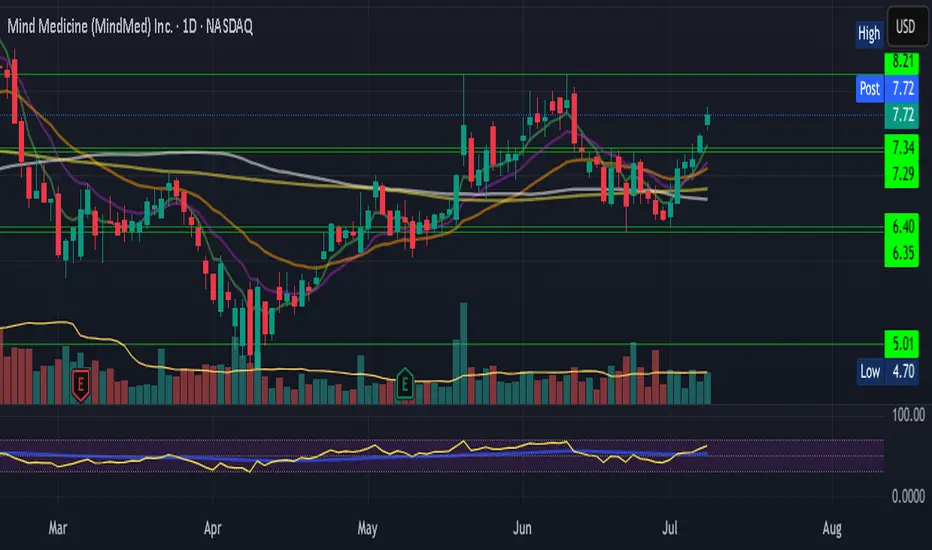
MNMD on the cusp of a lower volume nodeMNMD closed July 8th with the most bullish candle since May 19th, finally giving us a convining break of the daily equilibrium, and resulting in a gap up and run this morning with another solid day up over 3%. Today's high rejected from the top of the current high volume node mentioned in my weekend video (7.80), above this there isn't much resistance until the weekly resistance doubletop at 8.21. Hourly RSI is entering into typical pullback areas over the last 6 months so we will be watching the hourly uptrend for clues on pullbacks if we are seeing healthy hourly consolidation or looking for a daily consolidation.
ATAI consolidating in a 4hr channelATAI has been consolidating sideways on the daily chart for the last 5 days, in a confined channel on the 4hr chart. The channel levels are denoted by yellow dotted lines. This consolidation remains constructive above the last weekly resistance at 2.64, denoted by the solid white line. There is a LOT of volume being traded here (check it out yourself using Volume Profile) which can potentially be a bearish P-shaped volume profile, so bulls want to see a strong push upwards towards $3.00 sooner rather than later. Still, the consolidation remains constructive at this point in time while the market digests the giant gap up and breakout on the back of readout July 1st.

Bank of America Wave Analysis – 9 July 2025
- Bank of America reversed from resistance area
- Likely to fall to support level 45.00
Bank of America recently reversed down from the resistance area located between the long-term resistance level 50.00 (which started the weekly downtrend at the start of 2022) and the upper weekly Bollinger Band.
The downward reversal from this resistance area stopped the previous intermediate impulse wave (3) from the start of 2025.
Given the strength of the resistance level 50.00 and the overbought weekly Stochastic Bank of America can be expected to fall to the next support level 45.00.

MTH (Meritage Homes) – Position Trade Setup📈 Symbol: MTH (Meritage Homes)
📊 Timeframe: Daily Chart
📍 Strategy: Position Trade (Weeks to Months)
🎯 Trade Setup
Entry Zone: $74.00 (Current breakout level / near SMA 20)
Stop-Loss (SL): $65.74 (Below key support & SMA 50)
Take-Profit (TP): $92.70 (ATH Resistance & +25% upside)
Risk-Reward Ratio: 1:2.5
📊 Technical Analysis
✅ Trend: Strong uptrend (Higher highs & higher lows).
✅ Moving Averages: SMA 20 > SMA 50 (Bullish alignment).
✅ RSI (14): ~65 (Healthy momentum, no overbought signal).
✅ MACD: Bullish crossover & histogram expanding.
✅ Volume: Rising on upward moves (Confirms buying interest).
Key Levels:
Support: $70 (SMA 20), $65.74 (Strong Swing Low).
Resistance: $78 (Recent High), $92.70 (All-Time High Target).
💰 Fundamental Backing
Strong Financials: Low debt (Score 10), undervalued P/E & P/S ratios.
Revenue Growth: Steady performance in housing sector.
Institutional Interest: Increasing accumulation.
⚡ Trade Execution Plan
1️⃣ Entry: $74.00 (Break of consolidation).
2️⃣ Stop-Loss: $65.74 (Protects against trend reversal).
3️⃣ Take-Profit: $92.70 (Scale out partials at $78 and $85).
4️⃣ Trailing Stop: Adjust SL to breakeven at $78.
📌 Why MTH?
Strong sector outlook (Housing demand remains high).
Technically & fundamentally aligned for a multi-week rally.
Clear risk management with 1:2.5 RR.
🎯 Verdict: BUY MTH at $74, SL $65.74, TP $92.70.
🔔 Follow for more trade ideas!
👍 Like & Comment if you agree!
#TradingView #Stocks #MTH #PositionTrading #RealEstate #SwingTrading
(Disclaimer: Not financial advice. Do your own research.)

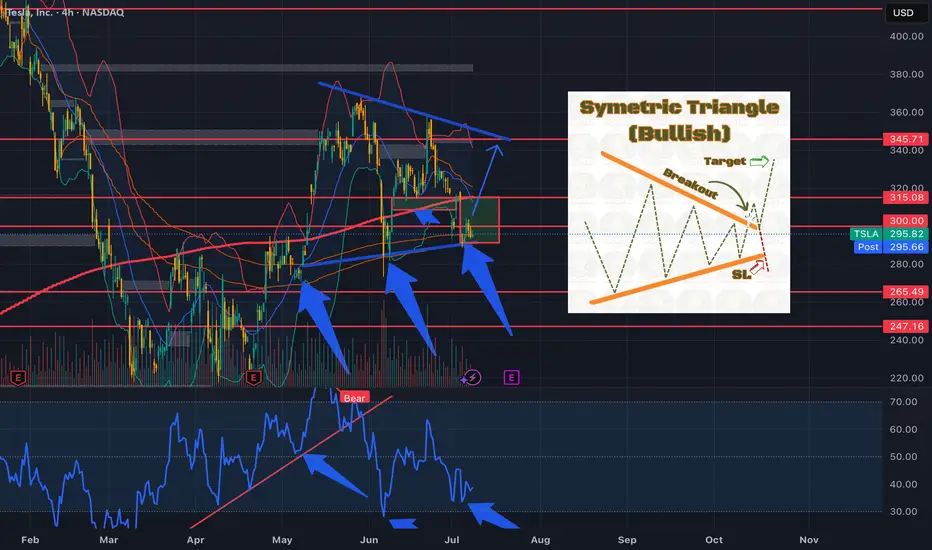
TSLA....Symetric Triangle....Earnings Rally?Could we see the bulls step in and leads us into earnings?
Valuation of the company's patentsThe company has 90 patents to date, each worth about $2 million at current market value, half the typical $5 million value of patents in this industry.

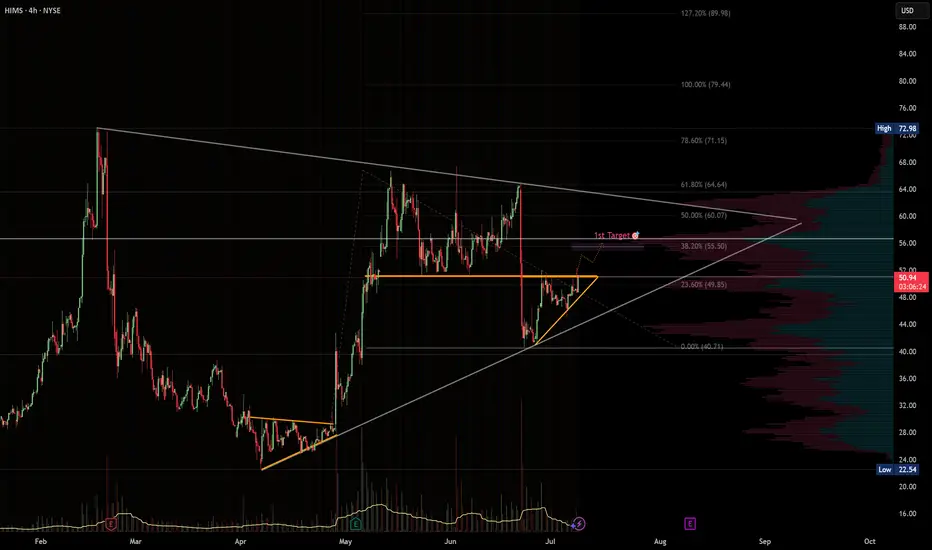
HIMS · 4H — Symmetrical Triangle Breakout Targeting $55 → $60Setup Breakdown
HIMS is forming a symmetrical triangle consolidation, with price tightening between rising support and descending resistance.
The structure follows a previous impulsive move, suggesting this is likely a bullish continuation pattern.
Volume is contracting — typical for pre-breakout setups — and price is holding above a key short-term rising trendline.
A breakout above $52–53 could initiate a fast move into the next resistance band.
---
🎯 Target Zone
🎯 Target Level Reason
Target-1 $55.50 (38.2% Fib) Volume gap fill + first resistance from prior consolidation range. A clean spot for partial profits.
Target-2 $60.00 (50% Fib) Strong historical resistance + Fibonacci confluence. Ideal level to take the rest of the position or trail a runner.
---
🛠️ Trade Plan (Example)
Component Action
Trigger Long on a confirmed breakout above $52 with volume ≥ 20-SMA
Entry Add-on Pullback retest of broken triangle resistance ($52) acting as new support
Stop-loss Close < $49.50 — invalidates the triangle
TP-1 $55.50 — take 50–70% off, move stop to breakeven
TP-2 $60.00 — exit or leave a small runner in case of further breakout
---
⚠️ Risk Notes
Earnings date approaching – trade may need to be closed or hedged before volatility spikes.
Break below $49.50 invalidates the pattern and opens risk to $46 or lower.
Watch for volume confirmation — fakeouts can occur if breakout lacks momentum.
---
✅ Checklist
Triangle structure with strong trendline support
Low-volume zone between $53–60 favors fast expansion
Targets align with Fib + volume profile
Risk clearly defined
Earnings awareness in place
> Disclaimer: This is not financial advice. Trade your own plan and manage risk appropriately.
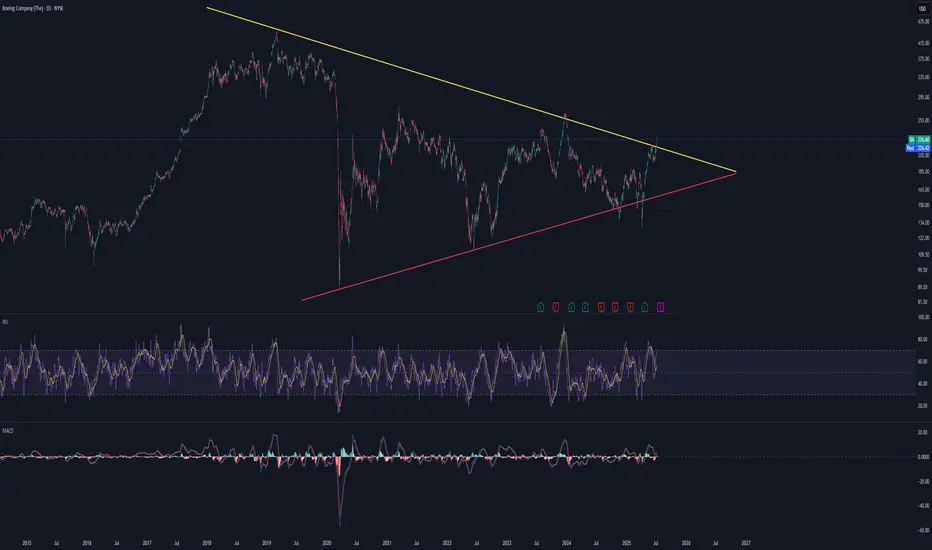
BA: Possible breakout???Hello,
BA is possibly breaking out of multi year structure.
If it comes down and retest the resistance as support and go higher, it can go ballistic.
Be cautious about fake breakouts.
Happy trading. NYSE:BA
TWLO: Clean Breakout Structure with 16% UpsideTwilio ( NYSE:TWLO ) just confirmed a breakout from a multi-week range — holding above cloud support with a favorable risk/reward profile.
📈 Technical Breakdown
Ichimoku: Price is holding above the cloud, with Tenkan and Kijun lines aligned bullishly. Cloud twist confirms trend shift is in progress.
MACD: Neutral, but showing signs of stabilization — may flip positive if momentum builds.
Price Action: Clear higher lows and breakout above previous resistance zone.
📊 Trade Parameters
Entry: ~$121
Target: $140.75 (+16.27%)
Stop: $114.79 (–5.14%)
R/R Ratio: 3.16 — excellent skew for swing positioning.
The recent base breakout looks technically solid. If TWLO can push toward R1, this could be the start of a larger trend move into Q3.

$BULL Long term looking like a gemNASDAQ:BULL has been consolidating since its IPO and is now looking to complete its rounded bottom. This is a long term play and should have a potential upside to the moon and beyond!

OSH KOSH SELL it B'Gosh!OSH KOSH B'GOSH is over extended here and at resistance! I would add every $2 increments on a starter position here, should easily retrace to $117 and $108 in coming weeks

WULF / 2hNASDAQ:WULF
According to the bearish alternative in my weekly frame (not the chart above and not posted recently), the entire countertrend rally, which has developed in an ABC zigzag sequence as anticipated in the analysis which I posted on May 12, may have reached a very late stage where an expanding diagonal remains at the start point of a final advance as its 5th subdivision. It would be an ending rise of the entire correction upward since April 9.
NASDAQ:WULF 's Bearish Alternative :
Wave Analysis >> As depicted on this 2h-frame above, the structure of the entire countertrend advance, which has developed since April 9, may be considered in a thorough ABC zigzag correction, in which Minor degree wave C should have reached its very late stage now. It would likely achieve its expansion target at 5.55.
And it was a 170% gain of a countertrend rally!!
>> Now, 13% advance is left to complete a possible ending expanding diagonal as the wave v(circled) of C.
Trend Analysis >> The uptrend would likely change to down in an Intermediate degree wave (C) very soon!! It will likely last until the end of the year.
#CryptoStocks #WULF #BTCMining #Bitcoin #BTC

PLTR DUMP INCOMINGdump it dump it dump it.
huge resistance off yearly level. gap on daily chart. Untested levels acting as a magnet lower. Dump it.

CLSK / 4hNASDAQ:CLSK resumed advancing in its ongoing wave iii(circled) as anticipated, by 10.44% intraday today.
Wave Analysis >> According to the prior analysis, the advance will likely achieve the extension Fib-target at 20.06 as the extreme point of the impulsive third wave of the sequence of C.
Trend Analysis >> The Minor degree UPtrend would remain in progress on a larger degree trend upward >> Intermediate degree wave (B) as a countertrend!
#CryptoStocks #CLSK #BTCMining #Bitcoin #BTC


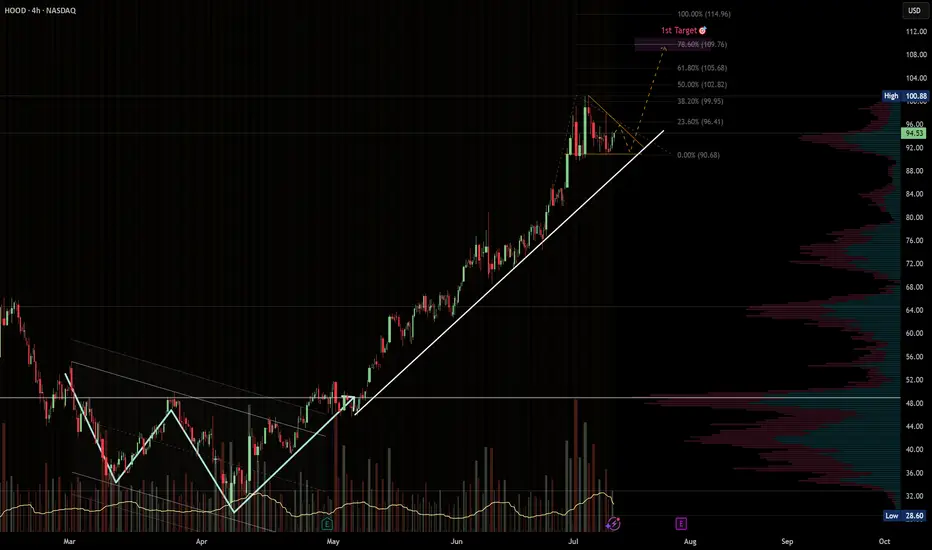
HOOD · 4H — Bullish Continuation Setup Targeting $109 → $115Pattern Overview
HOOD has been riding a strong ascending trendline since early May, respecting higher highs and higher lows all the way up.
After the most recent parabolic move from ~$90 to ~$101, price is now consolidating in a bullish pennant, just above key fib levels.
The setup looks primed for continuation if we see a breakout above $101 with confirming volume.
---
🎯 Target Zones
🎯 Target Level Why It Matters
Target 1 $109.76 78.6% Fibonacci extension from the previous leg. Common spot for intermediate take-profit. Also matches a soft VPVR resistance area.
Target 2 $114.96 100% measured-move projection of the prior rally. If momentum accelerates, this becomes a realistic stretch zone.
---
🛠️ Trade Plan (Example)
Component Level
Trigger Break and hold above $101 with volume ≥ 20-SMA.
Add-on Opportunity Pullback into $96–97 that respects the rising trendline.
Stop-loss Close < $92.5 invalidates trendline.
TP-1 $109–110 — take partials, move stop to breakeven.
TP-2 $114–115 — full exit or runner trail zone.
---
⚠️ Risk Notes
Watch for false breakouts — confirmation needs volume and price stability above $101.
Earnings or macro news could override technicals. Use tighter stops ahead of event dates.
If trendline fails, next key support sits at $89–90 (previous consolidation base).
---
✅ Trade Checklist
Bullish trendline intact
Continuation pennant forming
Fib & measured move confluence at $109–115
Volume profile supports clean move above $101
Clear invalidation under $92
> Disclaimer: This is not financial advice. Always trade your own plan and manage risk appropriately.
Meta - The breakout in question?🪓Meta ( NASDAQ:META ) is retesting major structure:
🔎Analysis summary:
After Meta perfectly retested a major previous support trendline in 2022, the trend shifted bullish. We have been witnessing an incredible rally of about +700% with a current retest of the previous all time highs. Time will tell but a bullish breakout remains quite likely.
📝Levels to watch:
$750
🙏🏻#LONGTERMVISION
Philip - Swing Trader

Bumble looking bullish above the 200MABumble looks to be consolidating just above the white line which is the 200MA. It hasn't traded above the 200 since its IPO in Feb 2021. If the 200 holds, look for much higher prices for bumble! I bought the Jan 26' $6 Calls for $1.50

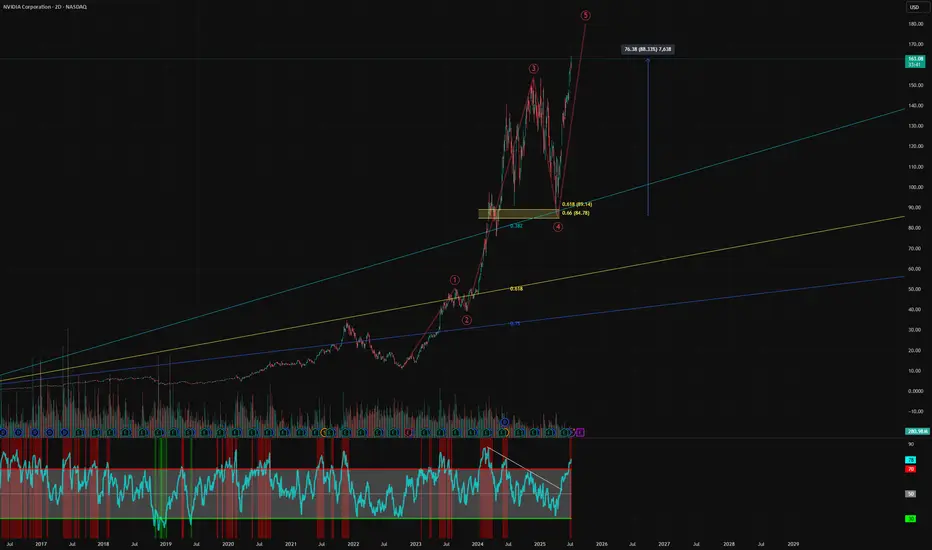
Nvidia - Blow off top?Time to book some AI stock profits, I have exited ARM and today I am taking profits on Nvidia. We entered at the golden pocket, up over 88% since the recent lows. I am now scaling out of my position, starting with 50% of my total. I will use a trailing stop loss for the rest.
We have hit a 4 trillion dollar market cap, more than the entire UK stock market combined. Am I bearish on Nvidia? Of course not, but the market is getting greedy and I like to book profits.
I love the company, but I expect huge volatility going forward.
Not financial advice, do what's best for you.
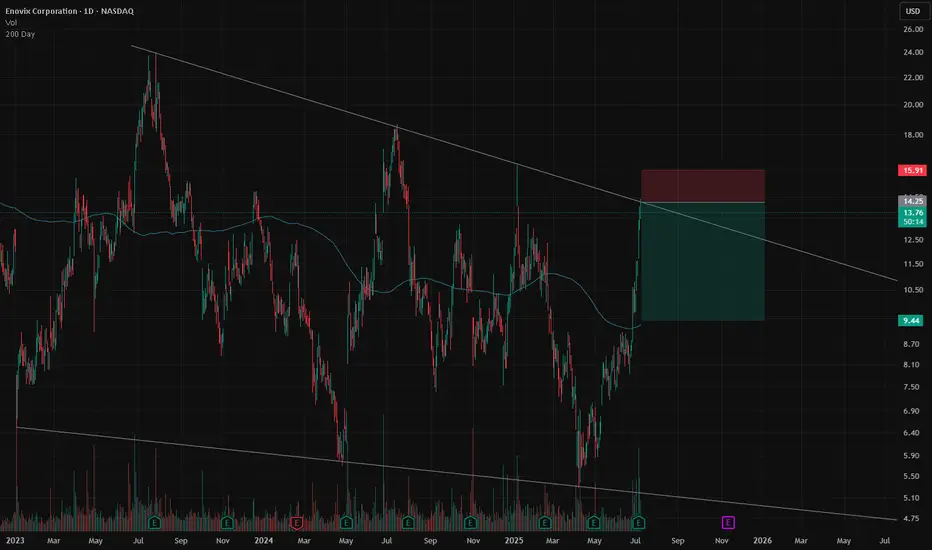
ENVX TradeENVX is the poster child of the 2021 SPAC/IPO bubble. It's shares have essentially been in a downtrend since going public.~35% short interest on the name, no need to go in depth on the fundamentals (or lack there of).
Technical play here, shares are grinding up on the long-term trend resistance line. Expecting a move back toward the 200 day SMA in the next couple months. Stop out at 16 if there's a squeeze, or things get memey.
Near term target - $9.50. Long term target - zero.
I like 5+ month expirations OTM puts here.
Good Luck! This is not financial advice