QBTSWould expect a bounce off the lower levels from 13.54 or so and climb back to 17 see if rejection if not and breakthrough then retest 17 as a floor and move to ATH.. chart breaks down if lower support broken

WBD - LONGWBD
I Liked this one, I hope they continue to improve their bottom line.
I went long on it at $8.40 it has ups and downs.
Anyways I like it and perhaps it gets better.
cheers

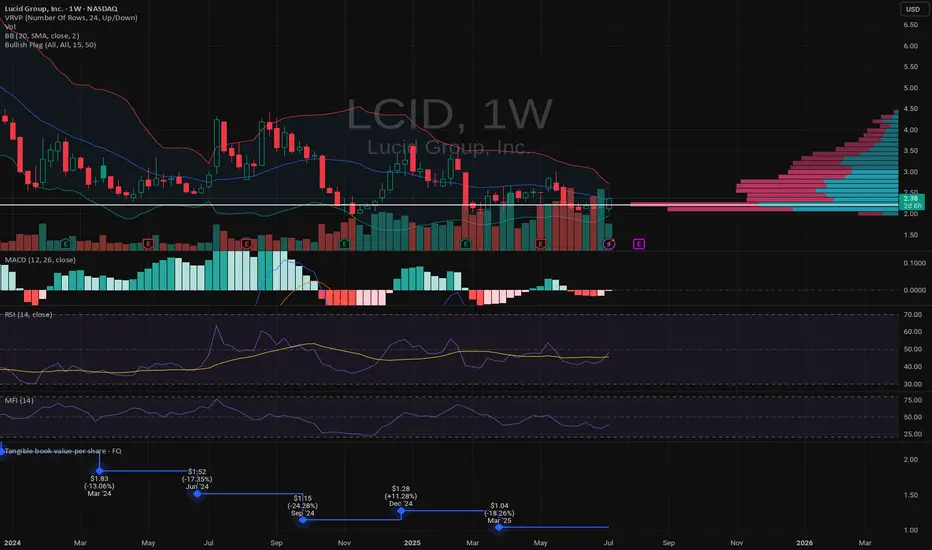
LCID - LONGLCID
LONG
Tight BB building pressure. Lots of other squeezes happening and this is no exception.
not trading advice.
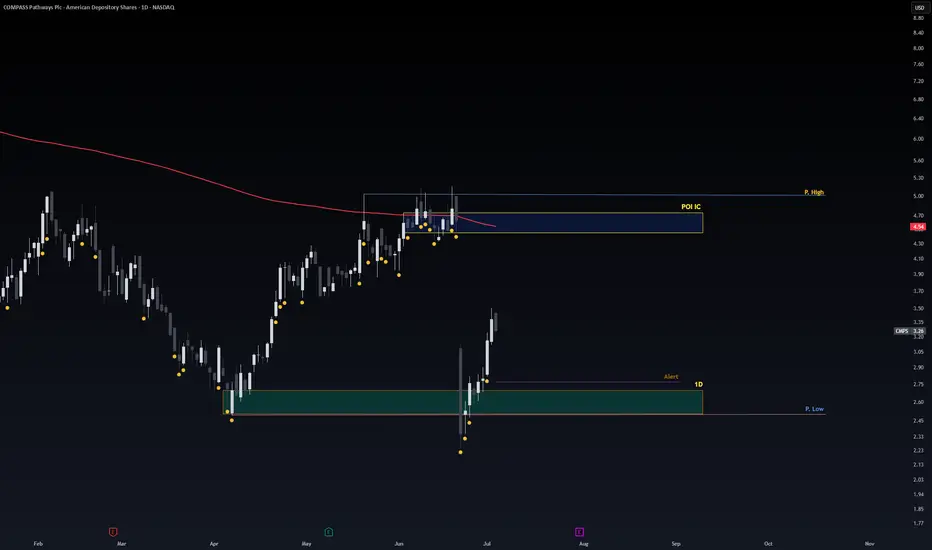
Safe Entry Zone CMPSStock Recovering from steep drop from bad news (which we don't care).
Blue Zone is Sell Zone.
Green Zone is Buy Zone.
since stock already rallied. its Risky to follow we wait price to re-test Green Zone.
Also My Beloved CAthie Wood BEST INVESTOR All Time (based on statics better than Warren Buffet Entire Histroy) Is BUYING!
Note: 1- Potentional of Strong Buying Zone:
We have two scenarios must happen at The Mentioned Zone:
Scenarios One: strong buying volume with reversal Candle.
Scenarios Two: Fake Break-Out of The Buying Zone.
Both indicate buyers stepping in strongly. NEVER Join in unless one showed up.
2- How to Buy Stock:
On 1H TF when Marubozu/Doji Candle show up which indicate strong buyers stepping-in.
Buy on 0.5 Fibo Level of the Marubozu/Doji Candle, because price will always and always re-test the
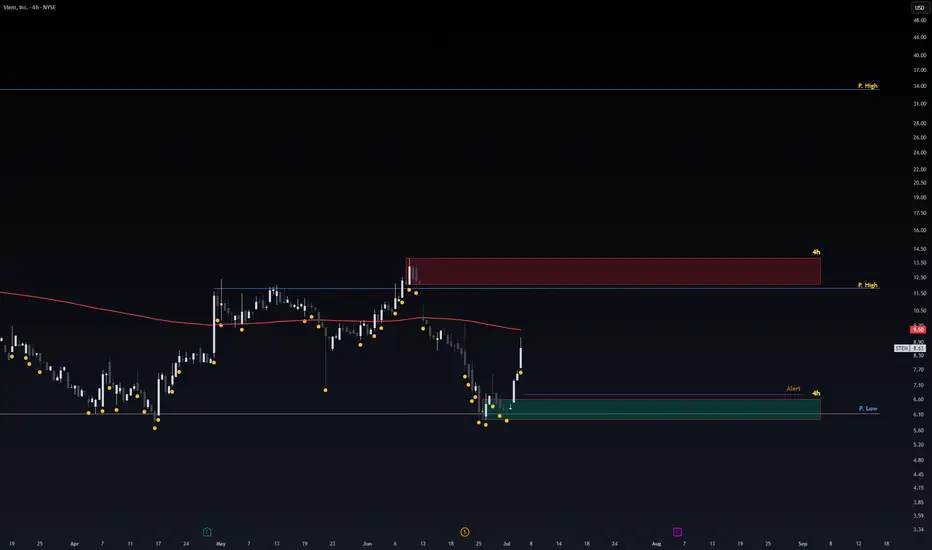
Safe Entry STEMPrice movement consolidating.
Safe Entry Green Zone.
Red Zone is Sell Zone. better watch out for any selling pressure.
P.high Lines Are Good Resitances.
Final Target 33.45$ price level.
better to wait stock and not follow.
Note: 1- Potentional of Strong Buying Zone:
We have two scenarios must happen at The Mentioned Zone:
Scenarios One: strong buying volume with reversal Candle.
Scenarios Two: Fake Break-Out of The Buying Zone.
Both indicate buyers stepping in strongly. NEVER Join in unless one showed up.
2- How to Buy Stock:
On 1H TF when Marubozu/Doji Candle show up which indicate strong buyers stepping-in.
Buy on 0.5 Fibo Level of the Marubozu/Doji Candle, because price will always and always re-test the
Safe Entry CNSNote: Lower TF to 1h or 4h to see better details.
Recently Trump lift chips design prohibition to be sent to china. (Positive to CDNS)
Stock Obvious and clearly at major resistance with such news it expected to open Gap Up.
following the stock would be mistake unless stock open in pre-market with price level similar to close.
better to wait stock to open gap up. Re-test the major resistance.
that would be major support level and safe entry for price to go higher.
Note: 1- Potentional of Strong Buying Zone:
We have two scenarios must happen at The Mentioned Zone:
Scenarios One: strong buying volume with reversal Candle.
Scenarios Two: Fake Break-Out of The Buying Zone.
Both indicate buyers stepping in strongly. NEVER Join in unless one showed up.
2- How to Buy Stock:
On 1H TF when Marubozu/Doji Candle show up which indicate strong buyers stepping-in.
Buy on 0.5 Fibo Level of the Marubozu/Doji Candle, because price will always and always re-test the

Safe Entry OracleStock In Up-Movement.
P.High (Previous High) is Safe Entry.
Note: 1- Potentional of Strong Buying Zone:
We have two scenarios must happen at The Mentioned Zone:
Scenarios One: strong buying volume with reversal Candle.
Scenarios Two: Fake Break-Out of The Buying Zone.
Both indicate buyers stepping in strongly. NEVER Join in unless one showed up.
2- How to Buy Stock (safe way):
On 1H TF when Marubozu/Doji Candle show up which indicate strong buyers stepping-in.
Buy on 0.5 Fibo Level of the Marubozu/Doji Candle, because price will always and always re-test the

Safe Entry Zone CHWYCurrently stock in Ranging Movement.
1h Green Zone is buying Zone.
1h Red Zone is selling Zone.
Price ranging with strong potional of Strong Up-Movement.
Note: 1- Potentional of Strong Buying Zone:
We have two scenarios must happen at The Mentioned Zone:
Scenarios One: strong buying volume with reversal Candle.
Scenarios Two: Fake Break-Out of The Buying Zone.
Both indicate buyers stepping in strongly. NEVER Join in unless one showed up.
2- How to Buy Stock:
On 1H TF when Marubozu/PinBar Candle show up which indicate strong buyers stepping-in.
Buy on 0.5 Fibo Level of the Marubozu Candle, because price will always and always re-test the imbalance.

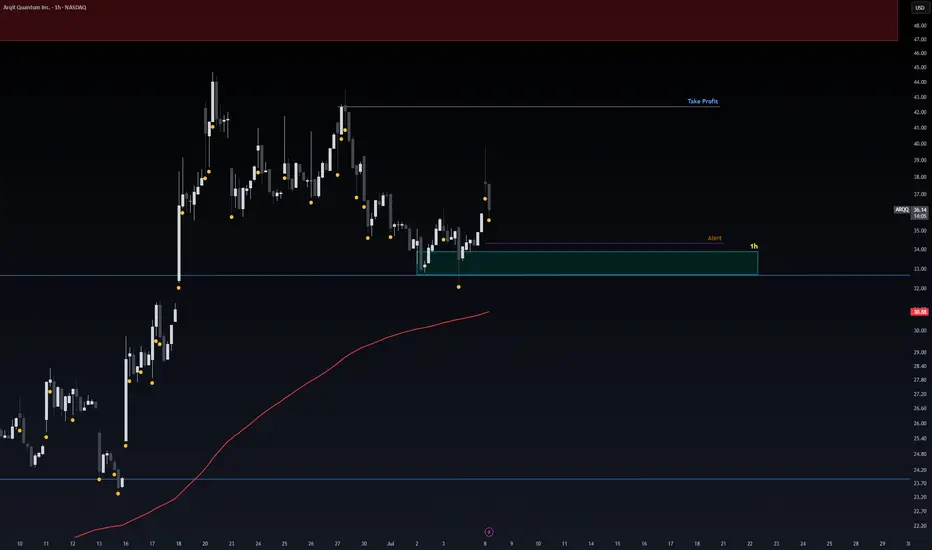
Safe Entry Zone ARQQStock in Up Movement.
1H Green Zone is Safe Entry.
Note: 1- Potentional of Strong Buying Zone:
We have two scenarios must happen at The Mentioned Zone:
Scenarios One: strong buying volume with reversal Candle.
Scenarios Two: Fake Break-Out of The Buying Zone.
Both indicate buyers stepping in strongly. NEVER Join in unless one showed up.
2- How to Buy Stock (safe way):
On 1H TF when Marubozu/Doji Candle show up which indicate strong buyers stepping-in.
Buy on 0.5 Fibo Level of the Marubozu/Doji Candle, because price will always and always re-test the
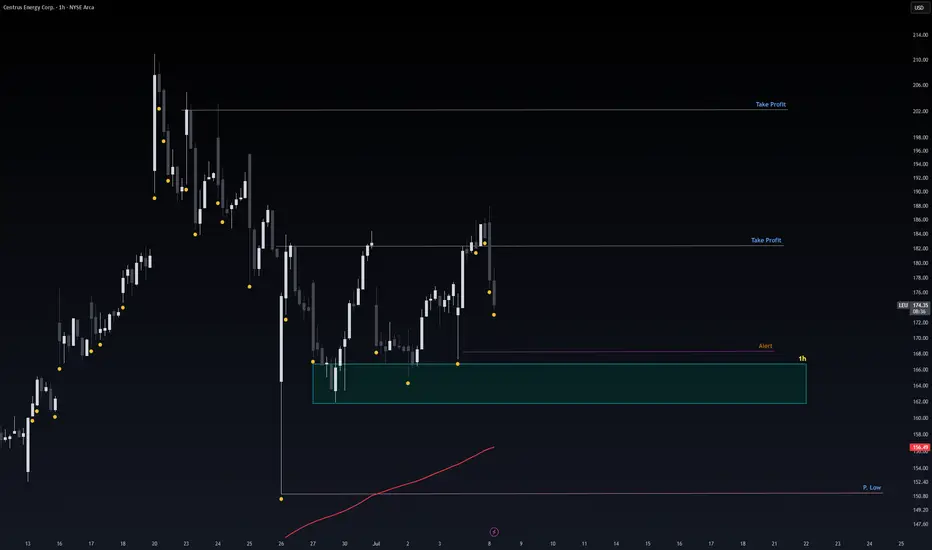
Safe Entry LEUStock Movement Ranging.
Current 1H Green Zone is Safe Entry, wait for confirmation for entry since the Zone been Tested before which means its weaker but since it has strong buying power i believe its safe.
Note: 1- Potentional of Strong Buying Zone:
We have two scenarios must happen at The Mentioned Zone:
Scenarios One: strong buying volume with reversal Candle.
Scenarios Two: Fake Break-Out of The Buying Zone.
Both indicate buyers stepping in strongly. NEVER Join in unless one showed up.
2- How to Buy Stock (safe way):
On 1H TF when Marubozu/Doji Candle show up which indicate strong buyers stepping-in.
Buy on 0.5 Fibo Level of the Marubozu/Doji Candle, because price will always and always re-test the
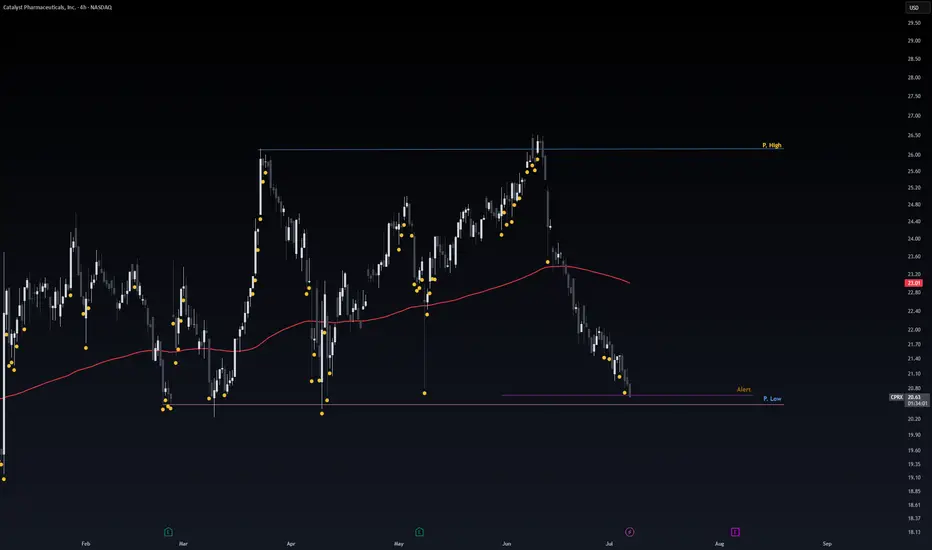
Safe Entry CPRXStock Movement Ranging.
Currently at Support level.
P.Low Zone is Buy Zone.
Target P.High Zone is Sell Zone.
Note: 1- Potentional of Strong Buying Zone:
We have two scenarios must happen at The Mentioned Zone:
Scenarios One: strong buying volume with reversal Candle.
Scenarios Two: Fake Break-Out of The Buying Zone.
Both indicate buyers stepping in strongly. NEVER Join in unless one showed up.
2- How to Buy Stock (safe way):
On 1H TF when Marubozu/Doji Candle show up which indicate strong buyers stepping-in.
Buy on 0.5 Fibo Level of the Marubozu/Doji Candle, because price will always and always re-test the
$MET u again - Bullish StanceNYSE:MET 's chart reveals classic rally-base-rally structure: strong uptrend channel (green), consolidation phase at $80-85, sharp April selloff to $68 creating new base, now rallying from this foundation.
Current price ($79.79) testing previous support-turned-resistance. Watch for breakout above $80 to confirm pattern completion. #TechnicalAnalysis #RBR

Short term (GOOG) shortCaught it on the fib pull back. Very short term trade as overall market trend is bullish.

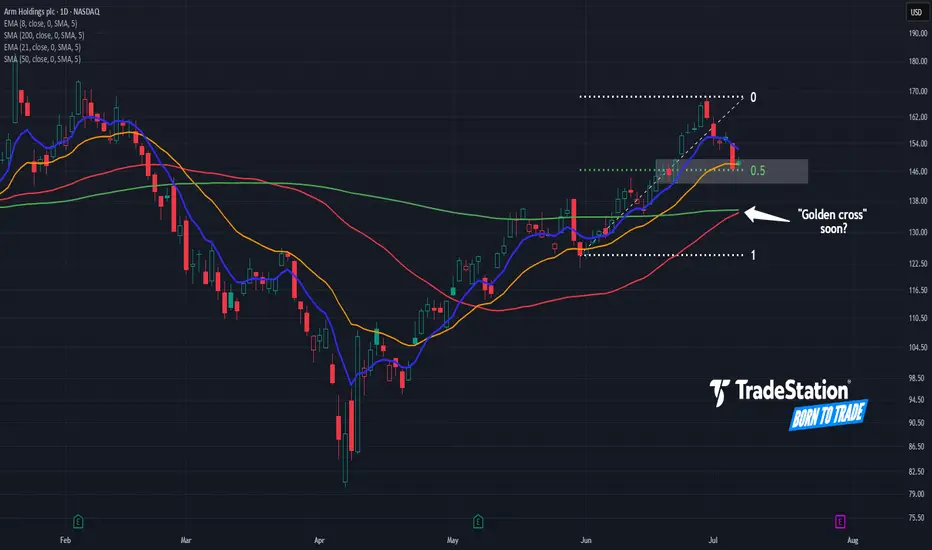
Arm Pulls BackArm Holdings rallied sharply last month, and now the AI chip stock has pulled back.
The first pattern on today’s chart is the advance from May 30 through June 30. ARM retraced half that move and is trying to bounce, which may confirm its upward direction.
Second, prices have retested their rising 21-day exponential moving average (EMA). The 8-day EMA is also above the 21-day EMA. Those signals may be consistent with short-term bullishness.
Third, the 50-day simple moving average (SMA) is nearing a potential “golden cross” above the 200-day SMA. That could reflect longer-term bullishness.
Finally, a four-session consolidation zone formed in late June between roughly $143 and $149. Will it now emerge as new support?
Check out TradingView's The Leap competition sponsored by TradeStation.
TradeStation has, for decades, advanced the trading industry, providing access to stocks, options and futures. If you're born to trade, we could be for you. See our Overview for more.
Past performance, whether actual or indicated by historical tests of strategies, is no guarantee of future performance or success. There is a possibility that you may sustain a loss equal to or greater than your entire investment regardless of which asset class you trade (equities, options or futures); therefore, you should not invest or risk money that you cannot afford to lose. Online trading is not suitable for all investors. View the document titled Characteristics and Risks of Standardized Options at www.TradeStation.com . Before trading any asset class, customers must read the relevant risk disclosure statements on www.TradeStation.com . System access and trade placement and execution may be delayed or fail due to market volatility and volume, quote delays, system and software errors, Internet traffic, outages and other factors.
Securities and futures trading is offered to self-directed customers by TradeStation Securities, Inc., a broker-dealer registered with the Securities and Exchange Commission and a futures commission merchant licensed with the Commodity Futures Trading Commission). TradeStation Securities is a member of the Financial Industry Regulatory Authority, the National Futures Association, and a number of exchanges.
TradeStation Securities, Inc. and TradeStation Technologies, Inc. are each wholly owned subsidiaries of TradeStation Group, Inc., both operating, and providing products and services, under the TradeStation brand and trademark. When applying for, or purchasing, accounts, subscriptions, products and services, it is important that you know which company you will be dealing with. Visit www.TradeStation.com for further important information explaining what this means.
Quick View: $SLB- Great consolidaiton on the daily with EMAs+Price ready to make THE Move.
- The hourly looks good with a perfect box

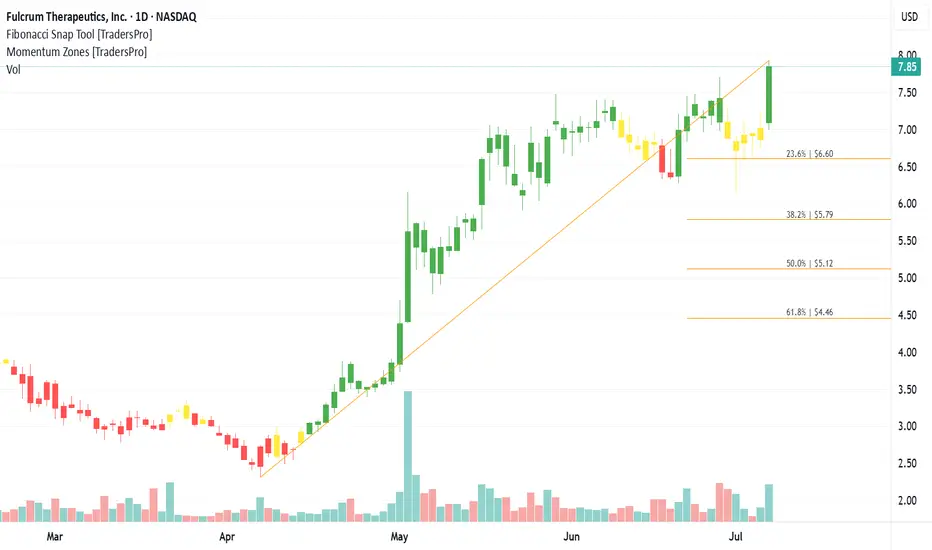
Fulcrum Therapeutics, Inc. (FULC) Targets Rare DiseaseFulcrum Therapeutics, Inc. (FULC) is a clinical-stage biopharmaceutical company focused on developing small-molecule therapies to treat genetically defined diseases. Its lead candidate, losmapimod, is being developed for facioscapulohumeral muscular dystrophy (FSHD), a rare and debilitating muscle disorder. Fulcrum’s growth is driven by advancing clinical trials, expanding its drug pipeline, and the growing interest in precision medicine targeting genetic conditions.
On the chart, a confirmation bar with rising volume indicates strong buying interest. The price has entered the momentum zone by moving above the .236 Fibonacci level. A trailing stop can be placed just below this level using the Fibonacci snap tool to protect profits while leaving room for further gains.
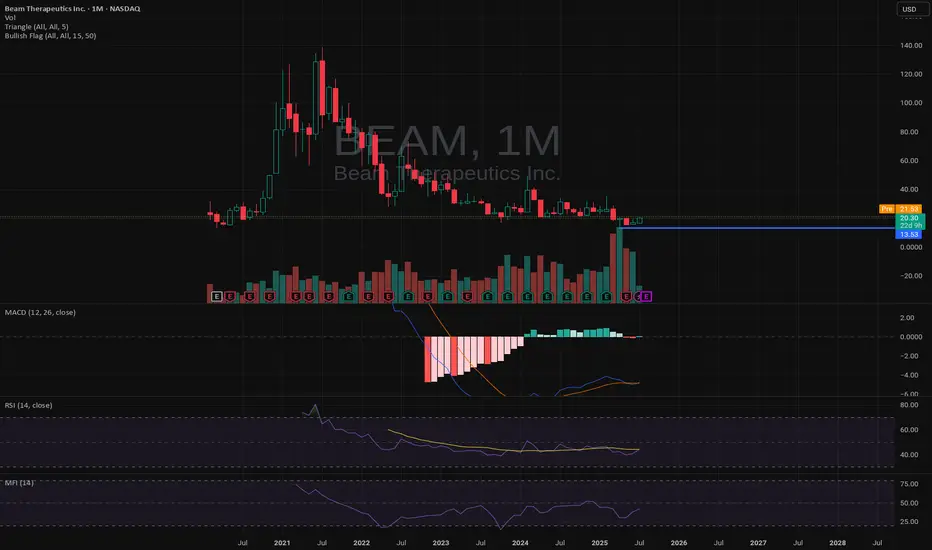
BEAM Unsure.BEAM
Well this stock has seen it's ups and downs.
Has it formed a base? I don't know.
It looks to be a long for me.
let me know.
Thanks
VALE - LONG just like it here. $10VALE
I'm long this ticker. I will hang on to it and ride out what comes for the next while.
I like the commodities so it plays well with that.
Looks to be setting another higher low.
Cheers.
Just my own crazy thoughts.
cheers

Intel Share Price Hits 3-Month High Without Clear CatalystIntel (INTC) Share Price Hits 3-Month High Without Clear Catalyst
Intel Corporation (INTC) stocks rose by over 7% yesterday, making them one of the top performers in the S&P 500 index (US SPX 500 mini on FXOpen). As a result, the stock price reached its highest level in three months.
What’s notable is the apparent lack of clear drivers behind the rally. According to Barron’s, the increase in INTC shares could have been triggered by a rating upgrade from Wall Street analysts or a corporate announcement – yet no such developments have occurred. "Nothing new or fundamental," says Mizuho managing director and technology specialist Jordan Klein.
At the same time, from a technical analysis perspective, the INTC price chart is showing significant developments. Examining these price movements may provide clues as to what’s fuelling the recent rise.
Technical analysis of INTC stocks
For many months, the share price had been confined within a downward channel. However, the psychological level of $20 acted as a strong support – repeated attempts by bears to push the price lower ultimately failed.
Bearish patterns in INTC’s chart may have led to a supply squeeze, as holders were given repeated reasons to sell (particularly against the backdrop of Nvidia’s success). Yet the bullish reversals near the $20 mark suggest that institutional interest was accumulating the stock at what was perceived to be a deeply discounted level – a characteristic sign of the Accumulation Phase in Wyckoff methodology.
It is this lack of available supply that could explain the sudden price rise in the absence of obvious news catalysts.
Since early summer, INTC shares have been making higher highs and higher lows, breaking upwards through the descending channel and beginning to form the early stages of a new bullish trend (highlighted in blue). Should fundamental catalysts emerge in the near term, they may serve as the spark to accelerate this nascent rally.
This article represents the opinion of the Companies operating under the FXOpen brand only. It is not to be construed as an offer, solicitation, or recommendation with respect to products and services provided by the Companies operating under the FXOpen brand, nor is it to be considered financial advice.

AAPL – Long Bias SetupWhy I’m Watching the Long Side:
✅ Clean Bounce from $190 Zone
That \$190–195 level has held multiple times since April. Last two dips got scooped with solid demand = solid base forming.
✅ Break of Recent Lower Highs
Stock finally pushed through prior resistance around $205–208. Structure shift. Possible start of a trend reversal.
✅ Buy Signal Triggered (Green "4")
Chart printed a buy signal near lows with follow-through = momentum may be shifting.
✅ Holding Above Short-Term Moving Level
Price is now holding above the short-term EMA (teal line), showing trend momentum flipping bullish.
✅ Vol Picking Up
Volume on the green days has increased, signaling interest from bigger players.
---
Trade Plan:
• Entry Zone: \$208–211
• TP1: $220 (near previous supply)
• TP2: $230 (gap fill zone)
• TP3: $250
• SL: Just below $204 = exit
---
⚠️ Caution:
Still under red resistance band ($220). Needs real strength to reclaim it.
Watch how price reacts there – could stall or squeeze.
📅 Next earnings 3 weeks out. Could build up into it.
---
💬 Setup looks constructive. Playing the reversal with tight risk. Not chasing, just reacting. Trade your plan.

Trade Reflection – PLTR Long Setup🧠
Lately, I’ve been focusing on breakouts from key resistance levels supported by ascending trendlines. Today’s trade on NASDAQ:PLTR was a textbook example.
📈 Ticker: PLTR
🔁 Trade Type: Long
🕒 Timeframe: 30-min
📍 Entry Zone: $139.24 (Pre-market breakout)
🎯 Target: $146.66
🛑 Stop Loss: Below $137.00
🔍 Why I Took This Trade:
Price was consolidating right below strong horizontal resistance around $139.
An ascending trendline formed over the past few sessions, creating bullish pressure.
Clean breakout with volume and confirmation on retest.
🧠 What I Learned:
Waiting for confirmation at resistance breakout is key.
Clean structure + trendline + consolidation = high-probability setup.
Reward-to-risk ratio was favorable, with room to $146.
✨ Whether this trade hits TP or not, the setup followed my plan. That’s a win.
📊 Logging and reviewing setups like this helps me stay disciplined and improve daily.

LMT – Long Setup IdeaLMT – Long Setup
Current: \$463.01 | Premarket: \$464.01 (+0.22%)
---
📊 Why I’m Eyeing the Long:
✅ Strong base at \$450–460 – buyers defending this level hard for months. Solid floor.
✅ Premarket green after red day = possible bounce play incoming.
✅ Deutsche Bank PT \$472 – not huge, but confirms it’s not dead weight.
✅ Defense sector = safety play in choppy markets. War tension = bullish tailwind.
✅ Low vol + tight range = setup for breakout. Watching for volume push.
---
🎯 Trade Plan:
• Entry: $460–464 zone
• Short- Term TP: $480
• Medium-Term TP: $500+
• SL: Clean below $450 (tight risk)
---
📅 Earnings in 13 days – this could move early.
⚠️ Watch volume at open.
---
Just my setup – trade your plan. Let’s see what the tape gives us.

BIG 810% in 1 day $0.60 to $5.46💥BIG 810% in 1 day 📈 $0.60 to $5.46 there were almost more halts than candlesticks that's how wildly it traded NASDAQ:PROK
Other active stocks: NASDAQ:SCAG NASDAQ:BTCS NYSE:SRFM NASDAQ:BMGL NYSE:WOLF
#stocks #stockmarket #trading #trader #daytrade #strategy #teamwork #chart #analysis
