Quick View: $SLB- Great consolidaiton on the daily with EMAs+Price ready to make THE Move.
- The hourly looks good with a perfect box

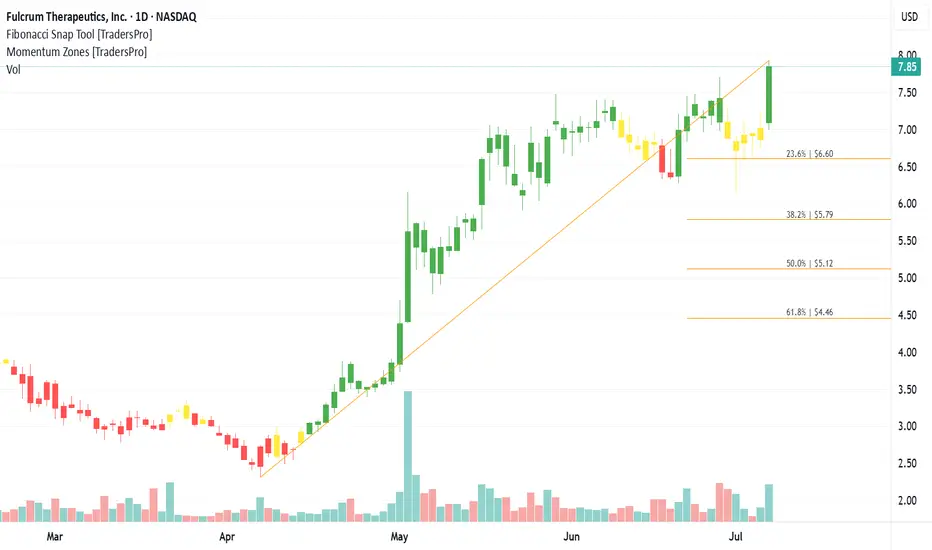
Fulcrum Therapeutics, Inc. (FULC) Targets Rare DiseaseFulcrum Therapeutics, Inc. (FULC) is a clinical-stage biopharmaceutical company focused on developing small-molecule therapies to treat genetically defined diseases. Its lead candidate, losmapimod, is being developed for facioscapulohumeral muscular dystrophy (FSHD), a rare and debilitating muscle disorder. Fulcrum’s growth is driven by advancing clinical trials, expanding its drug pipeline, and the growing interest in precision medicine targeting genetic conditions.
On the chart, a confirmation bar with rising volume indicates strong buying interest. The price has entered the momentum zone by moving above the .236 Fibonacci level. A trailing stop can be placed just below this level using the Fibonacci snap tool to protect profits while leaving room for further gains.
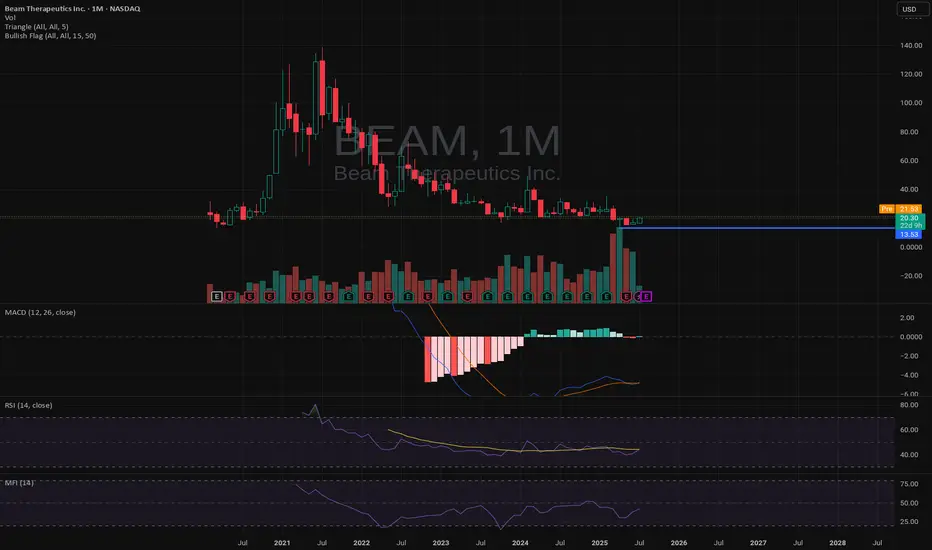
BEAM Unsure.BEAM
Well this stock has seen it's ups and downs.
Has it formed a base? I don't know.
It looks to be a long for me.
let me know.
Thanks
VALE - LONG just like it here. $10VALE
I'm long this ticker. I will hang on to it and ride out what comes for the next while.
I like the commodities so it plays well with that.
Looks to be setting another higher low.
Cheers.
Just my own crazy thoughts.
cheers

Intel Share Price Hits 3-Month High Without Clear CatalystIntel (INTC) Share Price Hits 3-Month High Without Clear Catalyst
Intel Corporation (INTC) stocks rose by over 7% yesterday, making them one of the top performers in the S&P 500 index (US SPX 500 mini on FXOpen). As a result, the stock price reached its highest level in three months.
What’s notable is the apparent lack of clear drivers behind the rally. According to Barron’s, the increase in INTC shares could have been triggered by a rating upgrade from Wall Street analysts or a corporate announcement – yet no such developments have occurred. "Nothing new or fundamental," says Mizuho managing director and technology specialist Jordan Klein.
At the same time, from a technical analysis perspective, the INTC price chart is showing significant developments. Examining these price movements may provide clues as to what’s fuelling the recent rise.
Technical analysis of INTC stocks
For many months, the share price had been confined within a downward channel. However, the psychological level of $20 acted as a strong support – repeated attempts by bears to push the price lower ultimately failed.
Bearish patterns in INTC’s chart may have led to a supply squeeze, as holders were given repeated reasons to sell (particularly against the backdrop of Nvidia’s success). Yet the bullish reversals near the $20 mark suggest that institutional interest was accumulating the stock at what was perceived to be a deeply discounted level – a characteristic sign of the Accumulation Phase in Wyckoff methodology.
It is this lack of available supply that could explain the sudden price rise in the absence of obvious news catalysts.
Since early summer, INTC shares have been making higher highs and higher lows, breaking upwards through the descending channel and beginning to form the early stages of a new bullish trend (highlighted in blue). Should fundamental catalysts emerge in the near term, they may serve as the spark to accelerate this nascent rally.
This article represents the opinion of the Companies operating under the FXOpen brand only. It is not to be construed as an offer, solicitation, or recommendation with respect to products and services provided by the Companies operating under the FXOpen brand, nor is it to be considered financial advice.

AAPL – Long Bias SetupWhy I’m Watching the Long Side:
✅ Clean Bounce from $190 Zone
That \$190–195 level has held multiple times since April. Last two dips got scooped with solid demand = solid base forming.
✅ Break of Recent Lower Highs
Stock finally pushed through prior resistance around $205–208. Structure shift. Possible start of a trend reversal.
✅ Buy Signal Triggered (Green "4")
Chart printed a buy signal near lows with follow-through = momentum may be shifting.
✅ Holding Above Short-Term Moving Level
Price is now holding above the short-term EMA (teal line), showing trend momentum flipping bullish.
✅ Vol Picking Up
Volume on the green days has increased, signaling interest from bigger players.
---
Trade Plan:
• Entry Zone: \$208–211
• TP1: $220 (near previous supply)
• TP2: $230 (gap fill zone)
• TP3: $250
• SL: Just below $204 = exit
---
⚠️ Caution:
Still under red resistance band ($220). Needs real strength to reclaim it.
Watch how price reacts there – could stall or squeeze.
📅 Next earnings 3 weeks out. Could build up into it.
---
💬 Setup looks constructive. Playing the reversal with tight risk. Not chasing, just reacting. Trade your plan.

Trade Reflection – PLTR Long Setup🧠
Lately, I’ve been focusing on breakouts from key resistance levels supported by ascending trendlines. Today’s trade on NASDAQ:PLTR was a textbook example.
📈 Ticker: PLTR
🔁 Trade Type: Long
🕒 Timeframe: 30-min
📍 Entry Zone: $139.24 (Pre-market breakout)
🎯 Target: $146.66
🛑 Stop Loss: Below $137.00
🔍 Why I Took This Trade:
Price was consolidating right below strong horizontal resistance around $139.
An ascending trendline formed over the past few sessions, creating bullish pressure.
Clean breakout with volume and confirmation on retest.
🧠 What I Learned:
Waiting for confirmation at resistance breakout is key.
Clean structure + trendline + consolidation = high-probability setup.
Reward-to-risk ratio was favorable, with room to $146.
✨ Whether this trade hits TP or not, the setup followed my plan. That’s a win.
📊 Logging and reviewing setups like this helps me stay disciplined and improve daily.

LMT – Long Setup IdeaLMT – Long Setup
Current: \$463.01 | Premarket: \$464.01 (+0.22%)
---
📊 Why I’m Eyeing the Long:
✅ Strong base at \$450–460 – buyers defending this level hard for months. Solid floor.
✅ Premarket green after red day = possible bounce play incoming.
✅ Deutsche Bank PT \$472 – not huge, but confirms it’s not dead weight.
✅ Defense sector = safety play in choppy markets. War tension = bullish tailwind.
✅ Low vol + tight range = setup for breakout. Watching for volume push.
---
🎯 Trade Plan:
• Entry: $460–464 zone
• Short- Term TP: $480
• Medium-Term TP: $500+
• SL: Clean below $450 (tight risk)
---
📅 Earnings in 13 days – this could move early.
⚠️ Watch volume at open.
---
Just my setup – trade your plan. Let’s see what the tape gives us.

BIG 810% in 1 day $0.60 to $5.46💥BIG 810% in 1 day 📈 $0.60 to $5.46 there were almost more halts than candlesticks that's how wildly it traded NASDAQ:PROK
Other active stocks: NASDAQ:SCAG NASDAQ:BTCS NYSE:SRFM NASDAQ:BMGL NYSE:WOLF
#stocks #stockmarket #trading #trader #daytrade #strategy #teamwork #chart #analysis

FVRR: Buy the dipFVRR: Buy the dip
.
The backtesting process is essential to validate supply and demand. Low supply volume is a good signal.
.
Let's join plan!
.
US STOCKS- WALL STREET DREAM- LET'S THE MARKET SPEAK!

ABSI - Potential up trend ABSI is currently in a accumulation phase and requires strong volume to break above the blue downtrend line.
The first target is to reach the uptrend line at approximately 3.34. If this level is achieved with high volume, we could then see targets at 4.4 and 5.64.
Stop Loss is set at 2.45

GH 3D: breakout forming inside ascending channelThe price of GH continues consolidating within the top of an ascending channel, confirming bullish structure. The rectangular accumulation has lasted for over three months, with price staying above all major EMAs and MAs - a strong trend confirmation. On the last impulse, volume increased, and now the price is compressing again. A breakout with a retest would serve as a valid entry. First target lies near 61.38, second at 73.66, and third at 87.37 - aligned with the upper range of the medium-term Fibonacci extension. Fundamentally, GH remains a promising biotech pick amid sector rotation and potential Fed easing. EMAs and MAs sit below price, and D/A supports the breakout scenario. Waiting for confirmation before entering.

7/9/25 - $envx - Friends tell friends the truth7/9/25 :: VROCKSTAR :: NASDAQ:ENVX
Friends tell friends the truth
- not a fan of Raj, seems inauthentic on one front... and tbh, that might seem "judgy". i've made my money on wall street reading mgrs in the first 5 seconds i meet them. i'd just not give this guy my money, that's all. it's my human LLM.
- the company financials look ready to "explode" (mm in a good way) if you ask wall street/ expectations. but i don't trust that either. i always do my own work.
- all battery (*cough* meme) tech has done well since april lows
- important to choose names that have solid balance sheets, growth ... and ideally leaders in both respects. i keep coming back to NYSE:SES given it's size, similar if not better growth vs. much larger comps. more chemistry-agnostic software/tech
- so am i actually shorting ENVX. no. but i find too many ppl these days will put a "buy" on things that are buys and "holds" (whatever that means) and actual sells get a "ehh... keep it..". NO. if it's not working OR you have better alternatives dump that trash.
Listen. class in session here for a moment.
One of the most important things you can do in trading, poker and life (all are very similar - also different - but similar)... is when you have a bad hand, you get introduced to a sus person... you find yourself in an unfavorable decision AND you can decide to either engage or just say "thanks but no thanks"... say "thank you very much and no thank you". Don't say "thank you and i'll follow up" or "thank you and i'll consider it". forget that waste of your time. "thank you" (be polite) and "no thank you" all in the same sentence. if you've got some history/ legacy/ other ties.. more complicated. But of course, when we look at stonks, we can have that decision. If we lose a bit of coin. what. f'n ever. nobody EVER shoots 100%. or 80% or even 70%. move on. take your losses. move on. if a stock is non-obvious. move on. maybe you come back to it. should be for a good reason beyond FOMO. but re-consider. alas. you have the decision to say no.
we talk about time being scarce. so is your ability to give two shoes about some of these stocks. if you're not high conviction, then forget it. time is too short to diversify and make excuses.
make time for those who matter
make space in your PnL for the stocks that will drive results
and forget the rest.
Gn my friends
V

7/9/25 - $flnc - Does the AES offer...7/9/25 :: VROCKSTAR :: NASDAQ:FLNC
Does the AES offer...
- AES *apparently* got a takeout offer y day (check stock px)
- i'd believe it, as long as they don't get coreweave'd (*sigh*)
- that aside, i can swear i was reading about grid scale M&A in my newsflow and Grok isn't helping tn
- I think FLNC is super interesting given it's AES/ siemens ownership and given this AES topic/ buyout
- perhaps this asset gets divested
- i'd guess *if* and that's a h3ll of a guess... maybe a lot higher 30-50%
- probably a stock to have on high alert... if breaks the $9/$9.50 level i may ape with a bit more conviction.
V

Can Ondas Holdings Redefine Defense Tech Investment?Ondas Holdings (NASDAQ: ONDS) is carving a distinct path in the evolving defense technology landscape, strategically positioning itself amid escalating global tensions and the modernization of warfare. The company’s rise stems from a synergistic approach, combining innovative autonomous drone and private wireless network solutions with shrewd financial maneuvers. A pivotal partnership with Klear, a financial technology firm, provides Ondas and its growing ecosystem with non-dilutive working capital. This off-balance-sheet financing mechanism is crucial, enabling rapid expansion and strategic acquisitions within the capital-intensive defense, homeland security, and critical infrastructure sectors without shareholder dilution.
Furthermore, Ondas's American Robotics subsidiary, a leader in FAA Type Certified autonomous drones, recently cemented a strategic manufacturing and supply chain partnership with Detroit Manufacturing Systems (DMS). This collaboration leverages U.S.-based production to enhance scalability, efficiency, and resilience in delivering American Robotics' advanced drone platforms. This domestic manufacturing focus aligns seamlessly with initiatives like the "Unleashing American Drone Dominance" executive order, which aims to bolster the U.S. drone industry, fostering innovation while safeguarding national security against foreign competition.
The company's offerings directly address the paradigm shift in modern warfare. Ondas's private industrial wireless networks (FullMAX) provide critical secure communication for C4ISR and battlefield operations, while its autonomous drone solutions (like the Optimus System and Iron Drone Raider for counter-UAS) are integral to evolving surveillance, reconnaissance, and combat strategies. As geopolitical instabilities intensify, driving unprecedented demand for advanced defense capabilities, Ondas’s integrated operational and financial platform is primed for significant growth, attracting considerable investor interest with its innovative approach to capital deployment and technological advancement.

7/9/25 - $dpro - PSA... rotate7/9/25 :: VROCKSTAR :: NASDAQ:DPRO
PSA... rotate
- saw some d00d shilling this
- couldn't help myself
- this isn't a company with a future outside M&A or restructuring
- the meme move is simply what we've gotten in chitco's since the liquidity bottom in april
- you do you
- but friends don't let friends drive drones or PnL drunk
V

7/9/25 - $sldp - Pass.7/9/25 :: VROCKSTAR :: NASDAQ:SLDP
Pass.
- this thing just has kinda weak energy top line growth
- maybe that changes
- burns cash (which is "fine" - big quotes - if there's some real lift off on growth, which there's NOT)
- my impression (change my mind) is this co got listed to create bag holders for the bag holders
- not going to look at it much more closely tn given it's getting late and i need to get thru a few more of these
- but high net cash is good - they won't be dunking on the market
- i just think the stonk px performance reflects the high-beta-high-meme sector (and there are honestly some good reasons some of the stocks worked)... but idk if i'd be paying up for this one
- sidelines.
V

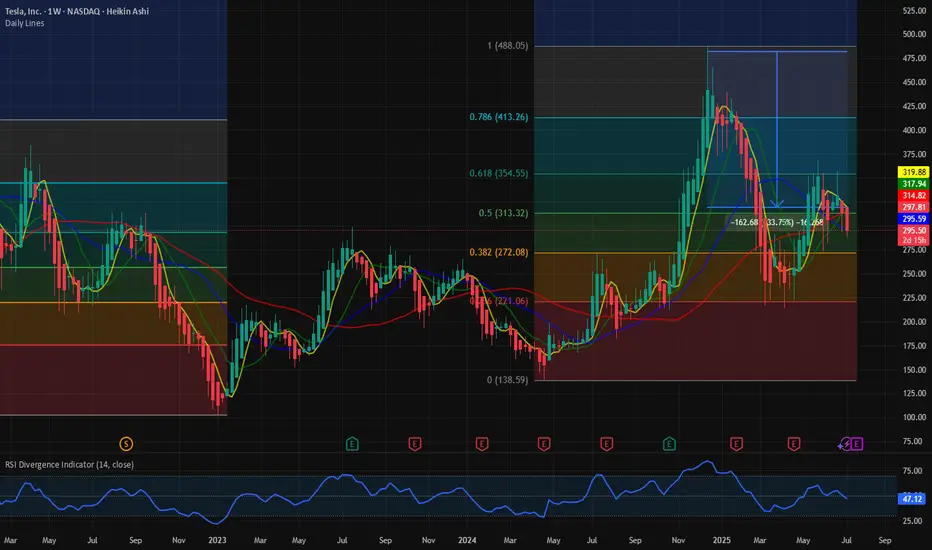
$TSLA: Battleground stock. There’re better way to make money. In this bull market where almost all the stocks are working, NASDAQ:TSLA seems to be still in the penalty box. When NASDAQ:NVDA , NASDAQ:MSFT are at ATH and most of the Mag7 are near to the ATH. NASDAQ:TSLA is still 33% below its ATH of 484 $. And the price action is not particularly bullish. This week NASDAQ:AVGO crossed NASDAQ:TSLA with a larger Market Cap cos. May be NASDAQ:AVGO should replace NASDAQ:TSLA in MAG7. A food for thought.
With such poor price action and the price stuck within the 0.618 and 0.382 Fib retracement levels the stock has not looked bullish recently. IN this recent market reversal all the speculative sectors like Quantum, Space stocks and Drone stocks are working, NASDAQ:TSLA is still searching for direction. In my opinion NASDAQ:TSLA has a great future with a visionary leader, but it might end up being a good company but not a good stock. With controversy surrounding the leadership it has become a battle ground stock. There are many large cap liquid stocks where the positive momentum is working. Until the stock breaks out of this consolidating pattern it’s better to make money somewhere else.
Verdict: Stay on sidelines for NASDAQ:TSLA stock. Accumulate if you need to. Buy it above 400 $ once momentum is back.
7/9/25 - $ampx - Hrm. Got my interest.7/9/25 :: VROCKSTAR :: NYSE:AMPX
Hrm. Got my interest.
- high energy, high power lithium ion warez for aviation etc.
- i think what's most interesting are two things
1/ i first came across this in march '24 and said "not interested - bonkers valuation" and in some resepects... for a year... esp given mkt had been ripping, it was awful risk-on reward
2/ NOW, if you look at the revenue #s over that period forward, they basically continuously crushed. and the YoY comps are almost laughably high... >100% growth for the next 2 years. that's, let's get serious... pretty amazing if true
- gross margins improving (lol at these scale growth rates... i'd HOPE)
- and we get to EBITDA breakeven maybe late '26... by '27?
- co doesn't really burn much cash, 30-40 (M) bucks a year... they'll probs need to raise, maybe it gets well-received given px action recently idk.
- definitely serving an interesting niche.
- valuation is basically in no-man's-land
- price action is not only KING, but taking a step back... it can be somewhat justified. this isn't just some vaporware trust-me-bro-quantum-is-the-future-in-2030-BS-situation
- and the chart looks pretty.
- i'm not going to trade this. eventually you get older, you narrow down your arsenal to stuff that is high impact high hit rate... and you stick to it. but i'd consider longing this from a trading perspective. problem is... i have too much discipline at this pt and again, my comp is NYSE:SES which hasn't really moved, is 10x cheaper (literally) in terms of enterprise value and only 1/2 the revenue and better mgns. so yeah.
- i'm not suggesting this is a short. i'm not gonna buy it. i might buy it lower. i'm no longer doom and gloom like a year ago.
- but no thanks. i still need moarrrr.
V

7/8/25 - $qs - Pass. No thanks.7/8/25 :: VROCKSTAR :: NYSE:QS
Pass. No thanks.
- Great story bro, company
- Does this thing continue to ape higher a la meme market? idk idc
- I think pre-revenue stuff can be interesting if there's clear visibility toward scaling revenue or the costs are contained, but let's be real... 4 years post de SPAC and this thing has just ""now"" turned the corner
- maybe.
- i'll give you that. maybe.
- i'm not close to it, i'm going to turn over the battery "rocks" tonight to see if i can find anything more compelling than NYSE:SES (ironically, the smallest cap battery-related name... usually it's the opposite - the big stuff is more de-risked and obvious)
- so here we have a co that's just doubled it's stonk price on this announcement
- do investors genuinely believe manufacturing is "easy" or this transition to scaling or monetizing the JV w VW will start to justify a nearly $4B enterprise value "easily"?
- here's what i'll give the bulls, especially those coming to the story fresh and without all this: run-rating nearly $400mm in R&D is probably worth something (*throws finger into rear end and then into the air*) in the $400/.2 = $2 bn region (20% is a high benchmark for risky tech, it should be higher but again let's give a lil cred). I tend to like to double this (usually for co's that r revenue-generating and have traction) but let's just throw V's rules out the window and do it here - alas i don't know what i don't know - and perhaps there's something here. So that's $4 bn. So i better have a good idea or alpha to make money at this pt.
- add to this a TON of co's (that shouldn't be public co's) are doing all sorts of whacky jerk fests with banks... ATMs, converts... you name it! scammy banks are going to have a great year! so then i have to believe this co won't do any "proactive" raise. they shouldn't *need* to given nearly $1 bn in cash on the books... but again, tis not like they're going to buy back stock... so even if the risk is low... it's there.
- all in: i'd need a CLEAR catalyst that the co was hitting strides with OEMs, VW was seriously interested in taking this thing out and locking down this game changer tech. and that's just not what i want to have in my book at a 50 bps or 100 bps position *crossing fingers*. i go big. and it's hard for me to understand where i'd get that conviction.
- so i keep my finger on the battery pulse. it's a sector that is probably most exciting to me from an energy-investment perspective over the coming years. there will be some massive winners here. maybe NYSE:QS is one of those.
- but i'm going to pass.
V

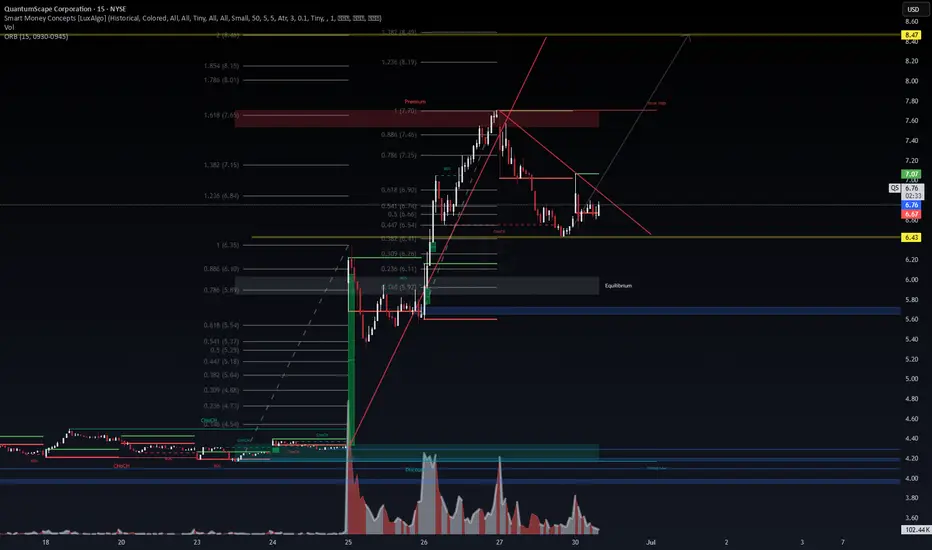
QuantumScape ($QS) – VolanX SMC Activation Zone🔍 Technical Context
QuantumScape is setting up for a potential bullish breakout after consolidating within a descending wedge and maintaining structure above the golden Fibonacci pocket (0.5–0.618 zone). Smart Money Concepts (CHoCH + BOS) have been triggered, indicating the start of institutional positioning. Volume has compressed, often a prelude to explosive movement.
📊 VolanX Probability Matrix
🎯 Probability of Bullish Continuation (Target $8.47): 70–75%
📉 Probability of Failure (Drop to $6.43 or lower): 25–30%
🧠 Key Levels & Confluences:
Entry Zone: Break & close above red trendline ($6.85+)
Premium Target: $7.65–7.70 (Liquidity Zone)
Final Target: $8.47 (Fib 2.0 Extension)
Stop-Loss Invalidation: Below $6.43 (structural break)
SMC Zones: Liquidity void + breaker retest + CHoCH confirmation
📈 Risk-Reward Setup:
RRR ≈ 3.8x, with structural confluence across Fib, volume, and SMC
💡 “We don’t just trade the chart — we activate the timeline.” – VolanX Protocol
🔐 This post is part of WaverVanir International LLC’s multi-asset DSS framework.
#SMC #QuantumScape #VolanX #WaverVanir #Fibonacci #SmartMoneyConcepts #OptionsFlow #LiquidityZones #Breakout #TradingStrategy #RiskReward #TechnicalAnalysis
ZS is starting the early sign of the Wyckoff distribution phaseMarkup (Phase E) that has been going on for months. But look closer. The momentum is getting tired. The daily chart is where the truth comes out. After that magnificent run, the price has stalled and started moving sideways for a month.
Entry Level: Initiate a trade if ZS rallies to the $325 - $327 area and fails to hold its gains.
Price Target: The ultimate target is the start of the markdown phase, with an initial price objective around $250.
Stop Loss: A confirmed weekly close above $335 would indicate the distribution pattern has failed and you should exit the trade.

$AAPL: Multi-Cycles At PlayResearch Notes
Documenting New Interconnections
Wave properties:
3rd frame of reference
Multi-Cycles
Fibs of broader cycle
Using coordinates of the recent established cycles for predictive/guiding properties:
