$QCOM | Long SemisIve been looking through semis for trades because they are showing relative strength compared to other sectors. NASDAQ:QCOM is one of my favorites at the moment alongside $MU. I expect this trade to take a while to play out--maybe 6 months or so.

VISA - A Pump & Dump? Help me understand please.To places where no stock price has ever gone before..
What makes VISA so special?
The credit industry is currently staring into the abyss due to massively rising payment defaults.
Why is VISA skyrocketing in price, breaking through every barrier as if they were made of butter?
I don't know, and I'm very puzzled.
What will happen if economic conditions become even more difficult and the madness we're currently experiencing fully hits, and hardly anyone can service their consumer debt anymore?
I think at that point, VISA will look like a
Pump & Dump too like many others.
I'd appreciate any info on why VISA is rising so much.

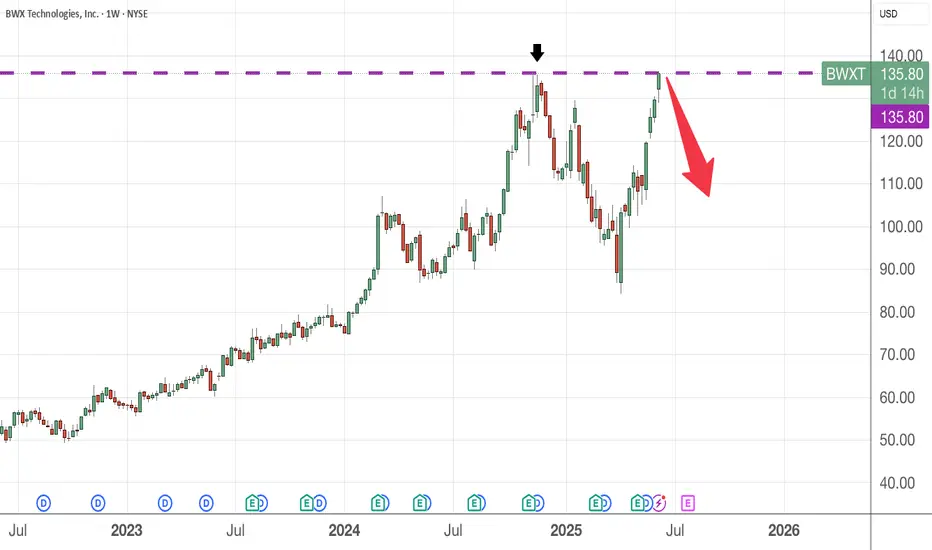
A possible shorting target - BWXT Fundamentally, this company share price is overvalued , fair value around the 90 dollar mark. Now, we are seeing the price action hitting the resistance level once more.
On a smaller time frame, the bullish stance remains and looks likely to break above which I suspect is false move to trap bulls before reversing down. Let's see how it plays out in a week or two.
AMZN Struggles at Trend-Barrier and ResistancePrice is still in upward mode.
Why am I bearish?
1. Rejection in the Resistance Zone
2. Second Hagopian
3. Close below the Red Forks 1/4 Line
PTG1 is the Center-Line.
Potential further PTG's below at the 1/4 Line and then of course the L-MLH.
Playing it with Options which give me much more leeway. For a hard Stop I would put it right behind the last high above the TB.

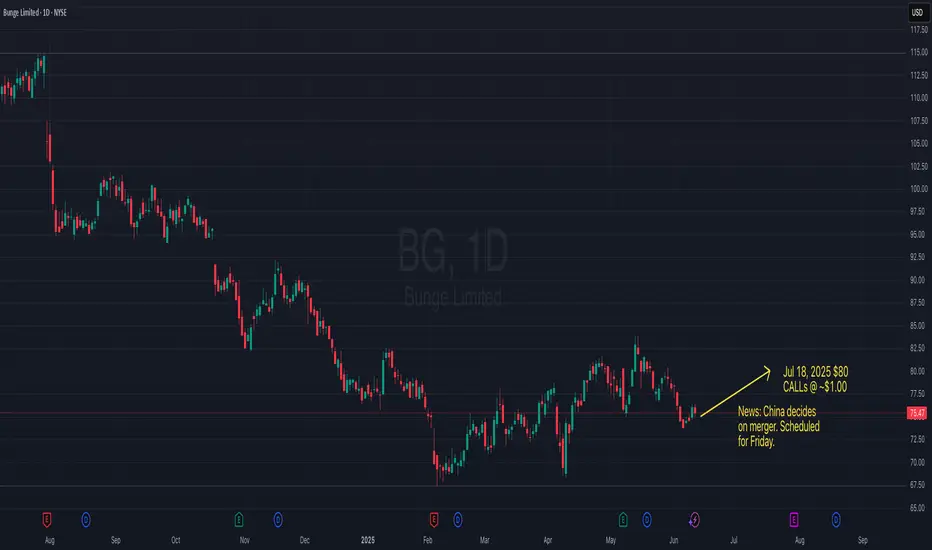
Can BG get at least to $80 on news?BG is undervalued. News from China on Friday to approve merger deal. CALLs are cheap. Can it at least get to $80? Buy the Jul 18, 2025 $80 CALLs. Best scenario is to close it as the price nears the strike, and it depends on what time the news comes out. Good luck.
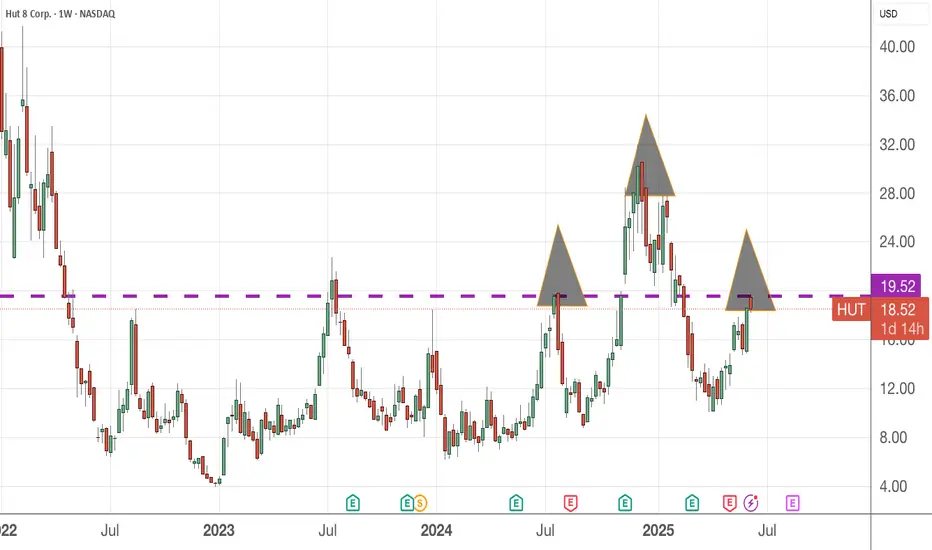
Hut 8 - could this give you heart ache instead ?This is in the crytocurrency space and I am not familiar with this asset class. That is why I only advocate 1% of my capital for speculative trade.
From the weekly chart, it appears a H&S pattern is formed and the dotted line represent the resistance level that the price action is attempting to break above since Aug 2022.
For those who bought at 24 price level, I guess your option is to wait out for it revisit this level or higher. And for those who wish to go LONG, wait for the breakout with a bullish sign first. Alternatively, seek for better asset class/companies to invest in.
HIMS- possible breakout as stock held 21 EMAHIMS - Stock after massive uptrend last month. stock has been consolidating and holding above 21 EMA support level. looking for more upside above $58 for a move towards $65 and $78, calls above $58 and $60 looking good. Stock is decent at indicators

Head and Shoulders Pretty clear a head and shoulders formation has presented itself. But honestly….aside from that there are a lot of fundamentals that don’t jibe with Mgt. press releases. Anybody else getting those signals from reports and actual business advances?

Dead Cat BounceOn the daily level, we see a 5.09% risk on the upside, whereas on the downside the risk factor comes in at 4.07% for now. From a risk perspective, resistance on a closing basis stands at 40685, yet the risk on the downside begins at 37135.

AI Chip Stocks NVDA and AMD Showing 5 Wave RiseNASDAQ:NVDA and NASDAQ:AMD are both showing 5 wave rise in weekly chart after a correction in WXY. I haven't checked but other AI related stocks also might be doing something similar.
Once the 5 waves are over, we can expect some correction but the 5-wave rise post a correction typically signals fresh uptrend so it might be worth keeping an eye on these stocks. Waiting till retracement/correction of this rise is complete.

$CACI | Buy The PullbackNYSE:CACI broke out of a bullish flag and has corrected on the daily and 4h timeframe. Looks good for a long. Options chain is ugly--wide bid/ask and no volume but I'm going to try to find some tradable options.

$COIN i following this gann arc quiet nicely!once price breaks the arc it will gravitate to the next one

Aggressive Trend Trade 1HAggressive Trend Trade 1H
- short trend
+ volumed T1
+ support level
+ biggest volume 2Sp+
Daily Trend
+ long impulse
+ T2 level
+ support level
+ 1/2 correction"
Monthly CounterTrend
"- short balance
+ expanding ICE
+ support level
+ unsuccessful biggest volume manipulation"
Yearly Trend
"+ long impulse
+ 1/2 correction
- below exhaustion volume?
- below SOS"
Will add more when 5M, 1H or 1D will show entry point

Ascending TriangleLook for upcoming breakout to the upside. If you know how to calculate the breakout than I don’t need to explain it.

Lemonade Inc.: Breakout in Motion — Cup, Flag, and No BrakesLemonade Inc. (LMND) is accelerating after a clean breakout from a textbook cup with handle pattern, where the handle formed as a tight bullish flag. The breakout occurred around $32, and since then, price action has been sharp, controlled, and uncorrected — currently trading at $42.42 with buyers clearly in charge.
On the fundamental side, LMND is moving through a recovery phase: operational losses are narrowing, revenue is stabilizing, and the company is aggressively leveraging AI to automate its insurance processes. Expansion into Europe continues, and institutional interest is visibly rising — confirmed by volume building alongside price. Within the insuretech sector, LMND is starting to look like a comeback story rather than a cautionary tale.
Technically, the setup remains strong:
– Golden Cross confirmed (EMA50 crossing EMA200)
– EMA50/100/200 all below price — bullish structure firmly intact
– Volume expanding on up-days — healthy confirmation
– RSI hovering in the 60–65 range — momentum is intact, no signs of exhaustion
Targets remain aligned with the structure:
– tp1 = $64 — measured move from the flag
– tp2 = $94 — full realization of the cup pattern
Tactically, this is no longer a “wait and see” setup — the move is in progress. No correction so far, only continuation. Momentum traders may consider entries into strength. Above $45, the move could accelerate further as more participants recognize the structure.
LMND is showing technical and fundamental alignment — confirmed breakout, improving narrative, and strong trend structure. While the impulse holds, this chart favors continuation, not hesitation.

MSFT Surges to Record High, Sustaining Bullish MomentumMicrosoft (MSFT) has demonstrated remarkable resilience, fully recovering from losses incurred during the tariff war sell-off. The stock has even achieved a new all-time high. This performance underscores the stock’s persistent bullish trend. The low recorded on April 7, 2025 likely serves as a robust support level during future pullbacks. The rally from this low is unfolding as a classic five-wave impulse pattern, indicative of strong upward momentum, with wave (3) nearing completion.
From the April 7 low, wave (1) concluded at 394.65, followed by a pullback in wave (2) that bottomed at 355.67. Wave (3) has since extended higher, exhibiting its own internal impulse structure. Within wave (3), wave 1 peaked at 380.39, with wave 2 dipping to 375.19. The stock then surged in wave 3 to 459.58, followed by a wave 4 retracement ending at 448.91. A detailed 45-minute chart below highlights the final leg wave 5, which further subdivides into a lesser-degree impulse. From wave 4, wave ((i)) reached 463 and wave ((ii)) corrected to 454. Wave ((iii)) climbed to 473.43, and wave ((iv)) dipped to 466.96.
MSFT may experience a slight further upside to complete wave ((v)) of 5 of (3). However, a larger-degree pullback in wave (4) is anticipated soon, setting the stage for one final upward push to conclude the five-wave rally from the April 7 low. This structured advance reinforces Microsoft’s bullish outlook, with key support levels likely to hold firm.

Inverted H & SLeft Shoulder: Formed in late February.
Head: Created in March at the lowest point.
Right Shoulder: Recently completed in early June.
Neckline Breakout: The price is now testing or breaking above the neckline (~$15), which is typically a bullish breakout signal.

$PLTR ONCE IN A LIFETIME FIBONACCI PYRAMID LONG TERM Target 157NASDAQ:PLTR ONCE IN A LIFETIME FIBONACCI PYRAMID
LONG TERM Target 157 🎯
The 50% Golden ZONE held at 66.50 in APRIL with a MASSIVE ALGO STEPPING IN
I am looking for a new 6 figure play here ON DIP BUYS with leaps! I will alert all here
NO CHARGE just Drop a 👍for me!

$TEM - New ATH's Inbound! 50% UpsideNASDAQ:TEM - New ATH's Inbound! 🚀
Bull Flag Breakout = $84.17 🎯
74.20 Cup&Handle Breakout = $110 🎯
WCB forming 📈

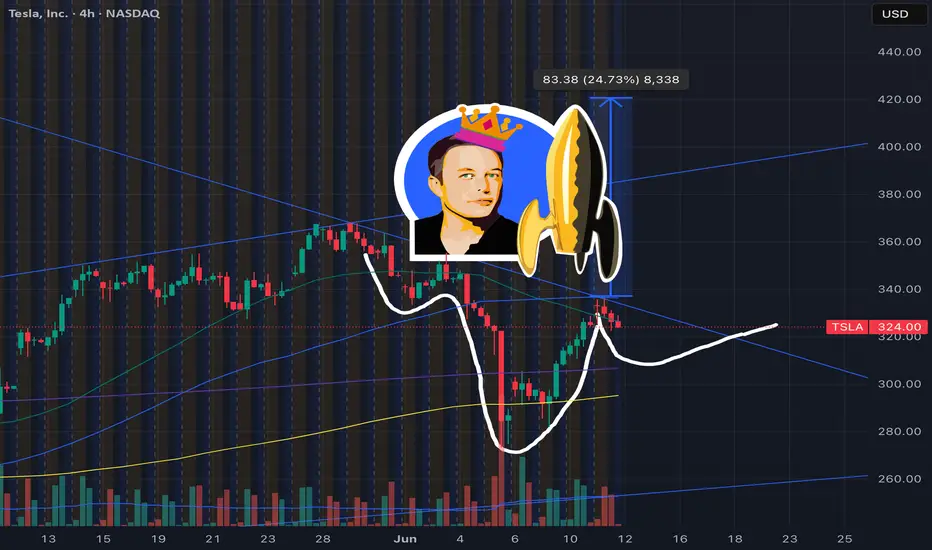
Tesla TSLA 🧠 Breakdown of this setup:
The pattern is an inverse head‑and‑shoulders, signaling a reversal from bearish to bullish momentum.
Technical commentators highlight crucial support near $300, suggesting that’s the fueling station before lift-off
After breaking the neckline, measured upside targets land in the $400–420 zone, fitting that “rocketship” trajectory vibe
🎯 Launch Pad & Destination
Pre‑launch dip: ~$300 sets the inverse H&S bottom.
Ignition point: Breakout above neckline brings liftoff.
Orbit target: ~$420—your mission succesfully completed.
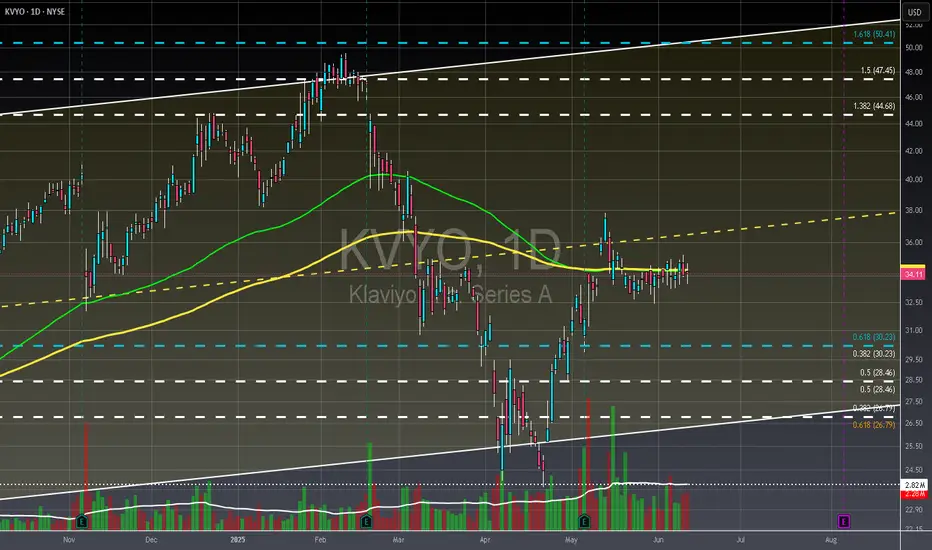
KVYO - Daily - Financial Health is PristineThis company, a Software as a Service (SaaS) marketing platform with a market capitalization of $9 billion, presents a compelling investment case. Its SaaS model inherently suggests lower overhead and a strong potential for sustained profitability, a track record this company has consistently demonstrated. Furthermore, the stock's short interest is currently at its lowest point in its history, indicating a lack of bearish sentiment. A price target between $45 and $60 appears entirely feasible given its robust financial health. While accumulation of the stock has been ongoing, it appears to have concluded around May 1, 2025, suggesting the market is now anticipating a trigger event to initiate a rally. The fact that prominent institutions like Vanguard and BlackRock are among its owners further reinforces confidence in its prospects.
Not financial advice, always do your due diligence
Leave a like👍 and/or comment💬.
We appreciate and value everyone's feedback!
- RoninAITrader
Wednesday Session Debrief (100% Win Rate This Week Thus Far).Early move 1 put @ 935am entry was stacked against a large Bullish FVG so I didn't take it. Call structure came in, but ended up being false positive. As a result i opened a short hedge (01), got chopped up and opened another long and 3 more shorts during 1 hour of choppy price movements as bulls and bears fought over direction to establish control. The final short i opened was when price pushed below $330, exited in very decent profit today considering the unpredictable price action.

BC Call Setup: Targeting $59.80 !"🚤📈"
📝 Caption/Description:
📈 Call Trade on BC (30-min Chart)
🔹 Entry: $58.21
🔹 Stop Loss: $57.26
🔹 Target: $59.80
🔹 R:R Ratio: ~1:2
🔸 Breakout from bull flag + support hold
🔸 Retest of trendline showing strength
💡 Keep an eye on $58.89 for momentum shift
🦅 Chart by ProfittoPath
