$ZM Ready to Fly — Macro Reversal in Play📈 NASDAQ:ZM Ready to Fly — Macro Reversal in Play
Timeframe: 1D | Date: July 8, 2025 | Powered by WaverVanir DSS + SMC + Fibonacci
Zoom ( NASDAQ:ZM ) is coiled at equilibrium after reclaiming key structure and defending the $75.58 level. We’re now positioned for a potential macro reversal targeting a multi-leg rally into the $97.84 zone (1.618 extension).
🔍 Technical Thesis
CHoCH Confirmed: Bullish shift in character post-accumulation
Order Block + BOS Alignment: Clear structure build from May’s low
Equilibrium Compression: Price consolidating at premium/discount boundary
Volume: Compressed + reset after post-earnings fade; volume profile supportive
Target Zones:
⚡️TP1: $80.65 (0.786)
⚡️TP2: $85.07 (1.000)
⚡️TP3: $97.84 (1.618 Extension)
Invalidation: Close below $75.58 = reassessment
🧠 Macro Context
Rates stabilizing, improving sentiment for beaten-down tech
Zoom potentially re-entering institutional rotation cycle
Options flow shifting bullish (see recent block activity on NASDAQ:ZM )
🚀 Bias: LONG
VolanX Signal Score: 73%
RR Potential: 4.1R
Conviction: High (on close > $77.50 with momentum)
This is not a trade—it’s a blueprint. We let structure lead, probabilities guide, and risk define our edge.
📛 Not Financial Advice – For Research and Strategic Education Only
#ZM #Zoom #SMC #OrderBlock #Fibonacci #BullishBias #VolanX #WaverVanir #TechnicalAnalysis #SmartMoney #LiquidityZones #BreakoutTrade #PredictiveSystems #TradingView

CVI LONGWant to hold this yearly fib level. Has been sideways for years. Hoping for breakout to upside. Will hold if we triple bottom.


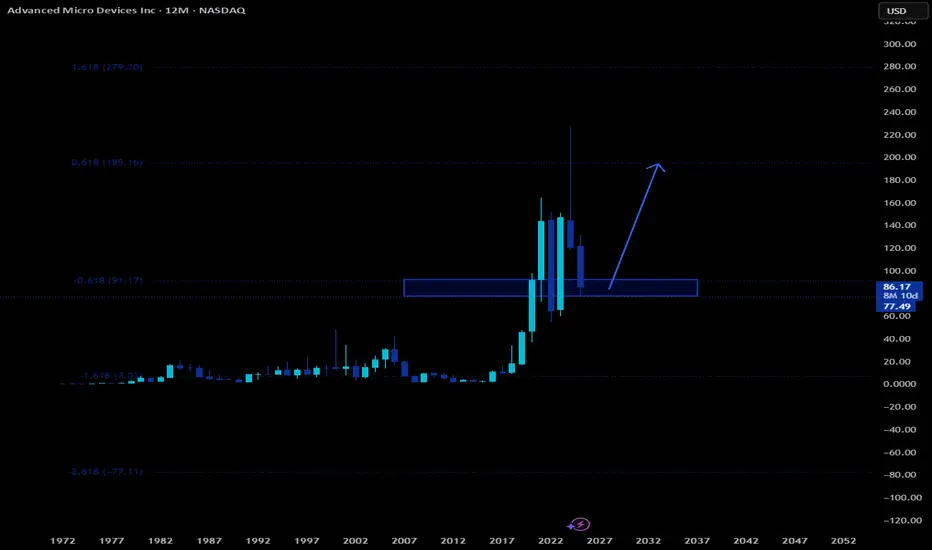
AMD HUGE LONG AMD has a huge level around $180 that is begging to be tested. We are at major support on the yearly. I expect a huge move in AMD in the coming weeks to the upside.
NIO Setting Up for a Big Move!🚨 NIO ALERT 🚨
Looks like a buy & fly setup is loading! 📈💥
📊 Technicals aligning beautifully with macro cycle support.
🔥 Volume picking up. The structure looks explosive.
📍 A clean breakout could send this EV beast soaring!
I'm watching closely for confirmation...
This could get FAST. ⚡

$CRM Long Setup – Coiling at Support with Breakout PotentialSalesforce ( NYSE:CRM ) is consolidating just below the Ichimoku Cloud and building a base around the $265–$270 zone. The MACD is showing early bullish crossover signals with momentum starting to shift, and the price action suggests a coiled spring setup. After multiple tests of the $265 area and a failure to break lower, bulls may now have the upper hand.
The current setup offers a favorable 2.22 risk/reward ratio:
Entry: $269.90
Stop: $257.61 (below recent range lows)
Target: $297.23 (recent swing high + pivot zone)
A clean breakout above $275 could trigger a sharp move into the $290–$300 range. This is a measured, low-volatility breakout setup with a 2–3 week swing timeframe. Risk is tight, and the structure looks healthy if buyers step in above resistance.
Let me know if you’re long here or waiting for confirmation on volume.

QBTS - Is it worth Investing?Hello All,
As i mentioned my previous IONQ publishment , second Quantum Computer company is QBTS.
First of all some figures for QBTS:
Revenue: $15.0 million — up +509% year‑over‑year
Net Loss: $5.4 million (−$0.02 per share), improved from a $17.3 million loss in Q1 2024
Cash Resources: $304 million in cash and equivalents as of March 31 2025. That means that they have enough money to sustain company and to reach profitability.
Commercial Traction:
‣ Ford Otosan deployed a hybrid quantum application, cutting vehicle scheduling time by 83%
‣ Collaborations include Japan Tobacco (quantum-AI drug discovery), Davidson Technologies (U.S. on-site installation), and Jülich Supercomputing Centre
Chart Analysis:
When i look at the chart , i think now it is making a some correction to close gap between 13.50 to 14.60 (I marked it in chart) . If it reachs to 13.50 level i think it could be good entry level.
20.00 is biggest resitance level for now . If it will break this level and stay 3 days above this level next station could be between 23 and 24 .
My long term expectetion in One year maybe less it can be reach the 29.00 - 30.00 Level.
So Same as i mentioned for IONQ ; i would like to be a early investor and beginning of this year i started increase my positions some Quatum computing stocks and QBTS is one of them.
This is just my thinking and it is not invesment suggestion , please do not make any decision with my anaylsis.
Have a lovely Sunday to all.

RGTI - Another Quatum Stock . Should i buy?Hello Everyone,
So last Quantum stock that i try to analyse today is RGTI - Rigetti Computing
First of all some figures for RGTI:
Revenue: $1.47 M — down 52% YoY and 36% QoQ
Operating Expenses: $22.1 M — up 22% YoY
Operating Loss: $21.6 M .
Net Income: +$42.6 M (+$0.15 eps) — driven by ~$62 M one-time non-cash gains .
Cash & Equivalents: ~$209 M as of Mar 31; ~$238 M by Apr 30 after $35 M investment from Quanta Government
Contracts:
DARPA Quantum Benchmarking Initiative Stage A, up to $1 M.
$5.5 M AFOSR award.
£3.5 M Innovate UK grants, including expansion of NQCC QPU from 24→36 qubits
Partnerships & Investments: $35 M strategic collaboration with Quanta Computer at ~$11.59/share
It's a high-risk, high-reward quantum play—valuable for those bullish on long-term quantum commercialization, but likely volatile near-term.
Chart Analysis:
For the time being it is stucked between 14.50 - 11.00 .
If it goes down to 9.00 $ level for me it could be the good opportunity to increase my positions.
14.15 - 14-30 is the resistance level and if this level are broken then it can quickly reach to 16.30 - 16.50 Levels.
Biggest resistance level is in 21.50 and if this level is broken then we can see 25.00 - 26.00 level very quickly.
My long term expectetion in One year maybe less it can be reach the 25.00 - 26.00 Level.
So Same as i mentioned for IONQ and QBTS , i would like to be a early investor and beginning of this year i started increase my positions some Quatum computing stocks and RGTI is one of them.
This is just my thinking and it is not invesment suggestion , please do not make any decision with my anaylsis.
Have a lovely Sunday to all.

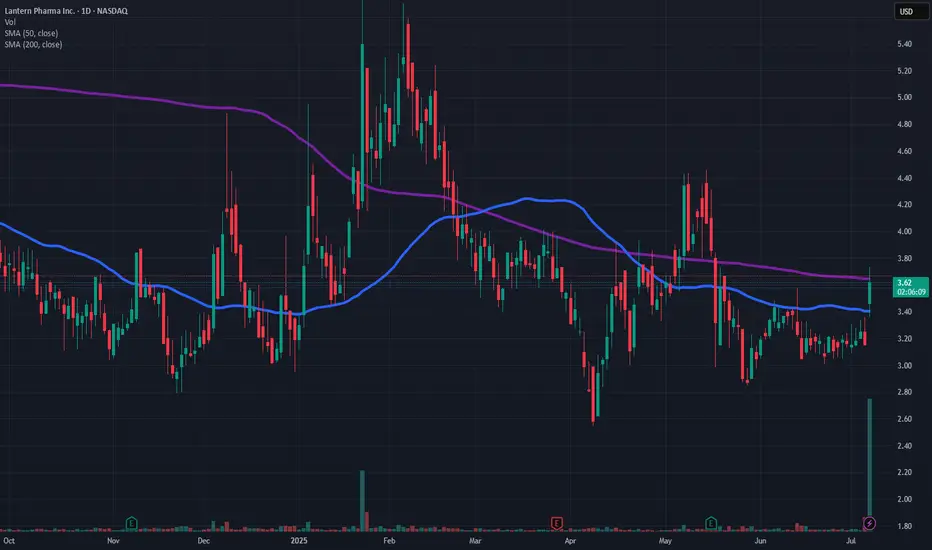
Analysis of Daily Candlestick Chart of Lantern Pharma Inc. LTRN Key Support and Resistance Levels
Support Zones:
Around $3.00: Multiple bounces have occurred here since April.
Lower support near $2.80, which was briefly tested in May.
Resistance Zones:
Immediate resistance at $3.64 (200-day SMA).
Previous resistance zone around $4.00–$4.20 seen in May and February.
Strong resistance around $5.00+, which acted as a top in January and February.
Momentum Indicators
1. Moving Averages (50 & 200 SMA)
50-day SMA (Blue): Currently at $3.40 and was recently crossed to the upside — a short-term bullish sign.
200-day SMA (Purple): Currently at $3.64 — still above the price, which means the long-term trend is bearish but approaching a critical test.
A golden cross (50 SMA crossing above 200 SMA) has not yet occurred but is something to watch for.
2. Volume
A significant spike in volume on the latest green candle indicates strong buying interest and could support further upside momentum.
3. RSI (Relative Strength Index)
Note: The RSI is not directly shown on this chart, but based on the sharp move, it is likely approaching or slightly over 70, indicating overbought conditions in the short term.
4. MACD (Moving Average Convergence Divergence)
MACD is not visible in the image, but based on the crossover of the 50 SMA and recent price surge, it is likely turning positive or has just crossed above the signal line, indicating bullish momentum.
Conclusion:
Current Market Sentiment
Short-term : Bullish
Strong volume surge
Price broke above the 50 SMA
Potential test of the 200 SMA
Medium-term: Neutral to cautiously bullish
Needs to break and hold above the $3.64–$4.00 zone
Long-term : Bearish to neutral
Still below the 200 SMA
Trend remains sideways until a definitive break above long-term resistance
Key Watch Areas
A break and close above the 200-day SMA ($3.64) would signal a stronger bullish reversal.
Failure to hold above $3.40 (50 SMA) could lead to a pullback toward $3.00 support.
Watch RSI to gauge whether the move becomes overextended in the short term.
Nike Looks Ready — A Smart Time to Consider InvestingOn the monthly chart, NIKE has been in a downtrend since November 2021, but the signs are pointing toward a potential trend reversal. Here's why I believe the bottom may already be in:
✅ MACD Histogram shows a strong positive divergence, signaling weakening bearish momentum.
✅ The RSI downtrend line has been broken and successfully retested, confirming bullish strength.
✅ A clear hammer candle has formed at a historical wide support zone, showing strong demand.
Now, price is facing three consecutive resistance levels — and with each breakout, the next zone becomes the new target, (87.5 → 102 → 122).
The structure suggests a step-by-step move higher if momentum holds. Keep an eye on the breakout above the descending trendline — that’s where things could accelerate.

Trade Idea: MARA (Marathon Digital) - High-Probability Breakout📈 Ticker: MARA (Nasdaq)
💰 Entry: $17.28 (pullback to support)
🛑 Stop Loss: $14.03 (below swing low)
🎯 Take Profit: $24.05 (next resistance + Fib extension)
🔢 Risk/Reward Ratio: 3:1
🔍 Technical Setup
✅ Trend: Strong daily uptrend (higher highs & higher lows)
✅ Support/Resistance:
Entry: $17.28 (near 20-day EMA & previous breakout zone)
TP: $24.05 (1.618 Fib extension + prior resistance)
✅ RSI (14): ~60 (neutral, room for upside)
✅ Volume: Rising on up-moves, confirming bullish momentum
✅ MACD: Bullish crossover on daily chart
🎯 Why This Trade?
1️⃣ Strong Uptrend: MARA is in a clear bullish phase with institutional interest.
2️⃣ Optimal Entry: Pullback to $17.28 offers low-risk entry near dynamic support (EMA 20).
3️⃣ High Reward Potential: TP at $24.05 (39% upside) with tight risk (SL at -18.8%).
4️⃣ Bitcoin Correlation: MARA often follows BTC’s momentum (bullish BTC = bullish MARA).
⚠️ Risk Management
Stop Loss: Hard stop at $14.03 (below recent swing low).
Position Size: Risk only 1-2% of capital (adjust shares accordingly).
Trailing Stop: Move SL to breakeven if MARA hits $20.00.
📅 Timeframe & Strategy
⏳ Holding Period: 2-6 weeks (swing to position trade)
📊 Ideal Scenario:
Holds $17.28 support and pushes toward $20, then $24.05.
Volume expansion on breakout = confirmation.
❌ Invalidation Criteria
Close below $14.03 = exit (break of structure).
Loss of 20-day EMA + declining volume = caution.
📌 Final Thoughts
MARA offers a high-reward swing trade with a 3:1 R/R ratio. The setup aligns with:
Bitcoin’s bullish sentiment (if BTC holds $60K).
Strong technicals (EMA support, RSI not overbought).
🔥 Like & Follow if you agree! Would you enter this trade? Comment below! 👇
#MARA #Bitcoin #Stocks #Trading #Crypto #Breakout #SwingTrading
(Disclaimer: Not financial advice. Trade at your own risk.)

Trade Idea: INBX (Inhibrx) - Breakout Play 📈 Ticker: INBX (Nasdaq)
💰 Entry: $19.80 (breakout zone)
🛑 Stop Loss: $14.22 (below key support)
🎯 Take Profit: $39.59 (measured move + Fib extension)
🔢 Risk/Reward Ratio: 2.8:1
🔍 Technical Setup
✅ Trend: Strong daily uptrend (higher highs & higher lows).
✅ Breakout Level: $19.80 (previous resistance, now support).
✅ RSI (14): Neutral (~60), no overbought signal.
✅ Volume: Increasing on upward moves (bullish confirmation).
✅ MACD: Bullish crossover in daily timeframe.
🎯 Why This Trade?
1️⃣ Breakout Confirmation: Price has cleared resistance at $19.80, signaling potential continuation.
2️⃣ Strong Upside Target: $39.59 aligns with:
1.618 Fibonacci extension from recent swing.
Measured move from consolidation range.
3️⃣ Low-Risk Entry: Tight stop below $14.22 (swing low + psychological level).
⚠️ Risk Management
Stop Loss: $14.22 (28% below entry).
Position Size: Risk only 1-2% of capital per trade.
Trailing Stop: Consider moving SL to breakeven if price reaches $25.00.
📅 Timeframe & Strategy
⏳ Holding Period: 3-6 months (position trading).
📊 Ideal Scenario:
INBX holds above $19.80 and continues uptrend.
Volume supports bullish momentum.
❌ Invalidation Criteria
If price closes below $14.22, exit trade (failed breakout).
Watch for bearish RSI divergence or breakdown below $19.80.
📌 Final Thoughts
INBX shows strong technicals for a long-term breakout play. The 2.8:1 reward/risk ratio makes this an attractive swing trade.
🔥 Like & Follow if you found this useful! Would you take this trade? Comment below! 👇
#INBX #Breakout #Stocks #Trading #Investing #TechnicalAnalysis #PositionTrading
(Disclaimer: Not financial advice. Do your own research before trading.)

Coinbase overbought and into massive resistanceI've highlighted a major area of resistance on Coinbase going back 4 years to 2021. Was above the trendline earlier in the week and is now getting rejected. Good short opportunity. Will monitor this one. I just bought some CONI

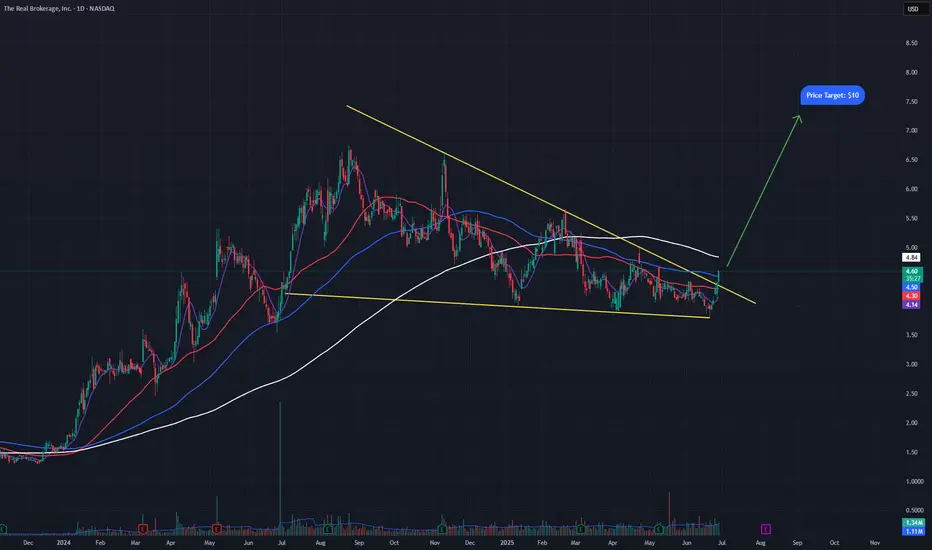
REAX breaking outREAX is a real estage brokerage company that has been in this bullish decending wedge for about a year now. It just broke out yesterday and had a push higher today, confirming the breakout. A measured move of the bull flag puts price targets on this stock around $10 a share, roughly double its current share price. It also sports a Zack's #1 buy rank and is expected to report positive earnings for the first time in company history, when it reports Q2 earnings on August 6th. If this indeed happens, the stock will push much higher, get in early before that happens.
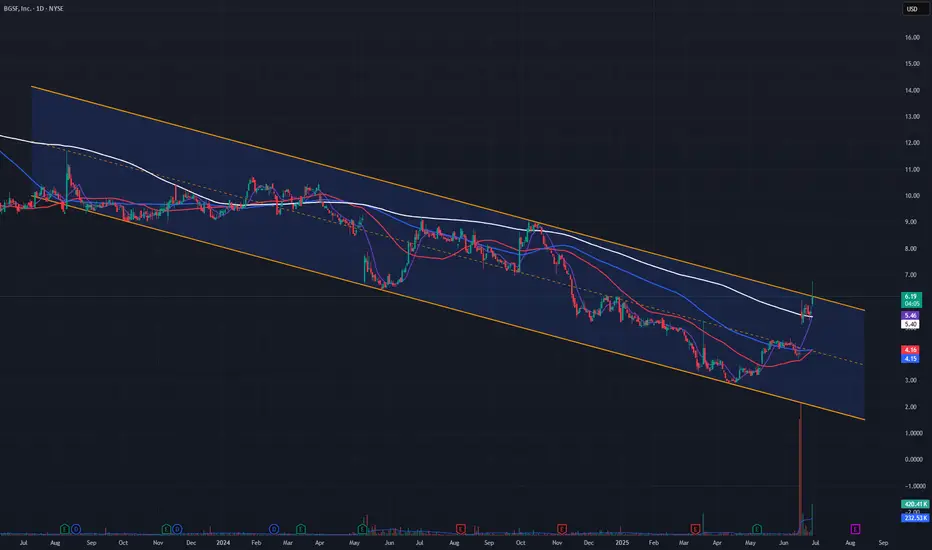
BGSF Inc. Breaking OutBGSF is a staffing company that has been in this descending parallel channel for the last 2 years and is getting ready to finally break the down trend. Last quarter they beat earnings by over 100% adding fuel to the breakout. It sports a Zacks #1 rank, not sure where this could go, only that it looks to be done moving down.
Coca-Cola: Nearing Final Wave III HighDespite recent sell-offs, we still expect Coca-Cola to reach a final high of magenta wave within our beige Target Zone between $76.58 and $81.51, which should also mark the completion of the broader beige wave III. However, an alternative scenario—with a 38% probability—remains in play: in this case, the top of beige alt.III would have already occurred, and a direct decline below $60.62 would likely follow. In either scenario, once the high of beige wave III is established, we anticipate a significant correction.
📈 Over 190 precise analyses, clear entry points, and defined Target Zones - that's what we do.

HERBALIFE has a good weekly breakoutHERBALIFE Has a good weekly breakout entry can be done now or in the re-test level near 9.23-9.5
Target expecting upside till 12.7/15.7
short to mid term time frame.
Long term it has potential to go 30/40
Earnings report has been improving over last couple of quarters.

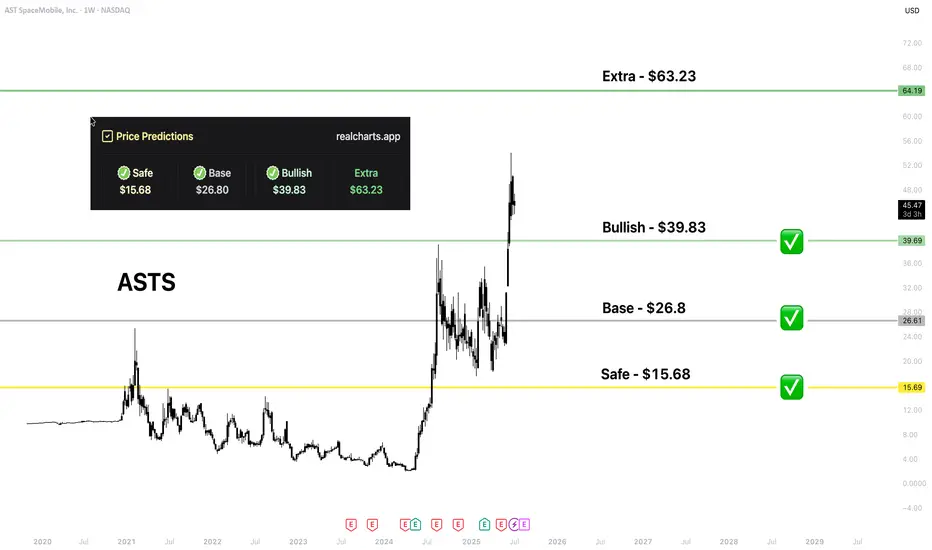
ASTS | Price PredictionNASDAQ:ASTS already hit 3 of 4 targets based on my platform. Massive upside, great asset!
Momentum Watch: GOOG Entry ZoneNASDAQ:GOOG – Trend Continuation Setup
The price has been trending within a clean ascending channel since April 2025.
After a pullback toward the midline and Bollinger basis, price is showing potential support.
Setup:
• Entry: $175 (conceptual)
• Stop: $165.5 (below channel)
• Target: $208 (upper boundary)
• Risk/Reward: 3.51
Stochastic is retracing but remains above key support zone.
As long as the channel holds, expecting continuation toward $200–208 by late September.
⚠️ Market remains under pressure following July 9th events, which could increase short-term volatility across tech.

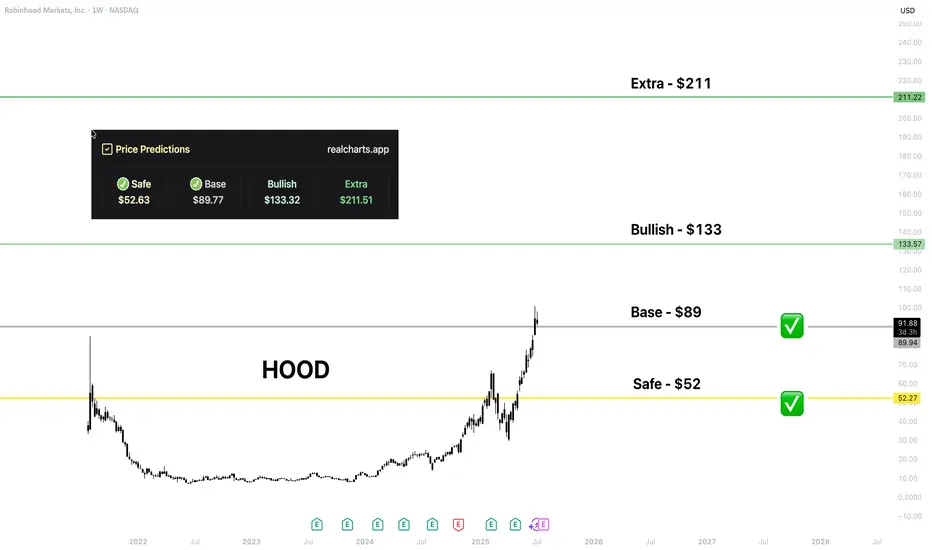
HOOD | Price PredictionI love that NASDAQ:HOOD has made a huge step in crypto integration.
That level is from my platform. I hope HOOD holders would be happy to get every level; time will show!
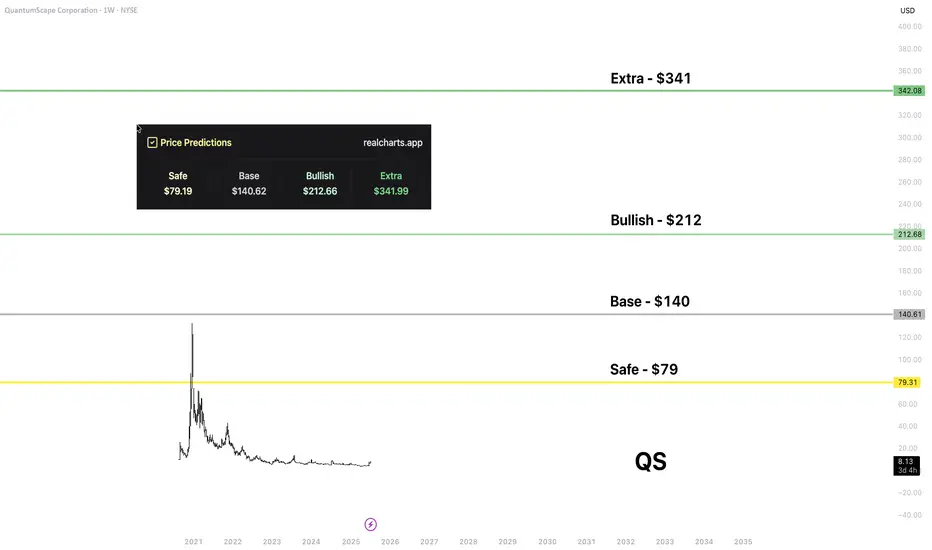
QS | Price PredictionNYSE:QS is one of the most promising assets in my stock portfolio. I expect massive upside and becoming revenue positive from 2026-27.
That level is from my platform. I think the "safe" is the most realistic in the first phase of the upside, and the "base" is quite realistic too. For the next levels, we should see really good sales and more partners.
Stocks SPOT ACCOUNT: LULU stocks my buy trade with take profitStocks SPOT ACCOUNT: NASDAQ:LULU stocks my buy trade with take profit.
Bought at 236 and take profit at 245.
This is my SPOT Accounts for Stocks Portfolio.
Trade shows my Buying and Take Profit Level.
Spot account doesn't need SL because its stocks buying account.

SPOT ACCOUNT: QUBT Stocks my buy trade with take profit SPOT ACCOUNT: NASDAQ:QUBT Stocks my buy trade with take profit
Trade shows my Buying and Take Profit Level, Spot account doesn't need SL as its stocks buying account.
I have set my TP level.
