Safe Entry Zone INTCPrice Movement Ranging.
Price Targeting 1h & 4h Green Zone.
Green Zones Are Buying Zones & Red Zones Are Selling Zones In Case Buying Zone broken down stock movement will be down and Vice Versa.
P.High(Previous High) & P.Low(Previous) Acts As significant Support and Resistance Levels.
Note: 1- Potentional of Strong Buying Zone:
We have two scenarios must happen at The Mentioned Zone:
Scenarios One: strong buying volume with reversal Candle.
Scenarios Two: Fake Break-Out of The Buying Zone.
Both indicate buyers stepping in strongly. NEVER Join in unless one showed up.
2- How to Buy Stock:
On 15M TF when Marubozu Candle show up which indicate strong buyers stepping-in.
Buy on 0.5 Fibo Level of the Marubozu Candle, because price will always and always re-test the imbalance.

CVX Trade Setup — Catch the Bounce + Dividend PlayChevron ( NYSE:CVX ) is setting up for a potential bounce from strong support around $134.96 (S2 level). The trade aligns with both technical and fundamental tailwinds:
🟢 Technical Setup:
Holding just above S2, showing signs of base formation.
Clear risk/reward box:
Entry: ~$135
Target: $150.05 → ~+10.5%
Stop: $133.73 → ~-2.4%
R:R Ratio: ~4.6:1
MACD histogram flipping positive.
RSI rebounded from oversold and consolidating.
💰 Dividend Catalyst:
Ex-div date: May 19
Yield: 5.04% (quarterly payout of $1.71/share)
Chevron has increased its dividend for 37 consecutive years — strong income + growth combo.
This is a solid swing + yield capture setup. I’m long from $135.64.
📈 Watching for confirmation over $137 before scaling.
Do you think CVX hits $150 before ex-div? Drop your chart 👇

AVGO is always an easy decision for me -- long at 246.86 In addition to being at the heart of AI and having margins north of 70%, AVGO has done incredibly well with my algo. 381-0 with an average return of 1.71% in an average of 7 days - a .244% per day return, about 4x the average daily market return. However, adding the new filter I've been using ups that number dramatically. In the last 2 years, in 39 trades, it's 39-0 with an average return of 2.24% and an average of 3.6 days held. That's .63% per day or almost 15x the daily average return of the market.
Only 6 of those 39 trades took more than one week to close and none took longer than a month. Only 10 of them made less than 1% and 7 made more than 4%. Combined with the fundamentals, the uptrend it's in, and the fact that it's sitting right on support makes the reward to risk ratio VERY high for me.
The exit strategy Is FPC if the return is large enough, but not necessarily a FPC.
As always - this is intended as "edutainment" and my perspective on what I am or would be doing, not a recommendation for you to buy or sell. Act accordingly and invest at your own risk. DYOR and only make investments that make good financial sense for you in your current situation.

AES | Bounce in Motion from Multi-Decade Support – 75% Upside 📍 Ticker: NYSE:AES (AES Corporation)
📆 Timeframe: 1M (Monthly)
📉 Price: $11.48
📊 Volume: 109.4M
📈 RSI: 40.20 (Oversold rebound zone)
🔍 Technical Setup:
NYSE:AES has just bounced from the lower boundary of a 30-year ascending parallel channel, a zone that has historically marked major long-term bottoms.
🟢 Green arrow: Rebound from long-term trendline support
📏 Targeting reversion to the channel median
🔹 Pattern context: Mean-reversion strategy inside macro uptrend
🧠 Trade Plan & Price Target:
✅ Entry Zone: $11.00–$11.50
❌ Stop-Loss: Close below $9.50 (channel structure breakdown)
🎯 Target: $20.00
→ 📈 Return: +75.6% from current levels
⚠️ Key Insights:
RSI near historical bounce zone (40)
Major volume surge may signal capitulation
AES is historically cyclical within this macro structure — mean reversion is likely
Short interest elevated — potential for short-covering rally
💬 Will AES power a multi-quarter reversal like it did in 2002, 2009, and 2020?
📈 Add it to your radar if you’re watching for long-cycle rebounds.
#AES #MeanReversion #LongTermChannel #Utilities #ValueTrade #TargetTraders

ABT Trade Setup: Breakout Play with 10.6% Upside🏥 Abbott Labs (ABT) Trade Alert
Positioning in this healthcare giant as it breaks out from consolidation - here's the strategic play:
📌 Trade Levels
▶ Entry: $133.12 (confirmed above SMA 50)
🎯 Target: $147.21 (+10.6%)
🛑 Stop Loss: $126.00 (-5.3% risk)
⚖️ Risk/Reward: 1:2
Why ABT Now?
✅ Fundamental Strength:
Net Income Growth: "Strong growth" (+134% YoY in last report)
Dividend Aristocrat: 50+ years of dividend growth (current yield 1.9%)
Debt Health: Score 10/10 (Debt/Equity 0.26, Interest Coverage 15x)
✅ Technical Triggers:
Bullish crossover (50D > 200D MA)
RSI 55 - neutral with room to run
Volume surge on $132 breakout
Measured move target aligns with $147 zone
📊 Trade Management:
Entry: $133.12 (market price)
Scale In: Add at $130 if tested
Adjust Stop: Move to breakeven at $136
Partial Profit: Take 50% at $140
⚠️ Key Risks:
Sector rotation out of healthcare
FDA delays on new devices
Strong resistance at $138 (prior highs)
ABT dominates 4 growth segments:
Medical Devices (44% revenue)
Diagnostics (32%)
Nutrition (12%)
Generics (12%)
Recent FDA approval for Freestyle Libre 3 drives upside.
Trade active until next earnings (Oct 18). Let me know your take! 👇
#HealthcareStocks #DividendInvesting #BreakoutTrade

PRMB | Breakdown in Progress – Setting Up for a 200% Swing Buy📍 Ticker: NYSE:PRMB (Primo Brands Corporation)
📆 Timeframe: 1W (Weekly)
📉 Price: $28.84
📊 Volume: 32.38M
📈 RSI: 40.95 (Bearish momentum, nearing bounce zone)
🔍 Technical Setup:
PRMB has broken below a steep sub-channel and is targeting the midline and base of a broader long-term ascending channel, offering a high-reward opportunity for medium-term traders.
📉 Short-term trend: Bearish correction
📈 Long-term trend: Still intact within rising channel
📍 Support zone: $20.70 – multi-year horizontal + lower channel convergence
📊 RSI: Oversold territory, potential for bullish divergence
🧠 Trade Plan & Price Targets:
📥 Wait for price to hit $20.70–21.00 zone (major confluence zone)
✅ Entry Range: $21.00–$22.00
❌ Stop-Loss: Below $19.00 (channel breakdown invalidation)
🎯 Target 1: $35.00
→ 📈 Return: +64.8%
🎯 Target 2: $72.00
→ 📈 Return: +229.3%
⚠️ Key Insights:
Volume spikes during selloff = panic selling, possible capitulation
RSI forming base near 40 → reversal often begins here historically
Macro trend channel still fully intact — just correcting within range
Steep reward potential if entry is timed at support
💬 Will PRMB complete the retest and deliver a massive swing?
🎯 Precision setups like this don't come often — add it to your watchlist now.
#PRMB #ChannelTrading #SwingSetup #LongTermReversal #HighReward #TechnicalSetup #TargetTraders

Is NVDA Building Strength Before a Breakout?After cooling off from its $150 highs, NVIDIA (NVDA) is consolidating in the $140–$145 zone. While some traders fear the AI hype has peaked, others see this as the calm before another rally. With solid fundamentals, continued leadership in AI, and strong institutional backing, NVDA remains a name to watch closely.
🎯 Trade Setup:
Entry Points
✅ $142 – Current price zone (speculative buy)
✅ $135–$130 – Strong support (ideal swing entry)
✅ $125 (only if market-wide pullback occurs)
Profit Targets
📈 TP1: $149 – All-time high retest
🚀 TP2: $160 – Extension target
💰 TP3: $175+ – Long-term bullish scenario if momentum returns
💡 Strategy: This is a “buy-the-dip, trade-the-breakout” setup. Wait for confirmation above $146 if you're conservative, or accumulate gradually into weakness with a clear risk plan.
📌 Disclaimer: This is not financial advice. Always do your own research and use proper risk management. I'm sharing my personal view for educational purposes.

OKLO Daily Cup and HandleStrong pattern formed off a key level that could breakout in August or September. Upper price target of 90 as long as the gap is filled but not too far under

Microsoft - This might be the ultimate breakout!Microsoft - NASDAQ:MSFT - will break the all time high:
(click chart above to see the in depth analysis👆🏻)
If you wonder why Microsoft has been rallying +15% this month, market structure will give you an answer. In fact, the recent bullish break and retest was totally expected, and if we take into account the recent quite strong bullish behaviour, an all time high breakout will follow soon.
Levels to watch: $450
Keep your long term vision!
Philip (BasicTrading)

CHWY eyes on $40.07: Golden Genesis may Double Top or RunCHWY trying to recover from a long downtrend.
Currently testing a major landmark of its lifetime.
Golden Genesis already topped once, trying again.

ARENA go longThe Arena Group act as an rebound..
After a big downturn, the company has turned around and is since 3 quarters profitable.
EPS last quarter 0,08. --> next quarter ~ 0,16 $
Revenue increasing. Company except 40 Mio $ revenue. (from 30 !!)
Incresing EPS and revenue, only 200 MIO MC.
--> Expect minimum target at 10$
Entry here between 4$ and 5$. SL at 3,5

What's going on with $OSCR? Let's break it down!🚨 What's going on with NYSE:OSCR ? Let's break it down! 👇
📌 Long-term investors: Every dip = buy/add opportunity
📌 Traders: Short term, we may fill the $13.31 GAP
🔹 Massive volume shelf & consolidation between $11-$17 for nearly 2 years—the bigger the base, the bigger the breakout!
🔹 Rising trendline since April lows—if this breaks, expect a move to $13.31 GAP, possibly $11-$12. Strong support here unless bad news or a market correction hits.
🔹 Break above $18.27 (earnings pop) = 🚀 $20+ short term
🔹 200DMA rejection after retest from below = bearish short term
🔹 WR% is making a lower low instead of swinging higher—watching this closely.
🧐 Overall: We’re in a consolidation phase—when it moves, expect it to be quick & explosive 🔥 Best strategy: DCA & wait for the inevitable surge to $20+ (barring major setbacks).
Stay patient. Stay focused. NYSE:OSCR ’s move is coming! 💪

Cup and handleA big move is coming if the formation breaks to the upside. I see 500-520$ as the target area.

I'm McShortMcDonalds has received a few downgrades recently and I think we see it retest $280, followed by $260.
Not financial advice, good luck to all

META: Close to a 1D Golden Cross. Strong buy.META is almost overbought on its 1D technical outlook (RSI = 69.797, MACD = 30.360, ADX = 40.237) but is about to form a 1D Golden Cross, the first such pattern since March 1st 2023, which was a little after the November 2022 market bottom. The market technically thrives on such conditions and since 2019, the 3 Golden Cross patterns that were formed were bullish continuation formations. Based on the 1W RSI, the current Golden Cross might be more similar with the June 2nd 2020 Golden Cross that was formed after the COVID crash. It rose by +123.42% before pulling back to the 1D MA200 again, so we remain bullish on META with TP = 1,000.
## If you like our free content follow our profile to get more daily ideas. ##
## Comments and likes are greatly appreciated. ##

TXG 10X Genomics Trend Cloud Study UpdateThis is my Study of 10x Genomics Bigger Picture.
The Down Trend on a + 2D view is Obviously Down.
So here Despite all the Professional Advisors Advice it is clearly not a Buy.
I Did get in small, but now losing.
I would not add, because apart from losing more, this also ties up your potential Capital to redeploy elsewhere.
However my Capital deployed is not that large, so I'm Holding for now.
One of my Reasons to Publish this Chart is to show how one can Diarise their Trading or Investing Journey.
Also if Trading View could have a simple Tiny Embedded Spreadsheet for ones P/L using Buy and Sells would be SUPER COOL.
Also the Call-Out Notes I use to Diarise my Trade Notes get a bit overcrowded as can be seen when one looks at the larger picture.
So if there could be a simple function to Kern or Shrink the notes to an Icon with a "N" as an example in >1D View (Selectable), but when you Hover Over it, it expands back to ones size for that point to view, and then minimises when you move away. To me this an obvious improvement that is easily implemented.
I'm currently trying Reddit WTF Trading View, but need to wait, why, I'm currently unsure for 3 months to gain traction.
Apparently Trading View watches this URL to gauge improvements, or sentiment, and does not take any direct mails for error's or improvements at this point in time. This is OK IMO.
Remember this -
PV=FV/(1+r)^t Present Value = Future Value / (1 + R Rate of Return ) ^ Time.
(So here Time is in Control, do not stay in a losing ONE)
I Trust - Should you appreciate my Chart Studies, Smash That Rocket Boost Button. It's Just a Click away.
Regards Graham.

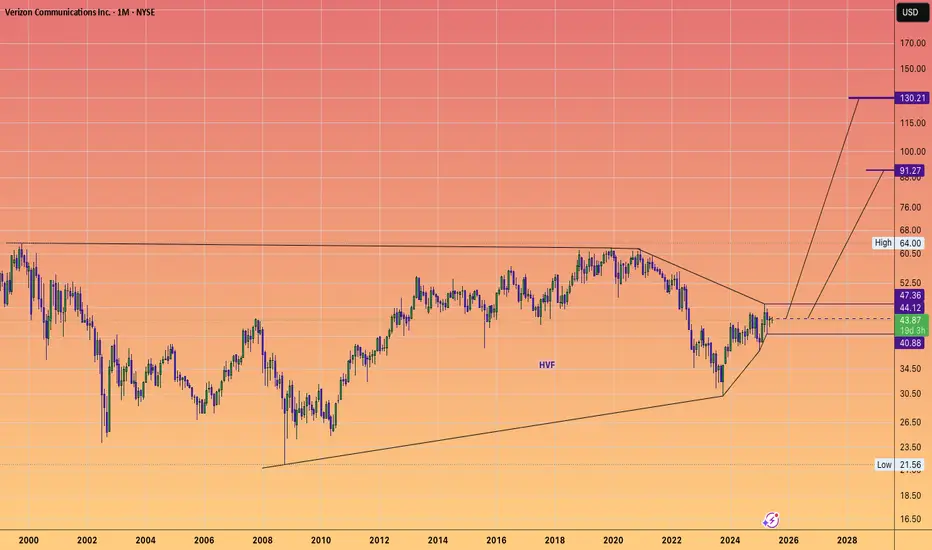
VERIZON will run up to $130It's not me
it's the chart that says it will
#HVF
#HuntVolatiltyFunnel
@FrancisHunt-TheMarketSnipe
@TheMarketSniper
@TheCryptoSniper
$Wolf showing positive bounceNYSE:WOLF
Wolfspeed has shown crazy sell off from bankruptcy rumors.
Aside from those fears, currently an opportunity is presented with assistance from MACD and historical moves.
%100-200 targets ( green channel resistance, blue measured move)

How To Buy A Short Squeeze Using This 3 Step SystemToday i felt lifted and happy.
But Yesterday i was very sad
because of a silly fight
with a drunk friend of mine.
Need i mention i was sober.
I had to self defense myself but i feel much
better after writing down my feelings.
Basically i had to run away from the
fight.There is nothing
wrong with running away.In fact running
away from a fight is the best self defense.
What a friend does to you hurts more
than an enemy.
Notice that in the movies the bully
looks like a friend in disguise.
Always around at the right time.
Anyway if you look at this chart you will
notice that the price is in an "overbought" zone
This is what Tim Sykes calls a short squeeze.
When the short sellers buy to cover.Or decide to take
a profit or loss depending on there position.
Now granted this chart is following the Rocket Booster
Strategy,Which has the following 3 Steps:
1-The price has to be above the 50 EMA
2-The price has t be above the 200 EMA
3-The price should gap up in an uptrend
Seeing this ticker NYSE:KO
is very interesting because it is a popular stock.
Rocket boost this content to learn more.
Disclaimer;Trading is risky please learn more about risk management
and profit taking strategies.Do not use margin and use
a simulation trading account first before you trade with real money.

OKLO can go locoPattern: Classic cup and handle formation. Handle forming as a bull flag — very bullish continuation setup.
Resistance: ~$57.78 — key neckline from prior highs. Needs strong close above this level for confirmation.
Volume: Declining during handle = textbook. Suggests controlled pullback. Watching for volume spike on breakout.
Moving Averages: Price is trading above all key MAs, confirming bullish trend structure.
🔥 Most Favorable Path:
Let price tighten within the handle, then breakout above $57.78 on increased volume. If confirmed, target $66–70+ based on measured move from cup base to neckline.
⚠️ Invalidation:
Break below $50 with volume would invalidate handle and signal potential deeper retracement.
✅ Summary:
Setup: Cup & Handle
Bias: Strongly bullish
Entry trigger: Break + close > $57.78
Targets: $66 → $70 zone
Risk level: Manage below $50
*Not a financial advice


TESLA - Multiyear ChartI'm optimistic about Tesla's long-term prospects, viewing it as a multi-year investment. I anticipate Tesla reaching new highs this year, followed by a 50% correction from the peak to retest the breakout level. With patience, holding for years could yield strong returns.

CVX – Waiting for Pullback to 0.382 Before Targeting Gap FillsChevron (CVX) recently broke structure to the upside after holding a 1D demand zone near $136.
I'm now watching for a pullback toward the 0.382 retracement (~$141.80) of the recent impulse. This level aligns with the breakout area and offers a potential continuation setup.
🎯 Trade Setup:
Bias: Long (on retracement)
Entry zone: $141.80 – $142.00
Targets:
📌 Gap 1 → ~$158
📌 Gap 2 → ~$166
Invalidation: Close below $138 would negate the bullish thesis.
🧠 Context:
Structure flipped bullish after BoS.
Gaps above remain unfilled, acting as magnet zones.
Pullback to 0.382 = logical spot to join trend continuation.
