WOW $4 to $74 Big 1,655% in just 2 daysGet ready for new power runners to emerge from this AMEX:BMNR move

Cup and Handle with a shot of espresso: A bullish blendSince March, Starbucks ( NASDAQ:SBUX ) has been in a sustained downtrend, gradually rounding out a base. Now, the chart is showing early signs of a trend reversal.
Yesterday, price broke out of a bull flag formation on the daily chart and is now testing the $95.50 zone — a critical neckline level of a cup and handle pattern.
✅ Bullish Scenario:
A clean break and hold above $95.50 would confirm the cup-and-handle breakout.
If confirmed, this setup could target a measured move that eventually retests all-time highs.
More conservative traders may want to wait for a back test of the $95.50 neckline as confirmation, especially given its past historical significance.
⚠️ Bearish Invalidation:
A break and hold below $95.50 would invalidate the cup-and-handle pattern, suggesting the breakout has failed.
📌 This is a purely technical idea. No fundamentals involved.
As always, Happy Hunting!
This is not financial advice. Always do your own due diligence

"MINORITY" Report.. Miners making a move.. Often = "delayed" BTCCheck 1Y big picture.
BTC miners making their moves, interesting to see how they compare to each other.
Those 4 a picked for a reason: top 4 performers.
Interesting to see:
IREN @ RIOT topped 70-100%
MARA & CLSK still got "room" to run..
NFA but quite possibly not late to catch a train..

Tesla - This bullish break and retest!Tesla - NASDAQ:TSLA - confirmed the bullish reversal:
(click chart above to see the in depth analysis👆🏻)
Tesla recently created a very bullish break and retest. Therefore together with the monthly bullish price action, the recent rally was totally expected. But despite the short term volatility, Tesla remains bullish, is heading higher and will soon create new highs.
Levels to watch: $400
Keep your long term vision!
Philip (BasicTrading)

TESLA Lagging BehindA compelling reason to buy Tesla stock now—despite it being beaten down—is the asymmetric risk-reward setup driven by its depressed valuation relative to long-term growth potential. Sentiment is currently low due to concerns about EV demand, competition, and Elon’s distractions, but this pessimism is largely priced in. Meanwhile, Tesla still holds massive optionality: AI-driven autonomy, energy storage, and Dojo supercomputing. If even one of these verticals scales meaningfully, current prices may prove a generational entry.
At the moment, we are hitting some of my key support levels being the anchored vwap from the low , as well as the previous Value Area High range retest within the formation of this broader triangle, suggesting a potential continuation to the upside should we get a strong breakout.
I will be watching for further down side as the current risk is only approx 6-7% for a potential upside of 60%-70% , a massive Risk to reward.
Should this reclaim the downtrend vwap, it can be a strong sign of strength for this stock to move back to ATH's as tesla is massively lagging behind.

MSTR Long - high squeeze potentialMSTR recently made 20-day highs (green candles) and then sold off towards the 20D EMA trendline. Meanwhile, looking at a proxy of net buying/selling (bottom panel), there has been neither significant buying nor selling activity.
All of this is setting up the potential for a squeeze higher.
Needless to say, please manage your risks carefully and consider setting a stop-loss upon MSTR closing at a 20-day low (red candle).
Both indicators (Breakout Trend and Buying/Selling Proxy) are available for free on TradingView.

Buying NKE now offers a margin of safetyBuying now does not mean the price will not drop further. The thing about catching bottom remains an illusion for many, a brag for some during the lunchtime talk.
I have nibbled some yesterday and will buy more if it drops further.
As usual, please DYODD

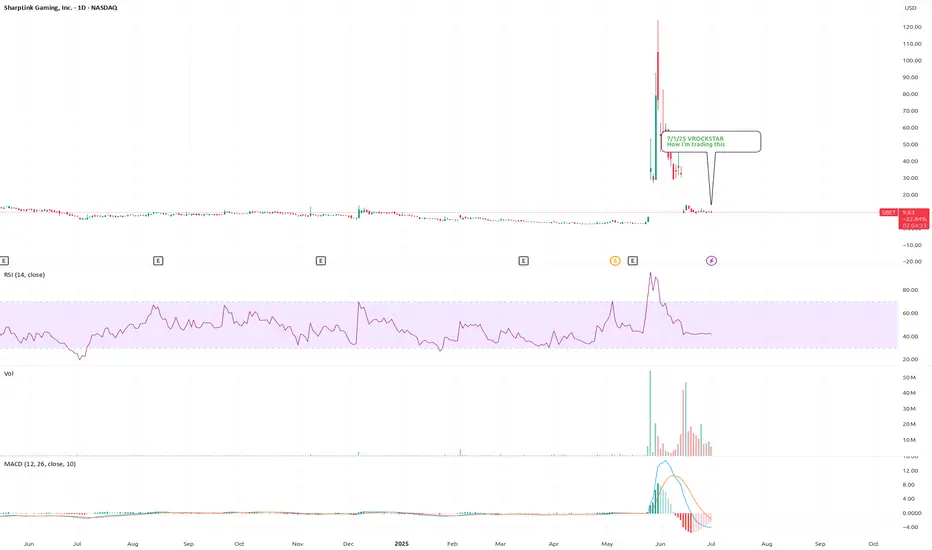
7/1/25 - $sbet - How I'm trading this7/1/25 :: VROCKSTAR :: NASDAQ:SBET
How I'm trading this
- tl;dr, this is the first *larger* eth "treasury" attempts
- while the world is focused on AMEX:BMNR today at 10x NAV, this sits quietly at 1.5x nav
- there are two ways shareholders who would buy, say, at today's price would make an "eth yield"
- 1/ co raises debt, converts, prefs etc. any flavor and uses this to buy ETH and ETH appreciates in excess of this yield. my sense is this is more difficult "today" given the institutional view of BTC remains *hard enough* (even tho, really, it's not). but with stable coins becoming more in focus, this gives important life to eth narrative in coming cycle (more on this below)
- 2/ the mNAV is allowed to expand. if i raise at say 1.5x MNAV and then the stock appreciates toward say 3x MNAV and i raise there again to buy eth... the original holders essentially got a pro-rata distribution in excess of their initial stake. where the logic, here, fails... is that if this is your *only* way to raise $... eventually you collapse back to mnav, essentially... the inverse is also true. if you buy at 3x mnav and stock goes to 2x mnav, uh oh. it requires ever-increasing mnav. we know from BTC treasuries this might be up to 5x (mstr) and up to 10x (metaplanet) and really just depends on your story, size, mgmt, ability to raise outside of just equity etc. etc.
- now with this all being said... we look at something like AMEX:BMNR today and there are two main outcomes
- 1/ 10x mnav is too high and likely they're advantaged to raise here and dilute current shareholders to buy ETH and in essence it's tough to imagine much more mnav acceleration (but we *are* in that whacky tape and people are just trading price -- i know this from some comment i read today). fair. if this is the case, flows to NASDAQ:SBET should be very positive
- 2/ mnav from AMEX:BMNR start to collapse toward say 5x and this affects sentiment for other "eth treasury" co's, namely NASDAQ:SBET and this thing goes to 1.2x mnav vs. say 1.5x today... no bueno
-3/ there are others (two others), but above is 80% I think of pie
so why eth? aren't you a BTC only guy V?
- mm yeah BTC is the only commodity
- but i also trade stocks, tech etc. and that's just want these other things are Eth, Sol etc.
- with NASDAQ:HOOD launching their L2 on LSE:ARB the other day, tokenizing stocks, with the realization that banks will want to float and distribute their own stables across crypto rails sooner vs. later (and legislation that's allowing for it... more stables = stronger dollar and USD dominance globally)... CRYPTOCAP:ETH will earn the lionshare of the upside here.
- of course flows will eventually find their way into $sol... CRYPTOCAP:SUI , NYSE:SEI , etc. etc. but for now CRYPTOCAP:ETH is probably the lowest-risk way to play this
- I'm not ruling out that our garden variety pullback sends BTC back to $90k and you know what happens when BTC sneezes... everyone else catches a flu. So that could really hamper CRYPTOCAP:ETH action short term.
- But I like the idea of playing not only CRYPTOCAP:ETH at a *reasonable* valuation here (you do pay 50% more! keep that in mind), but there seems to be a willingness to overpay (as AMEX:BMNR shows). so i'm content to neck out here to capture a 50-100% move. but small enough to either size up, look elsewhere and/or close with a loss without any flesh wounds.
tl;dr... if u like $bmnr... u should like NASDAQ:SBET more.
V
GOOGL Option Flow Suggests Opportunity Ahead 🧠 GEX Sentiment Breakdown (Options Insights):
From the GEX data:
* GEX is green with 3 bullish signals ✅
* Call flow dominance at 21.3%, showing stronger bullish participation
* IVR: 37.1 — implying slightly elevated premium conditions, which benefits directional plays
* Key Levels:
* $180 → Major Call Wall (profit-taking & resistance)
* $177.5 → 3rd Call Wall (possible stall zone)
* $175 → 2nd Call Wall, currently being tested
* $172.5 → HVL + GEX Support, critical for bulls to defend
* $170 → Next GEX flip zone
💡 Trade Bias from GEX:
→ BUY CALLS if price reclaims and holds above $175 with momentum
→ Avoid CALLS if it rejects $175 and drops under $172.5 — at that point, PUTs become viable
📉 1H Price Action (Intraday Game Plan):
Based on the second chart:
* GOOGL is consolidating just below a recent CHoCH zone (change of character), forming a tight range under a bearish breaker block at $176–$178
* Trendline from June breakout was broken and is now acting as dynamic resistance
* If $175.80–176.20 gets rejected again, we may see a move down to test $172.50 or deeper into demand zone near $170–$168
📊 Intraday Setup Ideas:
🔼 Bullish Setup (CALLS):
* Entry: Above $176.20 with strong volume
* Target: $178 → $180 (Gamma Wall & resistance)
* Stop: Below $174.80
* Best if IV stays stable and GEX remains bullish
🔽 Bearish Setup (PUTS):
* Entry: Rejection at $176 → enter short or PUTs below $174.50
* Target: $172.35 → $170
* Stop: Above $176.50
* Confirmation if GEX flips or if IV spikes and GEX green dots disappear
🎯 My Thoughts:
This is a tricky zone. GOOGL is sandwiched between resistance at $176 and support at $172.5. GEX flow supports buying CALLs on strength, but price needs to break above $176 to make that valid. Watch for any gap open or strong push with volume for confirmation. If the market stays weak, don’t chase CALLs blindly — the safer play is fading into $170.
Disclaimer:
This breakdown is for educational use only — not financial advice. Trade at your own risk, manage position sizing, and stay disciplined.

$SOUN Breakout Setup – Clean Bullish Structure with Strong R/RSoundHound AI ( NASDAQ:SOUN ) is showing a strong technical setup as it pushes above the Ichimoku cloud on the daily chart. Price has been consolidating for over a month in a tight range between $9 and $10.30. Today’s breakout above the cloud with bullish MACD crossover signals potential trend continuation.
Key technicals:
Ichimoku Cloud: Price has closed above the Kumo with Tenkan-sen crossing above Kijun-sen—classic bullish signal.
MACD: Fresh bullish crossover with histogram flipping positive for the first time since mid-May.
Volume: Volume has been increasing on up days, suggesting accumulation.
Trade setup:
Entry: $10.30 (breakout candle)
Stop: $9.05 (below recent consolidation base and cloud)
Target: $13.41 (prior high and R1 pivot level)
Risk/Reward: 2.41
If price holds above $10 and consolidates, it could offer a low-risk add or re-entry zone. Momentum traders may wait for confirmation above $10.55 with volume before committing.
This setup offers both breakout potential and clean invalidation, making it attractive for swing traders and breakout traders alike.

Time to buy? Too much negative press. Buy in Fear- Updated 25/6Apple has recently faced significant negative press, leading to fear and critical perceptions among investors. This situation highlights a common investment principle: buy in times of fear and sell in times of greed. As a result, I have taken a considerable long position on Apple, which I have since increased since my orginal post.
The flag pattern on the stock chart is nearly complete, indicating that a price movement is imminent. I have set my stop loss at $191, while I anticipate that a positive breakout could push the stock price above $223, representing potential gains of over 10%. There is also further upside potential for the price to exceed >$230. My target sell price for a full exit from Apple is now 275 USD, which would yield a return of 35%, although I do not expect this target to be reached until September or later. For shorter-term returns, I am targeting prices above $223.
I believe Apple is a strong long-term hold, regardless of current market fluctuations. The company has a mature and extensive ecosystem, making it a brand I would be reluctant to bet against. If you already own Apple products, you likely understand how unlikely it is that you would switch to another brand.
A close above $201.12 today would confirm a positive breakout.

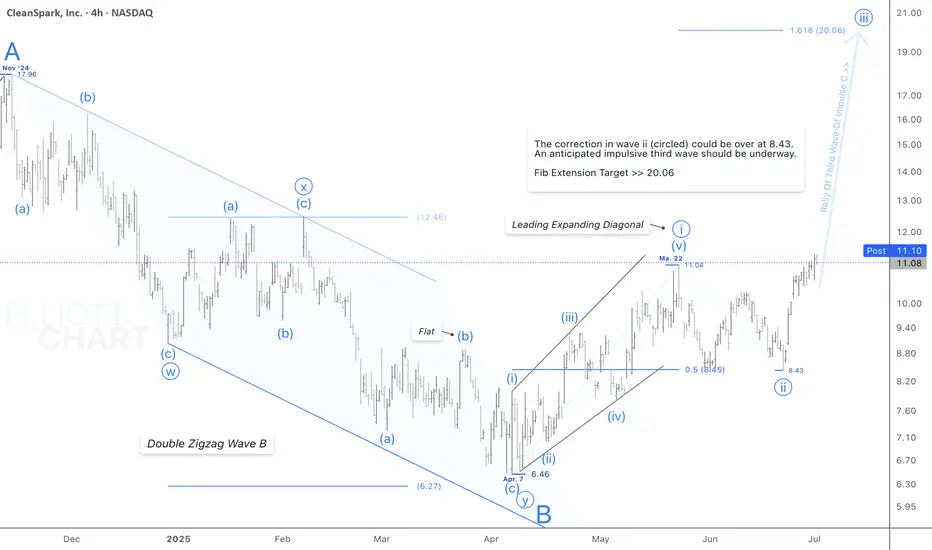
CLSK / 4hNASDAQ:CLSK has extended an impulse since last week, that's gone beyond the May high >> 11.04. That may be just an initial advance of the anticipated impulsive wave iii(circled).
So, the correction in Minute degree wave ii(circled) could be thoroughly over at 8.43. And an impulsive & same degree wave iii(circled) should have begun its way up.
Trend Analysis >> The trend has turned upward in an impulsive third wave towards the anticipated target.
The first Fib extension target >> 20.06
#CryptoStocks #CLSK #BTCMining #Bitcoin #BTC
[PEP] Pepsi investmentI took my first and main position on NASDAQ:PEP just before this little spike.
My target is very high because I want to hold this stock for a while and maybe I will hold even more than what you see on the graph.
Strong confidence for the long run ...
Great Trade !

HUGE +979% day $4 to $46 on 100M shares traded $BMNR🚀 HUGE +979% day $4 to $46 BMNR on 100M shares traded 🤯
Shortsellers were trying all kinds of manipulations during the day but at the end got squeezed after hours
#stockmarket #stocktrading #trader #daytrading #chart #10X

Crypto Stocks to the moon?NASDAQ:MSTR , along with numerous other publicly traded companies with significant cryptocurrency exposure, experienced a remarkable rally during the previous crypto bull market. There are indications that a similar dynamic could be emerging once again.
#bitcoin #crypto #stocks #stockmarket #portfolio

Natural Gas - Silver Lining!Natural gas is ending the day with a daily bottoming tail.
Potentially forming an inverse head and shoulder pattern that takes us above the key $3.83 level.
We took profits on our EQT put hedge! The put contract went up over 100%
Lets see if Nat gas can build some pressure.

Nvidia - New all time highs!Nvidia - NASDAQ:NVDA - breaks out now:
(click chart above to see the in depth analysis👆🏻)
Within two and a half months, Nvidia rallied more than +70%. Following this recent bullish strength, a retest of the previous highs was totally expected. But this does not seem to be the end at all. There is a much higher chance that we will see new all time highs soon.
Levels to watch: $150
Keep your long term vision🙏🙏
Philip (BasicTrading)

Alibaba on the lower upward trend lineAlibaba is on the upward trend line after years of a downward trend. The AI business is booming. The fundamentals speak for themselves. The price/earnings ratio for 2025 is around 12 and is on Value level. The conflict with the Chinese party seems to have improved. The company is buying back shares. I have therefore increased my long position today

Attempting a breakout The price is attempting a breakout of the blue resistance.
Daily 200-period SMA is also located at $25.10.
It’s important to watch today’s closing price, if the breakout is confirmed, the next target will be the light blue resistance at $26.60

AMD got higher potential in SEMIsGrowing company, smaller percentage is comparatively easier to gain in terms of market share in the SEMIs
A key TA for me was that the downtrend channel from $172 to $76 was broken after a very a improving earnings report.

MRKEntry Zone: $81.50 to $80.00 (Potential accumulation area for buyers).
Key levels within this zone: $81.51, $81.53, $80.57.
Immediate Resistance: $83.07 (today’s high).
Higher Targets:
$92.63 - $93.26 (First target zone).
$97.36 - $98.25 (Second target zone).
$100.55 - $101.73 (Major resistance zone).
Stop loss 72.00

Mega bull trend starts now, CLSKIn short:
1) Goldencross soon to be triggered.
2) too see how the stock could perform (with accumulated, low 200dma), we can look in 2023. It peaked in mid July. After explosive rally in november.
3) 13$ levels is the 50% fibonacci..
4) 1st Elliot wave - people are skeptical. 2nd - woohoo. 3rd wave - fomo.
//Advancing in relative strength (CLSK/SPX).
//Small cap ( AMEX:IWM ) outperformance due to rate cut cycle (starts in September). Evidence is yesterday broadening rally.
//52WH is at november 18$. Expect a gamma squeeze?
position based on probabilities. I never make targets (future is unknown).
🥂
CLSKThe stock shows upside potential (~40% to Target2) with strong support at $10-$11, but low volume and near-term volatility require caution. Optimal strategy: Enter near support levels, enforce strict stop loss, and track confirmation signals for bullish momentum.
Entry Zone: $10 - $11 (optimal buying area).
Stop Loss: $8.40 (critical level, mentioned twice).
Targets:
Target1: $14.09 - $14.31 (~17-19% upside from entry).
Target2: $15.34 - $16.19 (~40-45% upside from entry)
