Is Decentralization the Future of Cell Therapy?Orgenesis Inc. (OTCQX: ORGS) champions a revolutionary approach to cell and gene therapy (CGT) manufacturing. The company focuses on decentralizing production, moving away from traditional, centralized facilities. This strategy, centered on their POCare Platform, aims to drastically improve accessibility and affordability of life-saving advanced therapies. Their platform integrates proprietary therapies, advanced processing technology, and a network of clinical partners. By enabling onsite therapy production at the point of care, Orgenesis directly addresses critical industry hurdles like high costs and complex logistics, which currently limit patient access.
Orgenesis's innovative model is already yielding promising results. Their lead CAR-T therapy candidate, ORG-101, targeting B-cell Acute Lymphoblastic Leukemia (ALL), showed compelling real-world data. A study demonstrated an 82% complete response rate in adults and an impressive 93% in pediatric patients. Crucially, ORG-101 also exhibited a low incidence of severe Cytokine Release Syndrome, a common safety concern with CAR-T therapies. These positive clinical outcomes, coupled with a cost-effective, decentralized production method, position ORG-101 as a potentially transformative treatment option.
The broader pharmaceutical industry stands at a pivotal juncture, with cell and gene therapies driving unprecedented innovation. The global CAR T-cell therapy market alone anticipates substantial growth, projected to reach \$128.8 billion by 2035. This expansion is fueled by increasing chronic disease prevalence, significant investment, and advancements in gene-editing technologies. However, the industry grapples with high treatment costs, manufacturing complexities, and logistical challenges. Orgenesis's decentralized GMP-validated platform, along with their recent acquisition of Neurocords LLC assets for spinal cord injury therapies and the MIDA Technology for AI-based stem cell generation, directly confronts these barriers. Their approach promises to accelerate development, enhance production efficiency, and reduce costs, potentially democratizing access to advanced medicine.

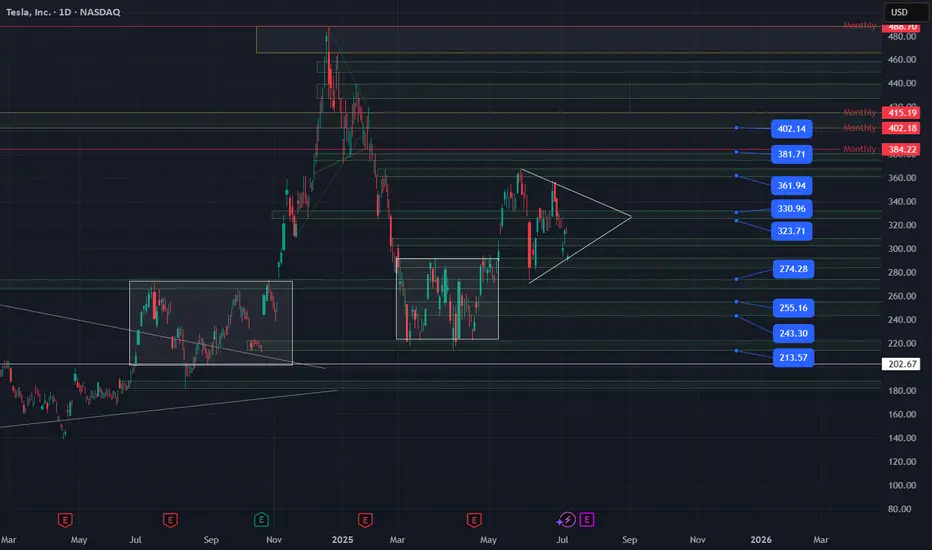
Long TSLA with a quick stop if we break back below 290.I have followed NASDAQ:TSLA for a while now and this 290 level has been huge. We have tried to test it a couple of times and failed, and you can see how price was stuck in a range below that level for almost 4 months earlier this year. The one thing that worries me is that there are a lot of people on social media calling for a pop here because of the drop we just saw and a lot of people are watching that 290 level. I think the market might punish the majority and dump this but the R:R is too great to ignore a trade here.
I would stop out of this if price closes back below 290 (on the 1H or D timeframe depending on your risk). If we don't stop out I would target 300, 310, 325. Break/hold above 333/5 and I would press longs for 360, 400.
If price does break/hold below 290 I would be short to target 280, 275. 275 should be another big support level as you can see the other white box/range on the chart has a top there. A look below and fail of 275 would be another good long entry and that would be the level I would watch if they decide to punish the 290 crowd.
I will post again if we see 275 otherwise look for upside with a quick stop as detailed above.
OSCR: A bored phase accumulation before next up viewOSCR: A bored phase accumulation before next up view.
Consolidating in a tight range to absorb remaining supply before resuming the uptrend.
.
US STOCKS- WALL STREET DREAM- LET'S THE MARKET SPEAK!

$OKLO Bullish SetupNYSE:OKLO is setting up a textbook cup and handle breakout on the daily chart, signaling a potential continuation of its impressive uptrend. The cup formed over several months with a rounded bottom, showing healthy accumulation behavior and strong trend structure. Following that, the handle is shaping into a clean bull flag — marked by a tightening price range with declining volume, which is typical before a breakout. The breakout trigger is a daily close above the $56–57 range, which would confirm the pattern and likely lead to strong momentum upside.
Using measured move logic and Fibonacci extensions from the cup’s depth and the flag’s structure, I’ve mapped out four staged price targets: $74.50, $108.00, and $184.25. These represent a potential upside of 31%, 91%, and 233% respectively if the pattern plays out fully. RSI is curling up around 54, which hints at building momentum — a breakout above 60 would further confirm strength. The Lum3n Trend Cloud remains bullish, the 8/21 EMAs are intact, and the 200-day moving average is far below current price levels, supporting the long-term bullish bias.
If NYSE:OKLO can break out of this handle with conviction and strong volume, the setup offers one of the cleanest technical continuation patterns on the chart right now. Watch closely for a breakout and hold above the $56 neckline — confirmation here could kick off the next powerful leg higher.

UNH How Far Down Are We Going $32 ? Based on the current class action lawsuit sentiment is negative and if it continues we can see levels of 258 being hit again. However if we break that level down then 163-150 level can possibly get hit followed by the 32-49 dollar range.
However despite all the negative news which does affect the market, if for whatever reasons we can break the high of 326 be prepared for a run up to 535 low probability but it is possible.
Trade Smarter Live Better
Kris/ Mindbloome Exchange

TSLA · Potential Double-Top Breakdown Idea Toward $255 → $225Rounded / double-top: Two rounded peaks formed at ≈ $335-340 with a clean neckline at $295-297 (yellow arcs on my chart).
Break confirmed: Friday’s candle closed below the neckline on above-average volume, triggering the pattern.
Measured-move math: Height of the top (≈ $40) projected beneath the neckline points to $255 for a full 100 % target.
Volume-profile “void”: VPVR shows a sharp volume vacuum between $260 and $230; once below $260, price often “slides” quickly to the next demand shelf around $225-230 — my purple “1st-target” box.

CRM · 4-Hour — Ascending-Triangle Breakout Idea Toward $288→$292Ascending triangle: Since mid-June price has carved higher-lows beneath a flat supply shelf at $276-278.
Coiled energy: Volatility keeps compressing; each dip is met with faster buying—classic “pressure-cooker” price action.
Measured–move math: Pattern height ≈ $18 ($258 → $276). Add that to the breakout level ($276) and you land at $294—smack in the middle of my $288-292 target box.
Volume-profile “air pocket”: The VPVR thins sharply between $280 and $295, hinting at limited stored supply until sellers regroup near the April reaction high (~$291).

AMAZON STRONG UPTREND|LONG|
✅AMAZON is going up
Now and the stock made a bullish
Breakout of the key horizontal
Level of 220$ and the breakout
Is confirmed so we are bullish
Biased and we will be expecting
A further bullish move up
LONG🚀
✅Like and subscribe to never miss a new idea!✅
Disclosure: I am part of Trade Nation's Influencer program and receive a monthly fee for using their TradingView charts in my analysis.

WFC · Daily — Rising-Channel Breakout Idea Toward $89-90Why This Setup Caught My Eye
Multi-year rising channel: Since late 2022 price has respected a neat parallel channel; we’re now testing the upper rail.
Fresh bull-flag breakout: The June pullback carved a tight triangular flag. Last week’s high-volume close above $83 confirmed the breakout.
Measured-move logic: Flagpole ≈ $15 (from the March swing-low $68 → May swing-high $83). Projecting that height from the June pivot ($74) lands at $89-90 — perfectly matching the 100 % Fibonacci extension on my chart.
Volume-profile tailwind: A low-volume node spans $86-91, suggesting limited overhead supply until the top of the target box.

TESLA Reached The Support! Buy!
Hello,Traders!
TESLA gaped down on
Monday but the move was
Held up by a massive support
Area ending around 272$ and
As the support is strong we
Will be expecting a rebound and
A move up from the level
Buy!
Comment and subscribe to help us grow!
Check out other forecasts below too!
Disclosure: I am part of Trade Nation's Influencer program and receive a monthly fee for using their TradingView charts in my analysis.

UBER · Daily — “Channel-Break” Idea Toward $110 → $125Why I Like the Setup
Secular Up-Channel: Since mid-2023 price has respected a textbook rising channel (~$30 tall).
Fresh Breakout Attempt: UBER is now pressing the upper rail near $100. A daily close above it would signal a new expansion phase.
Measured-Move Math: Projecting the channel’s height from the breakout pivot (~$80) gives Target-1 ≈ $110-113; the 127 % fib expansion points to Target-2 ≈ $124-128.
Volume Profile Tailwind: The histogram thins sharply once price is north of $100, meaning little “stored” supply until $112; a larger node re-appears near $120, my second profit zone.

SOFI 4-Hour — “Measured-Move” Breakout Toward $20.8 → $22Structure: Price broke out of a year-long falling-wedge and then punched through an ascending trend-line confluence at ≈ $17.00–$17.50.
Impulse Leg (Yellow): The vertical rally that followed is ≈ $3.75 tall. Projecting that height from the breakout pivot ($17.00) gives 100 % extension = $20.78.
Target Zone (Violet Box): $20.8 – $22.0 aligns with
100 % measured-move projection
Prior all-time swing high (~$20.5, Jan-2024)
A thin volume-profile “air pocket” between $19 and $22 (little resistance until the upper edge).
Next Level Up: 127.2 % fib extension sits at $24.15—that becomes the stretch target only if $22 is cleared decisively.

Toast with ButterToast posted an earnings gap up on May 9. Rallying to new highs, shares pulled back to form a flat base. Funds have been adding the stock to their holdings over the past seven quarters, according to MarketSurge data.

NVIDIA (NVDA)-Trade PlanNVDA, After an explosive run powered by GenAI infrastructure and bullish earnings, the chart is setting up for either a bullish continuation or a healthy pullback.
With volatility tightening and volume compressing, this is a great moment to prepare for either breakout or breakdown scenarios.
🎯 Trade Plan – Tiered Long Setup
📌 Entry Zones (Tiered Buying):
🔹 $150
🔸 $140
🔻 $120
📈 Profit Targets:
TP1: $160
TP2: $175
TP3: $200+ – Long-term continuation play if AI macro momentum persists
📌 DISCLAIMER: This idea is for educational purposes only. Always use proper risk management and assess your own strategy

TSLA: Triangle PatternResearching the market through structural lens, particularly the topology of trapped liquidity buildup and compression of volatility, that leads to a proportionally heavier move once a breakout occurs.
Raw compression area derived from waves of higher degrees (2nd, 3rd)
The longer price consolidates within boundaries of a triangular formation, the more significant the breakout tends to be.

AXP Breakout Trade – Triangle Pattern Alert!🚨 🚨
American Express (AXP) has bounced perfectly off trendline support and is now breaking out of a descending triangle. Price action shows buyer strength stepping in near $320.22 with a clean breakout retest at $322.63.
📌 Trade Details:
🔹 Entry: $322.63 (breakout candle)
🔹 Stop Loss: $320.22 (below support)
🔹 Target: $332.22 (previous resistance zone)
🔹 Chart Pattern: Symmetrical Triangle Breakout
Breakout backed by bullish structure and strong recovery from higher lows. Watching for follow-through with increased volume.
💡 Risk smart — follow your plan!
—
📊 Shared by: ProfittoPath
#AXP #AmericanExpress #TriangleBreakout #SwingTrade #TechnicalAnalysis #TradingView #ProfittoPath #StockSetup #BreakoutStock

LMND Long Trade Setup – Breakout Alert!🚨 🚨
Lemonade Inc. (LMND) has just broken above a key descending trendline on the 30-minute chart — signaling potential bullish momentum ahead. After days of consolidation, buyers stepped in right at the lower support zone, confirming a strong base.
📌 Trade Details:
🔹 Entry: $42.99 (above resistance)
🔹 Stop Loss: $42.06 (below recent support)
🔹 Target: $44.38 (previous supply zone)
🔹 Risk/Reward: Solid R:R setup with breakout confirmation ✅
This setup aligns with a clean technical breakout — I’ll be watching for volume surge and price to hold above $43.
💡 Always manage risk and follow your trading plan!
—
📊 Shared by: ProfittoPath
#LMND #BreakoutTrade #StockSetup #TechnicalAnalysis #TradingView #ProfittoPath #SwingTrade #BullishSetup #StockMarket

$AAPL Long Setup – Range Breakout Potential with Tight RiskApple ( NASDAQ:AAPL ) is finally showing signs of strength after a prolonged sideways range. Price is attempting to break above the Ichimoku Cloud on the daily chart while MACD is starting to curve upward—indicating a potential shift in momentum. After holding the $190–$200 zone as support for months, this move above $200 could trigger a short-term breakout toward the $220–$226 levels.
The current setup has a clean structure with a 4.27 risk/reward ratio:
Entry: $200.30
Stop: $195.07 (below recent range lows)
Target: $222.61 (prior high + pivot cluster)
If this move holds, it could mark the start of a trend reversal in Apple following months of chop. Solid setup for a 2–4 week swing trade or as part of a core position rebuild.
Let me know if you're playing this one or waiting for confirmation above $208.

BLDR UPDATEAfter breaking through resistance, its taking a bit of a break. However, finally got the the 20DMA to break above the 50DMA and also starting to form a mini bull flag on the daily. For now, the WVAP will be watched for support at $124 as it bounced nicely off that today. Any break below the WVAP and/or falling wedge line would invalidate the setup. Would love to see the next leg up test previous S/R flip area around 135/137.

NVDA at a Make-or-Break Zone – Trade Setups Ahead 🔍 Options GEX Insights (Gamma Exposure):
* GEX Map Observation:
* NVDA is currently trading near 158, slightly under the major Gamma Wall at 160.98.
* This level marks the highest positive net GEX – strong resistance due to heavy call positioning.
* Above that, additional call walls stack at 162.5 → 165 → 167.5, creating a squeeze zone if price breaks out.
* Below, support levels sit at 155 (2nd PUT wall) and 152.5 (3rd PUT wall).
* Volatility & Options Sentiment:
* IVR: 8.8, IVx: 40.8 – low implied volatility rank = cheap options.
* Put Positioning: Only 1.4% = call-heavy environment, skewed bullish.
* Positive GEX (+) across expiries shows dealers will hedge upward if we move beyond 161.
🟢 Bullish Scenario (Breakout/Squeeze Setup):
* Break over 160.98 could ignite a gamma squeeze toward 165–167.5 range.
* Ideal for low delta CALL verticals or debit spreads targeting the 165 zone.
* Weekly options are cheap due to low IV.
🔴 Bearish Rejection Scenario:
* If price stays pinned under 160 and loses 155, dealers start to de-hedge – momentum toward 152/150.
* Consider put spreads or a cautious fade if it breaks structure.
📌 GEX Summary Suggestion:
If NVDA stays under 160, price may remain pinned or retrace. But above 161 opens the gamma doors to 165+. Cheap IV = opportunity.
📊 1-Hour Price Action Technicals:
* Market Structure:
* Previous BOS toward the upside has stalled inside a consolidation box under 160.
* Multiple CHoCH zones form below current price, hinting at exhaustion.
* Price is stuck within a wedge, coiling beneath resistance = compression phase.
* Support & Resistance Zones:
* Resistance: 159.34 → 160.98 (Gamma Wall and price supply).
* Support: 155.34, then 151.10.
* Bullish OB remains untested around 151 area if price flushes.
* Volume & Trend:
* Volume declining during chop = balance phase.
* RSI & MACD show slight bearish divergence, favoring caution near top of range.
⚙️ Trade Thoughts:
* Scalp Setup:
* Above 160.98 = scalp long toward 162.5/165, tight stop at 159.3.
* Below 155 = scalp short toward 152 zone.
* Swing Setup:
* Long only on strong breakout close above 161 with volume.
* Short swing possible under 155 if CHoCH confirms trend flip.
Conclusion:
NVDA sits at the pivot point of either breaking out toward 165+ or rejecting and retracing toward 152. GEX and price both hint at a coiled move ahead. Stay nimble, follow the volume.
Disclaimer: This analysis is for educational purposes only and does not constitute financial advice. Trade at your own risk.

AMZN Coiled at Key Gamma Level! Trade Setup Inside📊 GEX (Options Sentiment) Analysis – AMZN
* Current Price: $223.20
* Gamma Wall (Call Resistance): $225 – Highest Net GEX, significant resistance zone.
* CALL Walls: Stack from $225 → $230 → $232.5 → $235
→ Suggests upside resistance builds fast; option sellers may try to cap the rally here.
* PUT Wall Support: Cluster at $215 → $212.5 → $210
* GEX Sentiment:
* GEX: ✅ (Green)
* IVR: 32.2 | IVx Avg: 35.6
* CALLs Positioning: Low (5.9%), moderate skew
* Interpretation:
Price pinned near $225 likely due to gamma forces. Any close above could trigger a quick gamma chase toward $230–232+. But failure = fast fade back to $215 support.
📌 Options Strategy Suggestion:
* Bullish Setup: Wait for break/close > $225. Consider vertical debit spreads (e.g., 225c/230c) for limited risk.
* Bearish Rejection: If AMZN gets stuffed at $225 again, short-term PUT spreads toward $215 are viable (e.g., 222p/215p).
🕐 1-Hour Price Action + SMC Intraday Trade Plan
* Structure:
* BOS → CHoCH → Sideways in tight range between $223–224.50
* AMZN is consolidating inside a tight breaker block zone under $225.
* Uptrend channel still valid with higher lows holding.
* Support: $221.88 → $218.75
* Resistance: $224.66 → $227.12
* Bias: Neutral to mildly bullish unless $221 fails.
🔍 Intraday Trade Scenarios
1. Breakout Play (Bullish):
* Trigger: 1H candle closes above $224.66 with volume
* Entry: $225.10
* Target: $227.10 → $230
* Stop: $222.80
2. Fade Play (Bearish):
* Trigger: Break below $221.88 with CHoCH
* Entry: $221.60
* Target: $218.75 → $217.00
* Stop: $223.40
Watch the box: AMZN is stuck in a decision zone. Don't chase. Let it break first.
Final Thoughts:
AMZN is coiled tightly beneath its Gamma Wall. A clean break could trigger aggressive movement either way, so position sizing and stop discipline are critical. Avoid overtrading inside the box.
Disclaimer: This analysis is for educational purposes only and does not constitute financial advice. Trade responsibly and manage your risk.

GOOGL – Sitting on the Edge! What’s Next After This Break? 📊 GEX Analysis – Options Sentiment Insight:
* Call Resistance Wall: Strongest resistance at 180–182.5 area (High GEX%, Gamma Wall, 2nd & 3rd CALL Wall). A breakout above this may trigger a gamma squeeze.
* Support Zone: HVL @ 174.39 — aligned with PUT support and GEX10 (-6.92%) at 167.5, forming a key downside guardrail.
* Gamma Exposure (GEX): Green double-dot 🟢🟢 = supportive for bullish bias but nearing exhaustion.
* IVR/IVx: IVR 40, IVx avg 37.2 — Neutral to slightly bullish. Options aren't overly expensive, risk-reward still good for directional plays.
* Call Participation: 16.4% CALLS = Moderate bullish activity but not extreme greed.
🔥 Options Strategy Idea:
* Bullish case: If price holds above 174–175, consider 7/12 or 7/19 180C debit spread (e.g., Buy 175C / Sell 180C).
* Bearish case: Break below 173.5 and you can play PUT debit spread down to 170 or 167.5.
📉 1-Hour Chart Analysis (Intraday/Swing):
* Structure: Bearish CHoCH confirmed. Price has pulled back after rejecting from red OB zone (~179.5–180).
* Current Action: Price hovering below trendline and sitting above demand zone (173.5–174.4). Break and close below this could lead to continuation down toward 170.5 / 167.5.
* Bias:
* Bearish under 177.06.
* Neutral chop zone between 174–176.6.
* Bullish recovery only above 177.5–179.5 reclaim.
🎯 Scenarios & Trade Setups:
* Scalp BUY Setup:
* Entry: Hold above 175
* Target: 177 / 179.5
* Stop: Below 173.5
* Scalp SELL Setup:
* Entry: Break and retest below 173.5
* Target: 171 → 167.5
* Stop: Back above 175
📌 Thoughts & Suggestions:
* GOOGL’s options positioning suggests a potential bounce, but the bearish CHoCH and rejection at resistance urges caution.
* If bulls reclaim 177.5, we may see a push to test the heavy CALL walls at 180–182.5.
* Trade defensively inside chop zone, don’t force full directional plays unless you see clean BOS or demand failure.
Disclaimer: This analysis is for educational purposes only and does not constitute financial advice. Always do your own research and trade responsibly.

NFLX Options Setup – GEX Levels to Watch🎯GEX (Gamma Exposure) Insights
* Call Resistance Zone sits between 1310–1340, with 70.83% GEX Call Wall at 1310 and multiple smaller GEX walls stacked above (1320, 1330, 1340).
* Put Support Zone rests at 1270–1240, where Highest Negative GEX is clustered (1270 being the HVL level).
* IVR is elevated at 38.7, and IVX avg at 45.1 — this is a decent environment for premium selling if range persists but be cautious near breakout zones.
* Call Flow Dominant (23.7%) suggests bulls are still present but cautious.
📌 Suggested Option Trade (Short-Term):
* Bullish Scenario: Buy 1290c or 1300c for this week (if breakout >1300 confirms). Use 1270 as your stop zone. Target 1320–1340.
* Bearish Scenario: Buy 1270p if price fails below 1280. Target 1250–1240 zone. Consider debit spreads due to elevated IV.
NFLX 1-Hour Chart Setup (Smart Money Concepts) 📉📈
Structure:
* Price currently consolidating inside a liquidity zone near 1280–1290, between recent CHoCH and BOS.
* Price has reacted bullishly after BOS from 1270s, but has not yet broken above 1310 supply zone (previous CHoCH level).
* A wedge is forming — indicating squeeze/expansion soon.
Scenarios:
🔼 Upside Breakout:
* Trigger = Break and retest above 1300 with volume
* Entry = 1302
* Target = 1320 → 1340
* Stop = 1287
🔽 Downside Breakdown:
* Trigger = Clean break below 1279
* Entry = 1275
* Target = 1250–1240
* Stop = 1292
Volume: Low on the recent consolidation, signaling potential energy buildup.
My Thoughts:
NFLX is coiling in a tight range between key PUT support (1270) and CALL resistance (1310). GEX suggests explosive potential if either zone breaks, so don’t trade inside the chop. Let price commit. Watch the wedge breakout + volume spike. This could be a strong options play for the week.
Disclaimer:
This analysis is for educational purposes only. Always do your own research and manage your risk accordingly.
