Breakout Triangle // Gann 45° angleRigetti just broke out of the correction triangle. Also the two purple 45! gann angles hint toward an upshift. Pricetarget 1: ~16 USD // Pricetarget 2: ~24 usd // Stoploss just below 12 USD

SNAP is in the Wyckoff Accumulation phaseThis Week (July 8 - 12):
Support: The 20-week moving average around $9.00 is now the immediate floor. Below that, the recent support shelf is at $8.00.
Resistance: The first hurdle is the recent high around $10.40. Above that, the path opens up towards $12.00.
Next Month (July/August):
Support: The absolute low of the Selling Climax at $7.10 is the line in the sand that must hold.
Resistance: A major zone of contention will be around $14.00, which was a significant support/resistance area in the past.

PEP is in the Wyckoff Accumulation phaseThis Week (July 8 - 12):
Support: The recent consolidation shelf around $130.00 is the first line of defense. The absolute low and our line in the sand is the Selling Climax low at $127.60.
Resistance: The 20-week moving average at $138.30 is the immediate ceiling it needs to break through.
Next Month (July/August):
Support: The $127.60 low remains the critical long-term support.
Resistance: If it can clear the $140 level, the next major area of resistance to watch is around $150.00, a previous support zone that will likely attract sellers.

(NFLX) Brake out I would like to see (NFLX) brake this consolidation pattern. Once it does we should see a hard push past the resistance. It both of these happen I will be getting in on the pull back.

Tesla's Self-Inflicted Crisis of ConfidenceInvestors wanted Elon Musk to double down on EVs. Instead, they got a new political party and another reason to sell the stock.
Musk vs Trump: A Fight Investors Didn’t Ask For
Tesla’s latest sell-off has little to do with earnings or electric vehicles. Shares dropped 6.8% on Monday after Elon Musk announced plans to launch a new US political party, escalating his feud with Donald Trump and reigniting investor concerns about distraction at the top.
The fallout from Musk’s political re-entry has been swift. Tesla’s valuation has lost over $200 billion since late May, when Musk’s role in Trump’s short-lived government efficiency task force came to an end. His renewed focus on political activism contradicts April’s pledge to spend “far more” time on Tesla, and comes at a moment when the business is already under pressure from slowing EV sales and collapsing regulatory tailwinds.
Politics, Profits and a Shrinking Mandate
Trump’s so-called “big, beautiful bill” is slashing support for electric vehicles across the board. Gone is the $7,500 federal tax credit, set to expire in September. Gone too are the emissions penalties that allowed Tesla to bank billions in regulatory credits from legacy automakers. William Blair analysts estimate that over $2 billion in high-margin profit is now at risk.
The political clash is getting personal. Trump has mocked Musk’s behaviour as a “train wreck”, suggested deportation, and floated nationalising SpaceX. Investors, meanwhile, are left questioning whether Musk’s growing list of battles is starting to erode Tesla’s long-term advantage. The distraction risk is real, and the market is responding.
Technical Breakdown: Key Levels in Play
Tesla’s share price has woefully underperformed this year. The stock is down 22% year-to-date, while the S&P 500 is up 6%. Recent price action highlights just how vulnerable Tesla has become to the political whims of its CEO. The public fallout with Trump helped define a new swing high in May, which now acts as clear resistance. A new swing low was formed in early June, and that is now the short-term level bulls need to defend.
Adding Keltner Channels to the chart puts the recent volatility into perspective. The sideways bands and price bouncing between them show a market stuck in broad equilibrium. There’s little directional conviction, but that may be changing. Monday’s sell-off pushed Tesla below the volume-weighted average price anchored to the April lows. If the shares remain below this VWAP and break under the June swing lows, it would confirm the attempted recovery has failed and signal that the bears are back in control.
For now, Tesla isn’t trading like a high-growth innovator. It’s trading like a politically charged meme stock with no clear trend and no adult supervision.
Tesla (TSLA) Daily Candle Chart
Past performance is not a reliable indicator of future results
Disclaimer: This is for information and learning purposes only. The information provided does not constitute investment advice nor take into account the individual financial circumstances or objectives of any investor. Any information that may be provided relating to past performance is not a reliable indicator of future results or performance. Social media channels are not relevant for UK residents.
Spread bets and CFDs are complex instruments and come with a high risk of losing money rapidly due to leverage. 85.24% of retail investor accounts lose money when trading spread bets and CFDs with this provider. You should consider whether you understand how spread bets and CFDs work and whether you can afford to take the high risk of losing your money.

DOW is in the Wyckoff accumulation phaseThis Week (July 8 - 11):
Support: The recent low at $27.10 is the immediate floor. The ultimate support is the Selling Climax low at $25.10.
Resistance: The 20-day moving average (green line) around $28.50 is the first hurdle. Above that, look for a test of $30.00.
Next Month (July):
Support: The $25.10 low absolutely must hold.
Resistance: The primary target is the top of the trading range, established by the Automatic Rally, at $33.00.

Costco is in the Wyckoff distribution phaseThis Week (July 8 - 11):
Support: The immediate floor is at $965. Below that, the low from the initial sell-off around $955 is critical.
Resistance: The 20-day moving average (that green line) at ~$992 is the first ceiling. If it gets frisky, look for sellers to appear at $1,030.
Next Month (July):
Support: If $955 breaks, this whole structure fails. The next major stop would be the April lows around $872. That's the edge of the cliff.
Resistance: The all-time high of $1,067 is the ultimate party zone that the bouncers (sellers) are not letting anyone back into right now.

Apple May Dip to $203 FVG Before Resuming UptrendFenzoFx—AAPL (Apple) is bullish, testing the $210.0 resistance while Stochastic warns of an overbought market.
A dip to the bullish FVG at $203.0 is likely before the uptrend resumes.

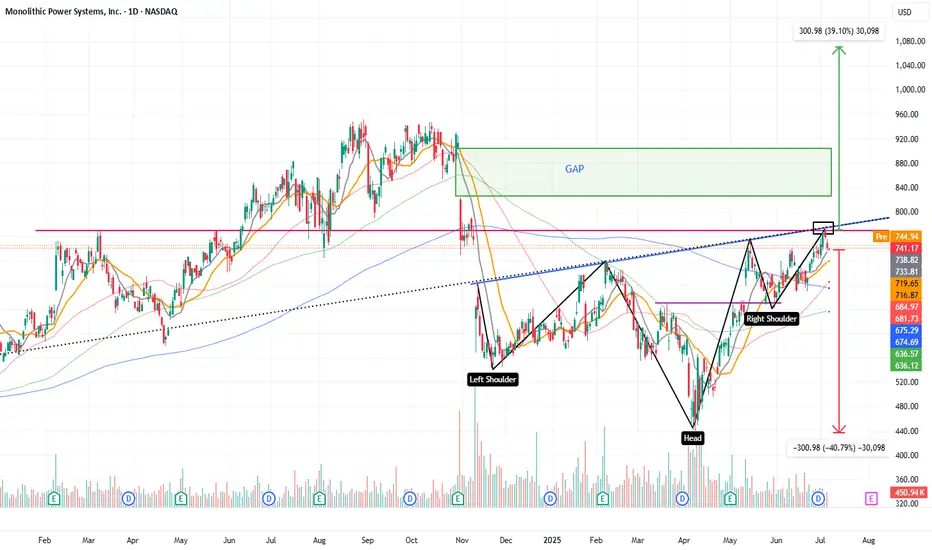
Inverse head and shoulders with a gap to close towards 1070$The price is completing the formation of an inverse head and shoulders pattern, with a head-to-neckline distance of approximately $300.
This suggests a potential breakout target around $1070.
Along the way, there is also a significant gap that has remained unfilled for several months.
The stock belongs to a company that manufactures power management chips used in all types of electronic devices, with steadily growing revenue
BIDU 1D: triangle breakoutBIDU 1D: triangle breakout + real-world AI deployment boosts bulls
Baidu (BIDU) breaks out of a triangle within a falling channel on the daily chart, with solid volume, reclaim of the 50MA, and approach to the 200MA. $90.09 flips into support. Targets stretch to $105.47 / $113.68 / $124.06 (Fibo levels).
Fundamentally, Car Inc just launched a robo-car rental service powered by Baidu’s Apollo unit. Fully autonomous, bookable for 4 hours to 7 days — this is not future tech, it’s live now. With a $32.6B market cap and low P/E (~12), BIDU looks positioned for revaluation if sentiment shifts.
Tactical setup: entry by market or retest of $90, stop below $82.
When the robot drives customers - you just drive the trade.

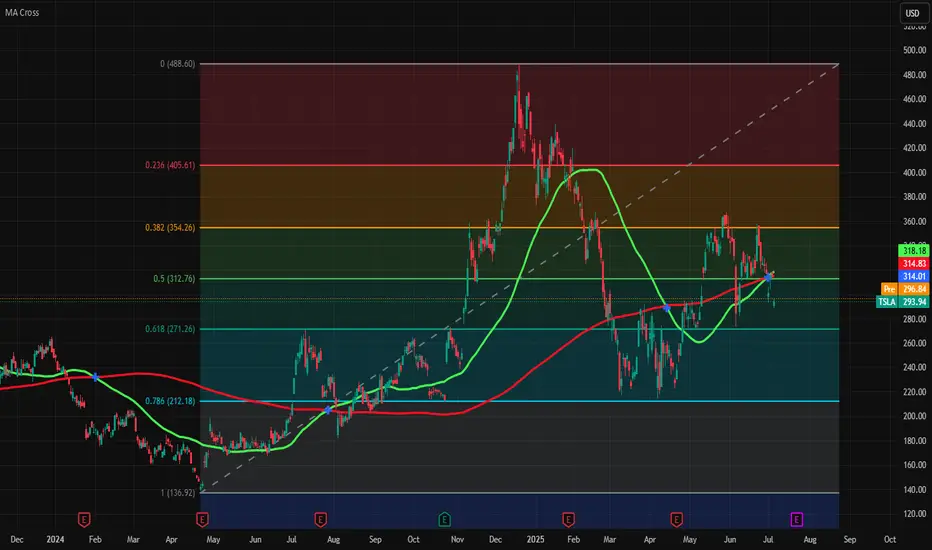
Tesla is on edge of Golden crossTesla is on edge of golden cross (50 and 200 days moving average crossover) and fresh entry is possible above green line of 50 days MA (318.18) and SL is 271 and TP is 354.
If it fall then wait for 271 level or again cross above green line.
APLD: Buying zoneAPLD:
Buying zone in green range.
Backtest with low supply volume- good signals.
.
Let's joy!
US STOCKS- WALL STREET DREAM- LET'S THE MARKET SPEAK!

Tesla (TSLA) Leads Declines in the Equity MarketTesla (TSLA) Leads Declines in the Equity Market
Yesterday, President Trump announced that letters had been sent to the United States’ trading partners regarding the imposition of new tariffs — for instance, a 25% tariff on goods from Japan and South Korea. This marks a return to “trade diplomacy” under the America First strategy. The tariffs are scheduled to take effect on 1 August, though the date remains subject to revision.
As we highlighted yesterday, bearish signals had begun to emerge in the US equity market. In response to the fresh wave of tariff-related headlines, the major indices moved lower. Leading the decline — and posting the worst performance among S&P 500 constituents — were shares of Tesla (TSLA). The sell-off followed news of a new initiative by Elon Musk, who now appears serious about launching a political “America Party” to challenge both the Republicans and Democrats.
Trump criticised his former ally’s move on his Truth Social platform, and investors are increasingly concerned about the potential impact on Tesla’s business. Tesla shares (TSLA) fell by more than 6.5% yesterday, accompanied by a broad bearish gap.
Technical Analysis of Tesla (TSLA) Stock Chart
On 2 July, our technical outlook for TSLA anticipated the formation of a broad contracting triangle in the near term. Yesterday’s price action appears to confirm this scenario:
→ The sharp move highlighted the lower boundary of the triangle (marked in red);
→ The $317 level — where the previously rising channel (marked in blue) was broken — acted as resistance.
It is worth noting that during yesterday’s session, TSLA did not fall further following the gap down. In other words, the bears were unable to extend the sell-off, suggesting that the stock may attempt a recovery towards the $317 level. This area could potentially act as a central axis within the developing triangle pattern.
This article represents the opinion of the Companies operating under the FXOpen brand only. It is not to be construed as an offer, solicitation, or recommendation with respect to products and services provided by the Companies operating under the FXOpen brand, nor is it to be considered financial advice.

BOEING COMPANY STOCK ENTER INTO BULLISH TREND Boeing Company Stock Enters Bullish Trend on 1-Day Time Frame
The Boeing Company (BA) stock has entered a bullish trend on the 1-day timeframe, signaling potential upward momentum. A key development in this trend is the recent breakout above the critical resistance level of $189.00, which now acts as a support zone. This breakout suggests strong buying interest and indicates that the stock may continue its upward trajectory in the near term.
Bullish Outlook and Price Targets
With the resistance level breached, Boeing's stock is expected to maintain its bullish momentum. The next major target on the upside is $265.00, which could be tested if the bullish trend sustains. This level represents a significant psychological and technical resistance point, and a successful breakout above it could lead to further gains.
Key Support Level to Watch
While the bullish scenario appears strong, traders should remain cautious of potential pullbacks. The $130.00 level serves as a crucial support zone. If the price retraces, this level will be critical in determining whether the bullish trend remains intact or if a deeper correction could occur. A break below $130.00 may signal a shift in market sentiment, but as long as the price stays above this level, the overall bullish structure remains valid.
Conclusion
Boeing’s stock has shown strength by breaking above $189.00, reinforcing a bullish outlook. Traders and investors should monitor the price action around this level for confirmation of continued upward movement. The primary target remains $265.00, while $130.00 serves as a key support in case of a downside move. If the momentum holds, Boeing’s stock could see further gains in the coming sessions.

BULL: Let's BULLBULL:
.
Let's BULL
BULL is coming back to take you off, dont miss this chance.
.
US STOCKS- WALL STREET DREAM- LET'S THE MARKET SPEAK!

$MBIO – Low Float Breakout Setup Toward $7+
🧠 **Idea Summary:
Mustang Bio (NASDAQ: MBIO)** surged on extreme volume and is now forming a potential continuation base above prior resistance. If current consolidation holds, there’s a high-probability move toward the next resistance levels near $6.40 and $7.00. Breakout traders should monitor price action closely.
🧱 Key Technical Levels:
Support Zone: $2.87 – $3.13
Current Price: $3.34
Immediate Resistance: $4.44
Target Zone: $6.43 – $7.08
Invalidation Level: Below $2.87
🔁 Trade Setup:
Entry Zone: $3.20 – $3.40
Stop-Loss: Below $2.85
Target 1: $4.44
Target 2: $6.43
Target 3: $7.08
Risk-Reward Ratio: Approx. 1:3+
📌 Observations:
Massive breakout candle with sustained volume
Strong multi-month base breakout
Volume >17M confirms strong interest
Clean levels for breakout and risk control
📅 Watchlist Triggers:
Break and hold above $3.40 on volume
Pullback retest to $3.00 with hold = reentry
Failure to hold $2.85 = setup invalid

WOLF to 5 in 20 daysI´m expecting an impressive climb on this penny stock due to spiking volume, broken resistance. If you have decided to trade this idea, control your sizing, profit target is huge, RR ratio very good,you don´t have to risk more than you can afford. TP your trades partially, because TP period can send your floating profit to 0. Wish you good luck.

MDWD: The art of simplicityMDWD:
The art of simplicity
.
US STOCKS- WALL STREET DREAM- LET'S THE MARKET SPEAK!

Is Decentralization the Future of Cell Therapy?Orgenesis Inc. (OTCQX: ORGS) champions a revolutionary approach to cell and gene therapy (CGT) manufacturing. The company focuses on decentralizing production, moving away from traditional, centralized facilities. This strategy, centered on their POCare Platform, aims to drastically improve accessibility and affordability of life-saving advanced therapies. Their platform integrates proprietary therapies, advanced processing technology, and a network of clinical partners. By enabling onsite therapy production at the point of care, Orgenesis directly addresses critical industry hurdles like high costs and complex logistics, which currently limit patient access.
Orgenesis's innovative model is already yielding promising results. Their lead CAR-T therapy candidate, ORG-101, targeting B-cell Acute Lymphoblastic Leukemia (ALL), showed compelling real-world data. A study demonstrated an 82% complete response rate in adults and an impressive 93% in pediatric patients. Crucially, ORG-101 also exhibited a low incidence of severe Cytokine Release Syndrome, a common safety concern with CAR-T therapies. These positive clinical outcomes, coupled with a cost-effective, decentralized production method, position ORG-101 as a potentially transformative treatment option.
The broader pharmaceutical industry stands at a pivotal juncture, with cell and gene therapies driving unprecedented innovation. The global CAR T-cell therapy market alone anticipates substantial growth, projected to reach \$128.8 billion by 2035. This expansion is fueled by increasing chronic disease prevalence, significant investment, and advancements in gene-editing technologies. However, the industry grapples with high treatment costs, manufacturing complexities, and logistical challenges. Orgenesis's decentralized GMP-validated platform, along with their recent acquisition of Neurocords LLC assets for spinal cord injury therapies and the MIDA Technology for AI-based stem cell generation, directly confronts these barriers. Their approach promises to accelerate development, enhance production efficiency, and reduce costs, potentially democratizing access to advanced medicine.

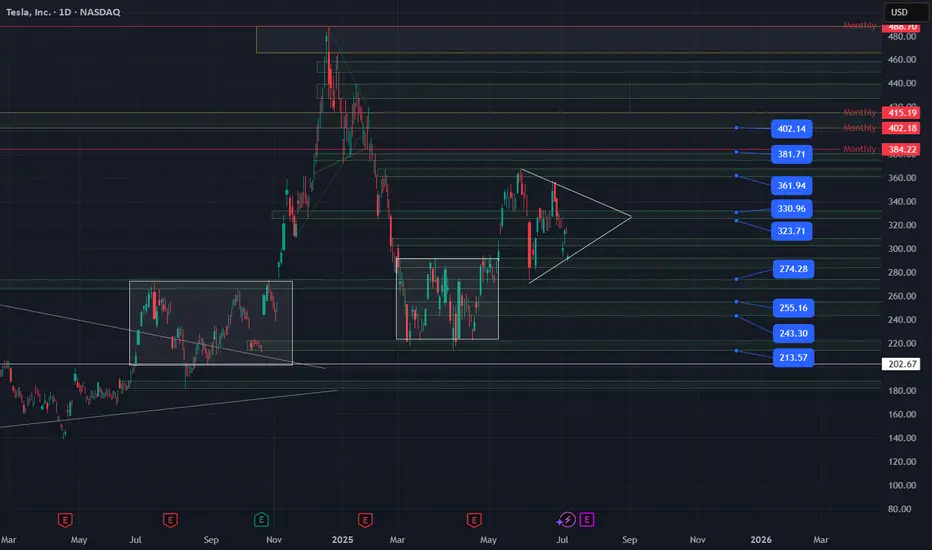
Long TSLA with a quick stop if we break back below 290.I have followed NASDAQ:TSLA for a while now and this 290 level has been huge. We have tried to test it a couple of times and failed, and you can see how price was stuck in a range below that level for almost 4 months earlier this year. The one thing that worries me is that there are a lot of people on social media calling for a pop here because of the drop we just saw and a lot of people are watching that 290 level. I think the market might punish the majority and dump this but the R:R is too great to ignore a trade here.
I would stop out of this if price closes back below 290 (on the 1H or D timeframe depending on your risk). If we don't stop out I would target 300, 310, 325. Break/hold above 333/5 and I would press longs for 360, 400.
If price does break/hold below 290 I would be short to target 280, 275. 275 should be another big support level as you can see the other white box/range on the chart has a top there. A look below and fail of 275 would be another good long entry and that would be the level I would watch if they decide to punish the 290 crowd.
I will post again if we see 275 otherwise look for upside with a quick stop as detailed above.
OSCR: A bored phase accumulation before next up viewOSCR: A bored phase accumulation before next up view.
Consolidating in a tight range to absorb remaining supply before resuming the uptrend.
.
US STOCKS- WALL STREET DREAM- LET'S THE MARKET SPEAK!

$OKLO Bullish SetupNYSE:OKLO is setting up a textbook cup and handle breakout on the daily chart, signaling a potential continuation of its impressive uptrend. The cup formed over several months with a rounded bottom, showing healthy accumulation behavior and strong trend structure. Following that, the handle is shaping into a clean bull flag — marked by a tightening price range with declining volume, which is typical before a breakout. The breakout trigger is a daily close above the $56–57 range, which would confirm the pattern and likely lead to strong momentum upside.
Using measured move logic and Fibonacci extensions from the cup’s depth and the flag’s structure, I’ve mapped out four staged price targets: $74.50, $108.00, and $184.25. These represent a potential upside of 31%, 91%, and 233% respectively if the pattern plays out fully. RSI is curling up around 54, which hints at building momentum — a breakout above 60 would further confirm strength. The Lum3n Trend Cloud remains bullish, the 8/21 EMAs are intact, and the 200-day moving average is far below current price levels, supporting the long-term bullish bias.
If NYSE:OKLO can break out of this handle with conviction and strong volume, the setup offers one of the cleanest technical continuation patterns on the chart right now. Watch closely for a breakout and hold above the $56 neckline — confirmation here could kick off the next powerful leg higher.

UNH How Far Down Are We Going $32 ? Based on the current class action lawsuit sentiment is negative and if it continues we can see levels of 258 being hit again. However if we break that level down then 163-150 level can possibly get hit followed by the 32-49 dollar range.
However despite all the negative news which does affect the market, if for whatever reasons we can break the high of 326 be prepared for a run up to 535 low probability but it is possible.
Trade Smarter Live Better
Kris/ Mindbloome Exchange
