Why Is CrowdStrike's Stock Soaring Amidst Cyber Chaos?The digital landscape is increasingly fraught with sophisticated cyber threats, transforming cybersecurity from a mere IT expense into an indispensable business imperative. With global cybercrime costs projected to reach $10.5 trillion annually by 2025, organizations face severe financial penalties, operational disruptions, and reputational damage from data breaches and ransomware attacks. This escalating threat environment has created an urgent and inelastic demand for robust digital defenses, positioning leading cybersecurity firms like CrowdStrike as critical enablers of economic stability and growth.
CrowdStrike's remarkable ascent is directly tied to this surging demand, fueled by pervasive trends such as widespread digital transformation, extensive cloud adoption, and the proliferation of hybrid work models. These shifts have vastly expanded attack surfaces, necessitating comprehensive, cloud-native security solutions that can protect diverse endpoints and cloud workloads. Organizations are increasingly prioritizing cyber resilience, seeking integrated platforms that offer proactive detection and rapid response capabilities. CrowdStrike's Falcon platform, with its AI-native, single-agent architecture, effectively addresses these needs, providing real-time threat intelligence and enabling seamless expansion across various security modules, which drives high customer retention and significant upsell opportunities.
The company's strong financial performance underscores its market leadership and operational efficiency. CrowdStrike consistently reports impressive Annual Recurring Revenue (ARR) growth, healthy non-GAAP operating margins, and robust free cash flow generation, demonstrating a sustainable and profitable business model. This financial strength, combined with its continuous innovation and strategic partnerships, positions CrowdStrike for sustained long-term growth. As enterprises seek to consolidate security vendors and simplify complex operations, CrowdStrike's comprehensive platform is ideally situated to capture a larger share of global cybersecurity spending, solidifying its role as a cornerstone of the digital economy and a compelling investment in a high-stakes environment.

Can Netflix Reach One Trillion Dollars? Can Netflix Reach One Trillion Dollars? The Market Already Bets on It
By Ion Jauregui – Analyst at ActivTrades
Netflix, the giant of digital entertainment, continues to cement its position as the global benchmark in streaming. With a market capitalization exceeding $515 billion, the platform is halfway to the trillion-dollar milestone, but more and more analysts and fund managers see this target as achievable in the medium term.
Strategies That Make the Difference
After the boom during the pandemic, Netflix faced fierce competition in its quest to gain and retain subscribers. The company responded with key measures: cracking down on password sharing, raising prices across its plans, and introducing an ad-supported subscription tier, an initiative that has significantly boosted performance metrics.
Thanks to this hybrid strategy, the company now boasts over 94 million monthly active users, many of whom fall within the highly desirable 18–34 age demographic, a segment with high long-term retention potential and strong appeal to advertisers.
Moreover, the platform has enhanced its advertising segmentation tools, enabling brands to reach their target audiences more precisely. Combined with Netflix’s data-driven content production model, this places the company in a highly competitive position compared to its industry peers.
Fundamental Analysis: Sustainable Growth and Competitive Edge
From a fundamental standpoint, Netflix is in a strong position with clear growth drivers:
• Revenue and earnings expansion: In the first half of 2025, the company reported over 15% year-on-year revenue growth and nearly 27% net income growth.
• Free cash flow on the rise: Both internal and external projections indicate that free cash flow (FCF) could double within five years, providing room for further content investment without increasing debt.
• Data-driven competitive advantage: Advanced analytics allow Netflix to optimize original content production based on viewing patterns, generating shows and films with higher success potential.
• Scalable model with increasing margins: The rising ARPU (average revenue per user) in the ad-supported tier suggests Netflix could boost margins without significantly raising operating costs.
• Low debt levels: With manageable net debt and healthy leverage ratios, the company retains financial flexibility for continued organic growth or share buybacks.
Analyst Ratings
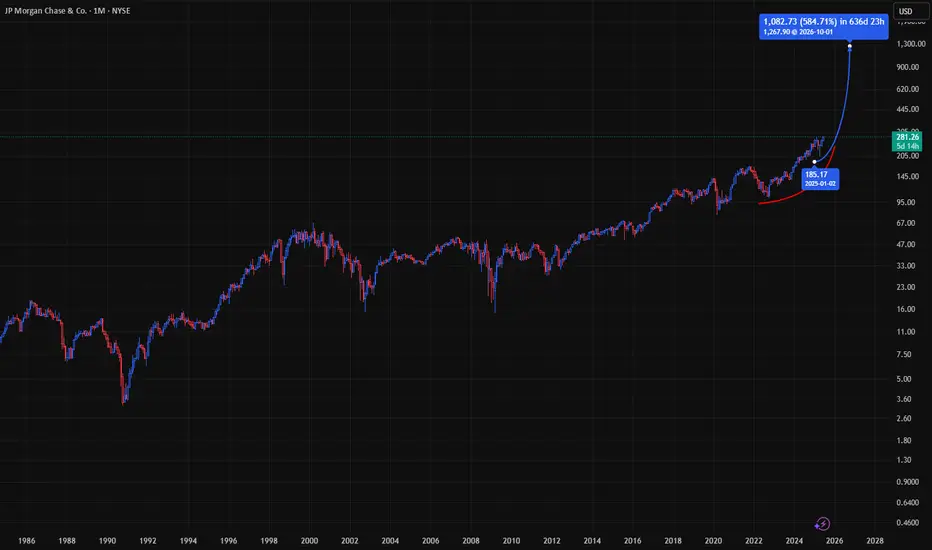
According to TipRanks, 38 analysts currently cover Netflix stock. Of those, 29 rate it a Buy and 9 a Hold, with an average price target of $1,255.76.
• Highest price target: $1,600 – Jeffrey Wlodarczak (Pivotal Research)
• Lowest price target: $950
• JPMorgan rating: Hold, with a target of $1,220 – Doug Anmuth
These figures reflect solid market confidence in Netflix’s upward trajectory, though they also suggest that some of the optimism is already priced in.
Technical Analysis: Signs of Strength
Netflix closed Tuesday at $1,278.59, staying above key medium- and long-term resistance levels. The 50-period moving average has remained below the price since mid-April, reinforcing the bullish trend. The RSI is in overbought territory (71.62%), and although the MACD is no longer positive, momentum remains strong in the short term.
This is further supported by a Point of Control (POC) around the $985 level, which served as the support base for the previous upward leg. These mixed signals suggest that a consolidation phase could occur before the stock resumes a stronger upward movement.
The current upward channel has remained intact, pushing prices toward the upper bound, where a retest of limits is likely. A sideways phase between $1,282.57 and $1,400 may precede a new breakout attempt.
Conclusion
Netflix has shown exceptional adaptability in capitalizing on shifts in digital consumer behavior. With a solid financial foundation, sustainable growth, and unique competitive advantages in data and content, the company has a real shot at reaching a one-trillion-dollar valuation. Time and execution will ultimately decide whether that goal is achieved—but the groundwork is already in place.
*******************************************************************************************
The information provided does not constitute investment research. The material has not been prepared in accordance with the legal requirements designed to promote the independence of investment research and such should be considered a marketing communication.
All information has been prepared by ActivTrades ("AT"). The information does not contain a record of AT's prices, or an offer of or solicitation for a transaction in any financial instrument. No representation or warranty is given as to the accuracy or completeness of this information.
Any material provided does not have regard to the specific investment objective and financial situation of any person who may receive it. Past performance is not reliable indicator of future performance. AT provides an execution-only service. Consequently, any person acting on the information provided does so at their own risk.

JPMorgan Chase (JPM) Gaining Bullish TractionPM is exhibiting strong bullish behavior, with price action pushing higher on increasing momentum
The stock has cleared key short-term resistance levels, signaling confidence among buyers
Volume trends are supportive, and technical indicators point to sustained upside potential
As long as JPM holds above its recent breakout zone, the path remains favorable for further gains
Investors should watch for continuation signals or healthy pullbacks for potential entry points
The broader market tone also supports strength in financials, adding conviction to this move
#JPM #JPMorganChase #TechnicalAnalysis #MomentumPlay
#JPMorgan #Bullish #Stocks #Momentum #TradingUpdate
SLM Corp(SLM) Showing Strong Bullish Energy
SLM is flashing high momentum signals
Price action is bullish and gaining traction fast
If this pace continues, we could see a sharp move to the upside
Keep an eye on volume—momentum could accelerate quickly
A breakout setup is brewing
#SLM #Stocks #Bullish #Momentum #TradingAlert

AMZN Heating Up – GEX Shows There's Room to Run!
Alright, guys – here's the scoop on Amazon (AMZN) right now based on the latest GEX map and price action.
🧠 GEX Setup:
We’re seeing solid call gamma buildup from 213 → 220, and a strong positive NET GEX wall near 215–217. That tells us market makers might start pushing price toward those high-gamma zones to hedge, especially above 213. Gamma support kicks in from 210 down to 207, so bulls have a nice cushion below.
👉 IVR 7.1 is low, and calls flow is healthy at 4.2%, meaning option premiums are still pretty cheap – great time to consider buying options before a possible breakout push.
🎯 Options Strategy:
If you're looking to catch the upside gamma move:
* ✅ Buy CALLs around 213–215 strike
* 🎯 Target 217.5 or 220+
* ⛔ Stop below 210 or HVL zone
You want to be in before the gamma snowball effect starts pulling price up.
🧩 Price Action & Smart Money Structure:
The 1H chart is showing strong SMC structure:
* BOS confirmed ✅
* Higher low forming
* Choppy flag forming just under resistance — could break out soon
We have clear liquidity above 214–217 (old OB zone), so price may hunt that next. There’s a big imbalance left from the selloff — if we get a retest of the green OB at 210–211 and hold, that's your confirmation for a solid long entry.
📌 Trade Idea Summary:
* Bias: Bullish short-term
* Entry Zone: 211–213
* Target Zone: 217.5 → 220
* Stop: Below 208
* Option Play: Calls (1–2 DTE or next week)
If 213 holds and volume picks up, we could ride the gamma wave right into those high OI strikes. 🔥
Disclaimer: This is not financial advice. Just one trader’s view using GEX and smart money price action. Always manage risk and size appropriately.

GOOGL at a Turning Point! Gamma Levels. CALLs Might Be LoadingGEX Insight (Options Sentiment):
* GOOGL has strong positive GEX zones between 170–175, showing Gamma resistance walls from 2nd and 3rd CALL levels.
* Price is currently trading around 167, close to the highest positive NET GEX / Gamma Wall, meaning market makers are likely to defend this zone.
* With PUT support far below at 160, there’s limited downside gamma pressure short-term.
* IVR is at 26.5 with increasing CALL flow (16.5%) and positive GEX skew — all signs lean toward a potential upside squeeze.
✅ Trade Idea (Options Bias):
Consider a short-dated CALL option targeting the 170–175 zone if price breaks above 168 with momentum.
* You can buy 06/28 or 07/05 170c or 172.5c contracts on breakout confirmation.
Trading Plan Based on Price Action (1H Chart SMC):
Current Zone:
Price is consolidating just above a reclaimed order block (green box) after a Change of Character (CHoCH) and small Break of Structure (BOS). We’re hovering near key resistance.
Bullish Case:
* If price holds above 165–166 support zone and breaks the small CHoCH zone at ~168, this opens a move toward 172.5 then 177.3.
* Ideal entry: Above 168.2 (confirmed BOS), with stop near 164.
* Target 1: 172.5
* Target 2: 177.3
Bearish Rejection?
* If price fails to hold above 165, and we break below 162, this confirms rejection from Gamma resistance. Look for PUTs only under 160.
My Thoughts:
GOOGL is attempting a shift in trend structure. GEX data is favoring a push higher, and Smart Money seems to be accumulating just below the Gamma Wall. If buyers show up with volume on the breakout — this could be a clean ride to 172+. But don’t get trapped — wait for the structure break and volume to kick in.
This is not financial advice. Just ideas to help sharpen your view. Always manage your risk. 🧠📈

MSFT GEX Levels Say “Still Room to Run!”—Here’s the Trade Setup
Alright, traders, MSFT is showing some juice left in the tank based on today’s GEX profile.
💥 GEX & Options Sentiment
* GEX is positive with 9.95% call support, IVR at 1.7 (still low), and IVX dropping slightly. This gives the greenlight for calls if the breakout holds.
* Big GEX magnets sit near 492.5 → 497.5 → 500. That 500 level aligns with the 3rd call wall and is the key magnet if bulls take charge.
* As long as we stay above 485, we’re in a favorable zone supported by 39–50% GEX brackets.
📈 Best Option Trade Idea (Short-Term):
Consider 495C or 500C (0DTE or 2DTE) on any breakout above 492.5 with volume confirmation.
SL = below 485
TP = trail into 497.5 and partials before 500.
🔎 Chart View + Price Action Notes (1H)
From the second image:
* MSFT broke structure cleanly with multiple BOS and CHoCH confirmation. It’s consolidating in a bullish flag under 492.5.
* Volume stayed decent even during the flag, suggesting accumulation.
* Purple zone = liquidity pocket or SMC supply → break of that zone will unlock the 495/497 levels fast.
🚨 Trade Plan:
* If MSFT breaks above 492.5, enter with momentum. Use 485 as your invalidation zone.
* If it dips to 486–485, look for a bounce/retest entry for a better risk-reward.
Bias: Bullish
Trigger: Break of 492.5 or retest of 486 support
Target: 497.5 → 500 GEX wall
Stay sharp — follow the GEX, not the noise. 📊
This content is for educational purposes only and is not financial advice. Always DYOR and manage your risk.

META is Heating Up! Time to Ride the Gamma Wave? 🔥 GEX Insight – Institutional Positioning:
META’s GEX chart is showing strong bullish sentiment:
* 📈 Highest Net GEX / Call Wall at $710, with stacked call resistance up to $740+.
* ✅ Current price at $712.10 has already pushed into the upper gamma zone — this puts $725 and $732.5 in play.
* 🟩 IVR at 5.5 + IVX dropping = low implied volatility zone — perfect time to buy calls cheap before volatility expansion.
* 🟢 GEX boxes: Full green lineup = highly supportive environment for bullish flow.
Options Idea:
🎯 Buy META 720C 06/28 (Friday expiry)
* Entry under $712.50
* Risk: below $703.00 (invalidates gamma push)
* Target 1: $725
* Target 2: $732.50 (GEX wall)
Why it works: You're riding on gamma exposure, a fresh breakout, and institutional positioning behind you.
Chart-Based Trading Plan (1H Structure):
META just broke above a long consolidation zone with:
* 🔄 Clean CHoCH → BOS → CHoCH bullish market structure.
* 🔼 Price retested the OB at ~$703–705, then bounced hard, forming a bull flag.
* ⛽ Volume spike and consolidation just below resistance at $715, with clear path toward the next SMC target at $740.
Trade Scenario:
* 📈 Bullish Play:
* Entry: Break above $713.00 (flag breakout)
* Target: $725, then $732.50
* Stop-Loss: Below $703 (last demand and CHoCH)
* 🧘♀️ Conservative Entry: Wait for pullback to $707–708 area (OB support), enter calls on bounce with tighter risk.
Wrap-up:
META’s GEX flow and technical structure are aligned for a potential continuation higher. You’ve got institutions buying calls into low IV, and price holding structure above BOS and CHoCH. Great odds for a momentum play to the upside — just don’t chase too high without a plan.
Disclaimer: This is not financial advice. Trade at your own risk with proper sizing and a risk management plan.

AAPL Bulls May Regain Momentum – Price Action Suggest a Bounce 🔍 GEX-Based Options Insight:
* GEX Cluster sits heavy at 204–206, marking a Gamma Wall / Resistance Zone.
* Highest NET GEX levels suggest 205–206 is a magnet if price builds strength.
* IVR: 16.2, IVX is low, indicating cheap premium for call buyers.
* Calls: 0.6% bias, showing a neutral-to-light bullish flow.
🟩 GEX Support: 197.5
🟥 PUT Walls: Below 192.5 and 190 (farther from current level)
🧠 Technical View (1H Chart):
* AAPL is pulling back into a demand zone while still respecting the upward channel.
* Just formed a CHoCH, signaling a potential reversal back up.
* Price is sitting on channel support + demand, with a recent BOS confirming bullish structure intact.
* Volume during this pullback is lower than the prior bullish leg—healthy retrace.
🔁 Trading Idea (for calls):
Entry:
🟢 Around 198.5–199 (channel and OB support zone)
Target 1:
📈 201.50 – retest of supply / GEX resistance
Target 2:
📈 204.88–206 – Gamma Wall target
Stop Loss:
🔴 Below 196.50, breaks OB and structure
🎯 Ideal Option Play:
* July 5th or July 12th 202 Calls
* Low IV makes this a decent R/R for directional play
* Momentum confirmation on reclaim of 200.80 gives confidence
💬 If AAPL can defend the current structure and flip 200.80 intraday, we may see a gamma chase back to 204+.
This analysis is for educational purposes only and not financial advice. Always trade with a plan and proper risk management.

PLTR Breaking Resistance: Gamma Squeeze Potential to $144–$148?🧠 GEX Insights – Options Setup
* Current Price: $143.23
* Highest Positive GEX Level: $142.00
* Next Call Walls:
* $144.00 → +31.09% GEX (3rd Call Wall)
* $148.00 → +46.45% GEX (2nd Call Wall)
* IVR: 13.7 (low)
* IVX Avg: 55.2 → IV is underpriced, suitable for long calls
* Call Flow: 37.3% bullish
* GEX Sentiment: 🟢🟢🟢 (Bullish)
💡 Interpretation: Price is sitting above the highest positive GEX zone and just broke into the first major gamma wall at $143. If price sustains this breakout, market makers may be forced to hedge by buying more shares, leading to a gamma squeeze toward $144 → $148.
📊 Trade Idea – Technical Chart Thesis
From the second chart:
* Strong Break of Structure (BOS) just occurred above the $142.15 resistance
* Price reclaimed the pink supply zone and is attempting continuation
* Trendline support is intact from recent higher lows
* Volume is increasing on breakout, confirming momentum
📈 Bullish Scenario:
* Entry: Above $143.20 (confirm breakout retest or continuation)
* Targets:
* TP1: $144.00
* TP2: $147.13
* Stretch TP: $148.00
* Stop-loss: Below $141.80 or trendline
* Options Play: Buy 6/28 or 7/5 $145C or $147C if volume continues rising
📉 Bearish Rejection Setup (if false breakout):
* If price fails to hold $143.00 and breaks $142.00 with volume → reverts to $139 zone
* Consider short-term PUT only if price reclaims below $141.80 with confluence
✅ Summary
* ✅ GEX favors CALLs, and breakout aligns with technical strength
* ✅ Volume + BOS + GEX = strong confluence
* ⚠️ Watch for consolidation near $144 and fade if unable to break
* 🎯 Most likely scenario: move to $144–$147 range by midweek
This analysis is for educational purposes only and not financial advice. Trade with proper risk management.

NVDA Heating Up: Gamma Walls Hint at 150+, Is This the Breakout?
📊 GEX Options Sentiment – Bullish Setup
The GEX (Gamma Exposure) landscape for NVDA shows strong bullish pressure:
* Highest Positive GEX & Gamma Wall at $147.80, which NVDA is testing now.
* Call Walls stacked at:
* $148.00 (59% GEX7)
* $149.00 (76.85% GEX8)
* $150.00 (76.23% GEX9)
* IVR: 1.7 (low implied volatility)
* Calls $%: 5.8%
* Sentiment: 🟢🟢🟢 (bullish)
This zone between 147.80–150 is a high-confluence area for a gamma squeeze, especially if NVDA can push and close above 148.00.
✅ Options Suggestion:
Consider 146C–150C (6/28 or 7/5 expiry) if NVDA reclaims 147.80 cleanly with volume. Low IVR makes this attractive for directional plays.
📉 1H Trading Plan – Price Action Analysis
On the 1H chart:
* Structure: Clean Break of Structure (BOS) after reclaiming previous resistance near 145.
* Current price is consolidating in a small supply zone (purple box) at highs.
* Trendline support from June lows is intact.
* Previous CHoCH levels and demand zone between 142–143 remain unbroken — a bullish structure.
Trade Scenarios:
🔼 Bullish Breakout Setup:
* Entry: Above 148.00 breakout (watch for volume confirmation)
* Target: 149.50 → 152.00 → 154.00 (top GEX zones)
* Stop: Below 145.00 (invalidates the breakout)
🔽 Bearish Fade (Only if rejection):
* Entry: Rejection from 148.00 with high volume + failed reclaim
* Target: 145.00 → 143.50
* Stop: Above 148.50
🎯 Final Thoughts
NVDA is sitting right under its gamma squeeze trigger. A breakout above 148 backed by GEX momentum could see a quick move toward 150+. This is a high-conviction zone — but don’t chase blindly. Watch price action around 147.80–148.00 for confirmation.
This analysis is for educational purposes only and not financial advice. Trade at your own risk and always use proper risk management.

A Cheeky ScalpLet's see if the Bart pattern moves all the way down, keeping a tight stop loss below the barely holding support
TSLA: GEX Points to Bounce Setup. Is This the Dip to Load Calls?📊 GEX-Based Options Suggestion
Gamma Exposure (GEX) data paints a bullish opportunity if TSLA holds the critical support zones:
* ✅ Key GEX Levels:
* $338: Near current price, minor GEX flip zone.
* $345–$350: Strong upward magnets (3rd Call Wall + GEX build-up).
* $359: Gamma Wall + Highest Net Positive GEX — market makers may pin price near this into end of week if bulls hold.
* 🛡️ Below Support:
* $330: Light PUT defense.
* $320: Major Put Support (-67.5%) — strong bounce zone if downside accelerates.
🔔 Option Trade Idea Based on GEX:
With TSLA near the $338 zone and GEX showing stacked resistance above + positive net exposure, a high-risk/reward call entry is forming.
* Play: Buy 345C or 350C expiring 06/28 or 07/05
* Trigger: Only if price holds $335+ and shows strength with volume bounce
* Target: $345 → $350 → potential pin near $359 (Gamma Wall)
* Stop: Close under $332 invalidates the bounce setup
🧠 Trading Setup – 1H Chart (Second Image)
From the second image, we analyze price action and structure to validate the GEX idea:
📉 Market Structure:
* Price is pulling back into a prior demand zone from $335–$338.
* Trendline support + Fair Value Gap zone + SMC CHoCH aligning at this base.
* Multiple bullish CHoCHs suggest potential reaccumulation if support holds.
🎯 Trading Plan Based on Price Action:
Bullish Case (Base Holds):
* Entry: $335–$338 zone (bounce off trendline and demand zone)
* Target: $345 (GEX level) → $348 → $350
* Stop-Loss: $331
High confluence with GEX option play. Use volume spike for confirmation.
Bearish Breakdown Scenario:
* Trigger: Loss of $331 + trendline break
* Target: $325 → $320 (strong PUT wall support)
* Put Options: 325P or 320P if breakdown triggers with momentum
⚠️ Summary:
TSLA is entering a decision zone — GEX shows bullish opportunity if $335 support holds, with upside targets toward $350–$359. But if price breaks under $330, expect a flush toward PUT support.
Patience is key — let price confirm the bounce or the break.
This setup is for educational purposes only. Trade with discipline and use stops. Always do your own research.

K.I.S.S.Keep it simple stupid
My favourite market acronym. There's not a lot of price history to go on, just 1 trend line and some hidden bullish divergence. Tight stop loss below the trend

Uber (UBER, 1W) Tightening Structure Ready for BreakoutOn the weekly chart, UBER has formed a strong ascending wedge / tightening channel, showing clear higher lows and repeated rejections near upper resistance. The price is now approaching the apex of the pattern, with a possible breakout setup above $82.42.
If confirmed, the projected measured move (H = $27.67) aligns with Fibonacci extension targets at:
– $89.86 (1.272)
– $93.74 (1.414)
– $99.32 (1.618)
Technical structure:
– Price held support twice, confirming bullish intent
– Structure tightening — breakout likely on sustained volume
– Bullish divergence forming on the weekly stochastic oscillator
– A breakout above $82.42 activates the next impulse wave
– Volume is stable, with no signs of heavy distribution
Fundamentals:
Uber has reached a major financial milestone: consistent profitability and positive EBITDA growth. The company continues to expand across mobility and delivery, with a focus on cost efficiency, platform monetization, and retention. Increased user activity and growing institutional interest support a bullish mid-term thesis. Uber is increasingly seen as a core holding in next-gen tech and services portfolios.
The technical structure is approaching resolution. A confirmed breakout above $82.42 opens the door for a move to $89.86 → $93.74 → $99.32. With bullish structure and improving fundamentals, Uber is positioned for the next leg higher. This is a setup worth watching.

(Daytrading) APPL going upH1 chart is respecting the uptrend.
Price has retested the 50 SMA on the H1 timeframe.
Price also touched the Ichimoku Cloud on H1.
→ Based on the risk-to-reward ratio, I’m expecting a Call position.


NOC Short (Military)NOC is now net short on the regression break.
I am not taking this trade, I will keep as eye out for a long position on the turn.

Blacksky looking at an early uptrend and longggggNYSE:BKSY has been stealthily forming a new high after breaking above the larger falling wedge which started since September 2021. Moreover, the stock has formed a pair of higher low and judging from the strong bullish price action and momentum, the stock is likely to break above the new high.
Long-term MACD is looking good as the histogram is positive and MACD/signal line has trend above the zero line.
Stochastic Oscillator (62, 12,12) looks at a steady rise and is not overbought yet.
23-period ROC is psoitve and rising steadily.
Volume surge and stays within a strong, healthy expansion
Directional movement index displays a strong bullish strength signal
Overall bullish score is at 8/10. Metrics is based on 80% non-discretionary and 20% discretionary
Strategy: Buy spot at 17.58 but expect resistance at 19.61. OR buy on pullback at 12.95 or 8.83.
Target is at 53.20 and 99.32 over the longer-term period.

DNA on WatchLooking to by a pullback to previous high of day, just above $9.
Why:
Strong close today with high volume
Low volume on the previous pullback from June 11 to June 20
Looking for a retest of previous high ~$10

NAGE on WatchLooking to enter on a pullback/retest of previous upper channel (blue lines).
Why:
Upper channel aligns with 20EMA and 50EMA
Upper channel aligns with .50 fib level
Strong daily uptrend in the past
MACD bullish

CURI on WatchLooking to buy a pullback around $5.50
Why:
.382 fib level may act as resistance.
20EM lining up with fib level
MACD turning bearish on hourly, but is turning bullish on daily

LMND Wedge Breakout – Ready to Squeeze! 🚀
📝 Description:
LMND just broke out of a falling wedge while respecting its ascending trendline support. This is a classic bullish continuation pattern, backed by a healthy pullback and strong recovery from the $44 zone.
📍 Entry: $44.93
🎯 Target: $49.38
🛑 Stop Loss: $43.55
⚖️ R:R: Over 2:1
⏱️ Timeframe: 30-minute chart
🧠 Setup Style: Breakout + Trendline bounce
Watching for a clean move above $46.00 to confirm momentum. Looks like bulls are stepping in again after consolidation.
#LMND #BreakoutSetup #WedgePattern #TradingViewCharts #TechnicalAnalysis #ProfittoPath #SwingTrade
