ZIMV Medical's bashed down +100% Long Term opportunity?Medical Stocks have been bashed of late.
All Medicals remain highly speculative, but can provided huge upside for the risky Investor or Trader.
Studying the PA (Price Action) and the Trend Curve can offer one entry positions.
Support and resistance Zones show a potential nice 100% upside.
As always if you are unsure, please consult with your own personal investment Advisor before making any Trades or Investments as most are 12 months or more views.
Should you apreciate my comments and chart studies - please smash that like button. It's just a click away.
Regards Graham

BAH Gaining Momentum With New DOD ContractsBAH recently fell after missing earning expectations, though the results were quite decent. It is currently sitting at 57% of 52 Weeks high. Seems oversold. Its AI products are going to contribute significantly to future revenues. Recently on June 16th, it won a DoD contract worth $96.07 million. Plus, the SMA (10) is finally crossing above SMA (50).
First target (A) seems to be $115 ish. If it breaks that resistance, 2nd target (B) seems to be about $122+.
NFA, just sharing my learning. :)

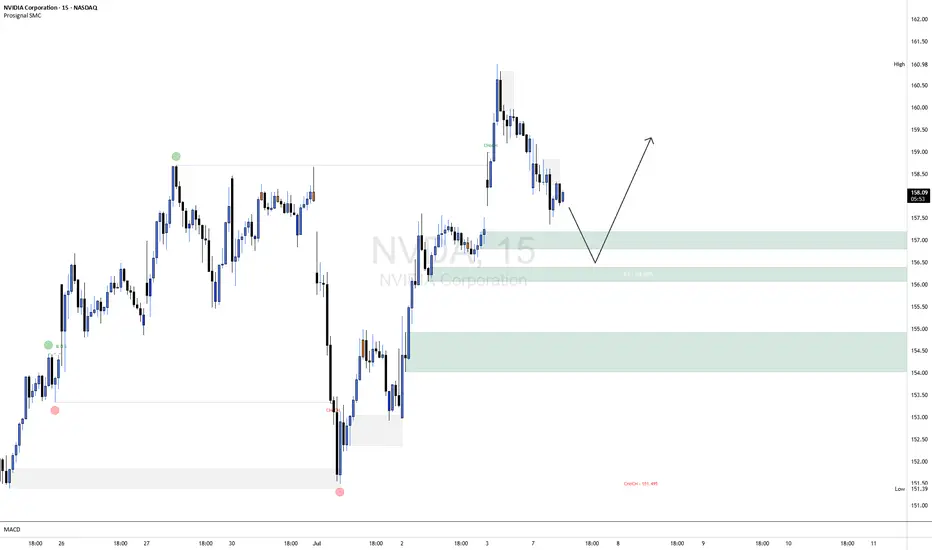
NVDA ShortNVDA is currently exhibiting short-term bearish order flow on the 15-minute chart, with price making lower highs and lower lows following a clear CHoCH (Change of Character) to the downside. The current leg suggests continued weakness as price retraces toward the highlighted bullish order block around the 156.20–157.00 range, aligning closely with the 50% equilibrium level of the last bullish impulse.
This area represents a high-probability demand zone where we anticipate a potential bullish reaction. A confirmation entry (e.g., bullish BOS or lower timeframe CHoCH within the OB) will be required to validate a long setup from this zone. Should confirmation present itself, upside targets can be trailed back toward recent highs near 159.00–160.00.
Risk Management Note:
Always wait for confirmation before entering against the prevailing short-term trend. Use a well-defined stop-loss below the order block and calculate your position size based on your overall risk tolerance (typically 0.5–1% of account equity per trade). Avoid overleveraging, and remember that patience and discipline are key to capital preservation.
3 Reasons the Meta (META) Double Top Is a Buy Signal3 Reasons the Meta (META) Double Top Is a Buy Signal – Rocket Booster Strategy Explained
Meta Platforms Inc. (META) recently printed what looks like a double top pattern on the 4-hour chart.
Many traders are expecting a reversal. But from my perspective, this setup could actually be a trap for early short-sellers. Here's why.
The overall trend remains bullish. Price is still trading above the 50 EMA and the 200 EMA, which confirms that the long-term and
short-term momentum is still upward. When a double top appears in a strong uptrend but fails to break the neckline, it often
becomes a fakeout. Instead of reversing, the price consolidates, shakes out weak hands, and then breaks higher. This is where my
strategy comes in.
I call it the Rocket Booster Strategy. It works like this:
1. First, the price must be above both the 50 EMA and 200 EMA. This confirms we’re in an active uptrend.
2. Then, if a bearish pattern like a double top appears but the neckline does not break, that’s a sign of a trap.
3. We wait for price to bounce near the neckline or break above the recent top. That’s the ignition point – the rocket is ready to fire.
In this Meta setup, if price holds above the neckline or quickly reclaims the recent high, it becomes a strong buying opportunity.
The pattern fakeout acts like fuel, giving bulls the momentum to push price even higher.
This is a high-probability setup because many traders get caught
in the trap, expecting a sell-off, and their stop-losses become buy fuel for the next rally.
Trade idea:
Entry: near neckline bounce or breakout above second top
Stop loss: below the neckline or under the 50 EMA
Target: new highs and above
Final thoughts:
Don’t fall for surface-level patterns. In strong uptrends, failed double tops are often just launchpads. The Rocket Booster
Strategy helps us spot the fakeout and ride the breakout.
How 3 Simple Conditions Turn a Double Top Into a Buy Signal
Most traders see a double top and expect a reversal. But in strong uptrends, this pattern can fail — and when it does, it often sets up
a high-probability buying opportunity. Traders who use the Rocket Booster Strategy understand how to spot these traps and trade them in the direction of the trend.
Here’s how the strategy works — and why some double tops become launchpads, not ceilings.
1. Price Above Both 50 EMA and 200 EMA
When price remains above the 50 EMA and 200 EMA, it confirms strong bullish momentum in both the short and long term. In
these conditions, many reversal patterns like the double top often fail. Instead of selling off, price consolidates and continues higher.
Traders using this strategy only look for buy setups when both EMAs are pointing up and price stays above them.
2. Bear Trap Setup
A double top often attracts sellers. These traders place their stop-losses just above the highs. If price fails to break the neckline and
instead rallies above the top, those stop-losses are triggered, creating a surge in buy orders. This becomes a trap — not a
reversal — and the breakout can be fast and aggressive. The Rocket Booster Strategy takes advantage of this liquidity burst.
3. Entry After Confirmation, Not Assumption
Instead of shorting the pattern, traders using the Rocket Booster Strategy wait for one of two bullish confirmations:
A bounce off the neckline without breaking below it
A breakout above the second top after the trap is set
At that point, the trend is considered intact, and momentum is ready to continue. The "rocket" is refueled, and the strategy shifts
into entry mode.
Trade Setup Example:
Entry: Near neckline bounce or breakout above second top
Stop Loss: Below neckline or under the 50 EMA
Target: New highs and above the pattern top
Final Thoughts
In strong trends, failed double tops are not warning signs — they’re opportunities. The Rocket Booster Strategy filters out weak signals by requiring clear alignment:
price above both EMAs, pattern failure, and bullish confirmation. When these conditions align, a pattern that looks bearish on the surface becomes a fuel source for the next breakout.
Disclaimer: This article is for educational purposes only and not financial advice. Always do your own research.

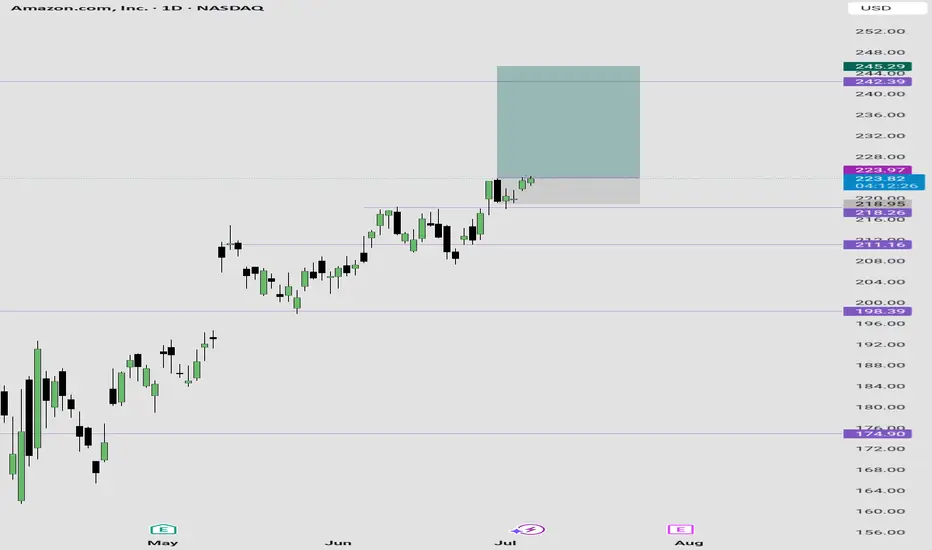
Amazon Long IdeaBuying Amazon shares here...
Reason:
Bouncing off support with good bullish price action candles.
I expect the price to reach $245 per shares between now and next week Friday....
My stop loss price is on the chart.
UP Fintech Holding Ltd. (TIGR) – Fintech Expansion in MotionCompany Snapshot:
NASDAQ:TIGR is a digital-first brokerage gaining global traction by combining smart technology, cost efficiency, and a user-friendly experience that appeals to both retail and institutional investors.
Key Catalysts:
User Growth Acceleration 🚀
In Q2 2025, TIGR added 60,900 new funded accounts—a 111.2% YoY surge, signaling successful customer acquisition strategies and platform stickiness.
Diversified Capital Flows 💼
Net inflows from both retail and institutional segments reflect a broad and balanced client base, enhancing revenue durability and cross-sell opportunities.
Operational Efficiency 💰
With a gross margin of 83.8%, TIGR exhibits strong pricing power and scalability, positioning it well for future international expansion and product diversification.
Investment Outlook:
Bullish Entry Zone: Above $8.25–$8.50
Upside Target: $14.50–$15.00, backed by its asset-light model, tech-first approach, and rising user momentum.
📱 As global fintech adoption rises, TIGR’s digital brokerage model is proving both resilient and scalable.
#TIGR #Fintech #OnlineBrokerage #DigitalFinance #UserGrowth #MarginExpansion #GlobalInvesting #ScalableTech #FinancialInclusion #StockMarket

$AMD Swing Trade – Put Debit Spread Setup🔻 NASDAQ:AMD Swing Trade – Put Debit Spread Setup (Jul 18 Exp)
📅 Trade Opened: July 3, 2025
🛠 Strategy: Buy to Open (BTO) Put Debit Spread
📉 Strikes: $31 / $30 (Jul 18 Expiration)
💵 Cost (Premium Paid): $0.21
🎯 Trade Thesis
This setup aims to capture short-term downside in NASDAQ:AMD via a low-cost, defined-risk spread. The trade fits within my broader portfolio of OTM spreads under $0.25.
Key Drivers:
🔻 Semi sector under pressure – NASDAQ:AMD showing relative weakness.
📉 Breakdown below key support near $31 and rejection at VWAP.
🧾 Weak momentum – MACD trending down, RSI near 44.
🔄 Trade enters into earnings season volatility.
📊 Technical Setup (Daily)
EMA(4) < EMA(8) < EMA(15): Bearish structure fully intact.
VWAP: Price rejected from 30-day VWAP zone.
MACD/RSI: Momentum still fading, no signs of bullish divergence.
⏳ Strategy Notes
Max loss: $0.21
Max gain: $0.79
Risk/reward structured for a drop into or below $30
Expiration: July 18
🧠 Journal Note
Most of my trades are swing-based using OTM debit spreads with tight risk control. No same-day entries — setups must have defined technical compression and short-term catalysts.

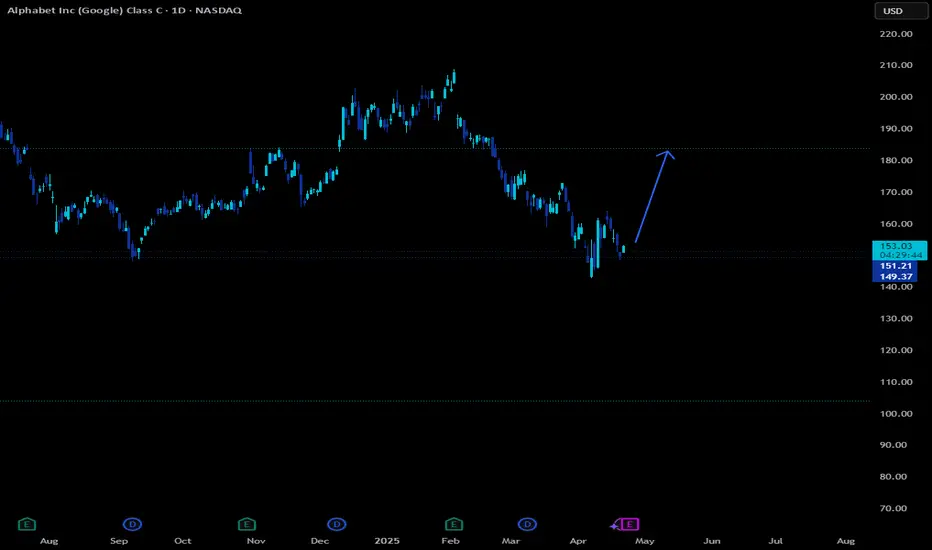
Google Long Swing Tradewant to see us hold this yearly level to test the monthly shoulder. Would get out if we start breaking down here.
$1 to $7 in minutes +488% vertical $MBIO$1 to $7 in minutes 🚀🤑
Week barely started, already sitting on +30% realized profit from 3 sniper trades NASDAQ:MBIO 2x and NYSE:WOLF

$ZM Bullish Setup — VolanX DSS ProjectionZoom ( NASDAQ:ZM ) has broken above structure with momentum and now retracing to equilibrium zones.
📈 Projected Wave Structure:
Targeting $88.35 (Fib 0.382 + SMC Premium Zone)
Potential pullbacks to $80.42 / $78.60 before continuation
Strong volume at lows signals accumulation
Liquidity sweep under CHoCH confirmed breakout leg
🔍 Key Levels:
⚡ Bullish re-entry: $77.50–$78.00 (Discount range)
🎯 Mid targets: $83.60 / $85.82
🚀 Final target zone: $88.35
📅 Timeline: Now through July 22nd, 2025
🔐 DSS + SMC alignment confirms this as a high-probability wave forecast
💡 Strategy: Long calls or butterfly lotto up to $85–88
#WaverVanir #VolanX #ZM #OptionsFlow #SmartMoney #TradingView #SMC

ShortifyI don't post all my trade ideas ahead of time but I will share another short position that I executed before posting, this time in Spotify.
Short entered at $770, stop lost at $790.
Added to my position when we lost the monthly level of support.
The end of the 5 Wave Supercycle.
Trailing stop loss, I don't like shorting solid companies but this one got overextended.
I am short several positions, including Palantir, DuoLingo and commodities like cocoa.
Not financial advice, do what's best for you

$SOUN Breakout Setup – Clean Bullish Structure with Strong R/RSoundHound AI ( NASDAQ:SOUN ) is showing a strong technical setup as it pushes above the Ichimoku cloud on the daily chart. Price has been consolidating for over a month in a tight range between $9 and $10.30. Today’s breakout above the cloud with bullish MACD crossover signals potential trend continuation.
Key technicals:
Ichimoku Cloud: Price has closed above the Kumo with Tenkan-sen crossing above Kijun-sen—classic bullish signal.
MACD: Fresh bullish crossover with histogram flipping positive for the first time since mid-May.
Volume: Volume has been increasing on up days, suggesting accumulation.
Trade setup:
Entry: $10.30 (breakout candle)
Stop: $9.05 (below recent consolidation base and cloud)
Target: $13.41 (prior high and R1 pivot level)
Risk/Reward: 2.41
If price holds above $10 and consolidates, it could offer a low-risk add or re-entry zone. Momentum traders may wait for confirmation above $10.55 with volume before committing.
This setup offers both breakout potential and clean invalidation, making it attractive for swing traders and breakout traders alike.

$LYFT Swing Trade – Low-Cost Call Debit Spread Setup🚗 NASDAQ:LYFT Swing Trade – Low-Cost Call Debit Spread Setup (Jul 18 Exp)
📅 Trade Opened: July 3, 2025, 2:53 PM
🛠 Strategy: Buy to Open (BTO) Call Debit Spread
📈 Strikes: $16.5 / $17.5 (Jul 18 Expiration)
💵 Cost (Premium Paid): $0.25
🎯 Trade Thesis
This swing trade targets a short-term bullish move in NASDAQ:LYFT based on improving fundamentals and favorable technical setup. The structure uses a low-cost OTM call spread to define risk and limit exposure while capturing directional potential.
Catalysts supporting the move:
🚙 Autonomous vehicle rollout beginning this summer (Atlanta) and expanding to Dallas (2026) via Mobileye partnership.
🗳 Activist investor Engine Capital pushing for governance changes and strategic alternatives.
💵 Gross bookings at record levels, with net income and free cash flow turning positive.
📈 Analyst upgrade from TD Cowen with a $21 target (+30% upside from entry).
📊 Technical Setup (Daily Chart)
📉 EMA(4) < EMA(8) < EMA(15): Bearish alignment beginning to flatten – potential compression signal.
⚖ VWAP (30‑day): Price consolidating near long-term VWAP – watching for reclaim.
🔄 MACD: Bullish crossover emerging.
📉 RSI: ~36 – approaching oversold territory, setting up possible reversal.
⏳ Strategy Notes
Position type: OTM vertical call debit spread.
Risk defined: Max loss = $0.25 per contract.
Max gain: $0.75 if LYFT closes at or above $17.5 by expiration.
Timeframe: 2-week swing through July 18, ahead of Q2 earnings (~Aug 6).
🧠 Journal Note
This position aligns with a broader strategy focused on OTM spreads priced under $0.25, using technical compressions and fundamental tailwinds. Trade was opened not on an entry signal day - this avoids front-running momentum shifts.

$TSLA hanging by a threadNASDAQ:TSLA getting rocked again today. Gapped down over 7% at open. Literally hanging by a thread on the bottom of the daily cloud. It's also OUTSIDE of the bottom Bollinger band...
Also otm call flow just came in $1.8 million 325c 7/25 @ 6.40

ON Semi is bullish and ready to march forwardNASDAQ:ON price action is bullish, anticipated price action and targets are shown on the chart, stop loss daily close below 20MA.
PS. My view only, not financial advice!

Keysight May Be Attempting a BreakoutKeysight Technologies has been stuck in a range, but some traders may think a breakout is coming.
The first pattern on today’s chart is the $165.89 level. It was the intraday high on February 26 as the broader market began a slide to the downside. The technology stock stalled near the same level in late May, even after a strong quarterly report.
KEYS ended above it on Thursday, July 3. It was the highest weekly close since February. (The stock also formed a bullish outside candle.)
Bollinger Band Width narrowed during the period of limited movement. Could that price compression give way to expansion?
Next, the 8-day exponential moving average (EMA) is above the 21-day EMA. Prices have also found support above the 200-day simple moving average, which is gently rising. Those signals may reflect bullishness in the short- and long-term periods.
Finally, KEYS noted increased demand for its network-testing equipment as data centers grow. Could investors come to view it as an overlooked AI play?
Check out TradingView's The Leap competition sponsored by TradeStation.
TradeStation has, for decades, advanced the trading industry, providing access to stocks, options and futures. If you're born to trade, we could be for you. See our Overview for more.
Past performance, whether actual or indicated by historical tests of strategies, is no guarantee of future performance or success. There is a possibility that you may sustain a loss equal to or greater than your entire investment regardless of which asset class you trade (equities, options or futures); therefore, you should not invest or risk money that you cannot afford to lose. Online trading is not suitable for all investors. View the document titled Characteristics and Risks of Standardized Options at www.TradeStation.com . Before trading any asset class, customers must read the relevant risk disclosure statements on www.TradeStation.com . System access and trade placement and execution may be delayed or fail due to market volatility and volume, quote delays, system and software errors, Internet traffic, outages and other factors.
Securities and futures trading is offered to self-directed customers by TradeStation Securities, Inc., a broker-dealer registered with the Securities and Exchange Commission and a futures commission merchant licensed with the Commodity Futures Trading Commission). TradeStation Securities is a member of the Financial Industry Regulatory Authority, the National Futures Association, and a number of exchanges.
TradeStation Securities, Inc. and TradeStation Technologies, Inc. are each wholly owned subsidiaries of TradeStation Group, Inc., both operating, and providing products and services, under the TradeStation brand and trademark. When applying for, or purchasing, accounts, subscriptions, products and services, it is important that you know which company you will be dealing with. Visit www.TradeStation.com for further important information explaining what this means.

7/2/25 - $corz - Have we forgotten...?7/2/25 :: VROCKSTAR :: NASDAQ:CORZ
Have we forgotten...?
- there's a possible deal happening here
- btc is ripping and so your downside beta is probably somewhat stagnant from the deal bid
- and then you just have natural rip on all energy/ hpc-btc complex stuff beta ripping
- nevermind the actual announcement potential
- bankers like to not work in july and especially august
- so *if* there is a deal here, my guess is it's probably communicated one way or the other sooner v later
- how quickly the market is ready to bid other chitco miners and not the one w/ the most tangible deal potential in the ST
but you do you. keep buying qubt and sym... enjoy
i'll stick to the high signal, better r/r on s/t like this
and for the degen stuff... well i've written about a few others today that are interesting setups far superior to the softbank and retail memes i denote above in this para.
check out $btcs... lmk what u think
but in the meanwhile. i still like this bitcoin beta w/ a deal backstop
V

(WULF) Long position Wulf Long Position. Bouncing off of the mid point of the trend line. 1.75 risk to reward. Put my SL a bit below liquidly in case it wants to wick down to grab the sell orders.

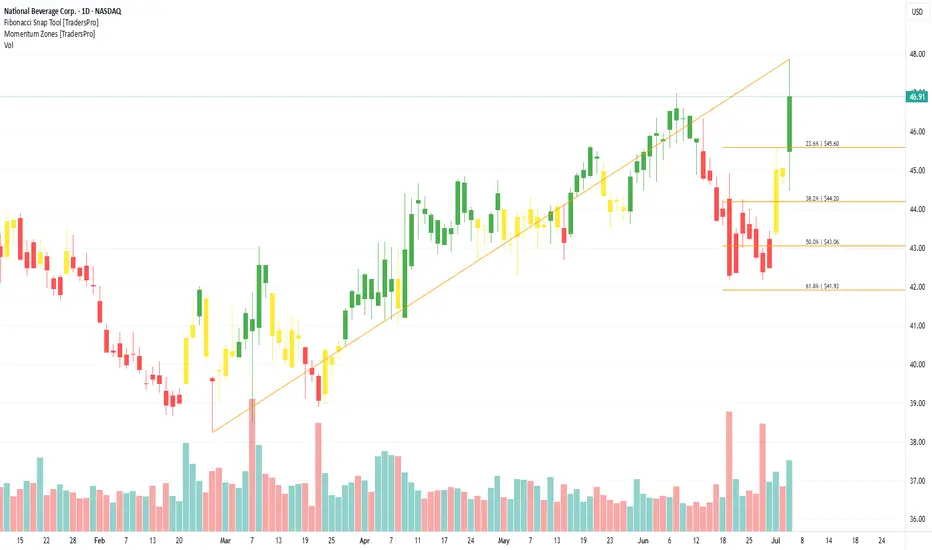
National Beverage Corp. (FIZZ) Grows With LaCroixNational Beverage Corp. (FIZZ) is known for its popular sparkling water and soft drink brands, including LaCroix, Shasta, and Faygo. With a strong focus on healthier, flavor-forward beverages, FIZZ has built a loyal customer base in the growing better-for-you drink category. The company’s growth is driven by rising demand for low-calorie, sugar-free options and its ability to innovate with bold flavors that appeal to health-conscious consumers.
On the chart, a confirmation bar with rising volume points to bullish momentum. The price has moved into the momentum zone by breaking above the .236 Fibonacci level. Traders can set a trailing stop just below that level using the Fibonacci snap tool to lock in gains while staying open to further upside.
(NVDA) Long Pre-Market position off of previous support. Should wick down, grab liquidity then continue upwards.

Intel Falling Wedge on the Weekly Time Frame.If we can hold and get above the 200 EMA on the weekly time frame then we can target the 0.382.
The main target would be the golden pocxket at 0.618.
The target is $50 located at the 0.786.

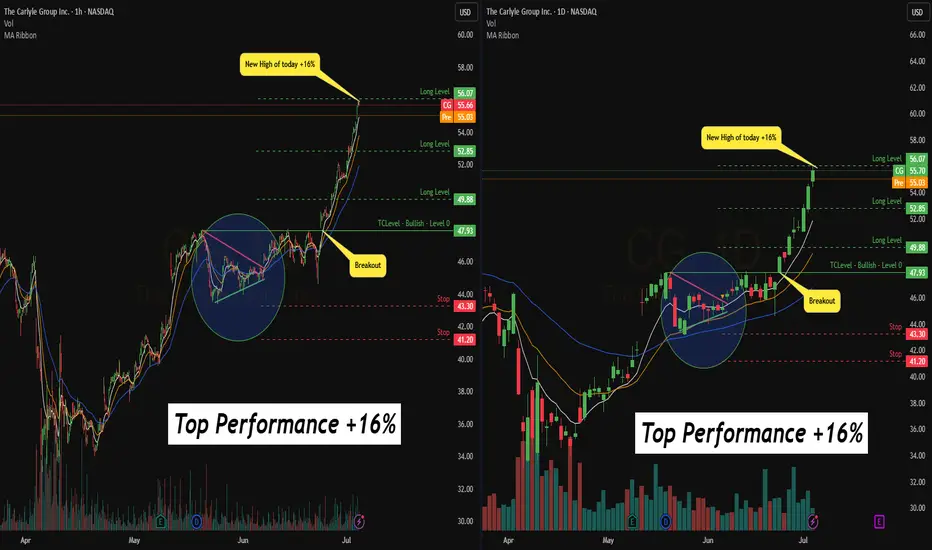
Update on $CG: Amazing run out of our Level 0 following the fast ema 9 and, as last the ema 50.
Huge correction expected here to create a healthy wave.
Quick View: $LYBConsolidation on the Daily chart with increasing volume. Attempt of crossover coming with the hourly chart that is shaking.
