DQ heads up into $19: Major Resistance to book some profitsDQ has been flying off our bottom call (see below).
Now testing a major resistance zone at $18.69-18.99
Good spot to book some profits and look for a dip to buy.
.
Previous analysis that called the BOTTOM:
===================================================
.

Pullback soon and then Rocket launchWe may have a pullback towards mid 20s. I guess this will launch rocket gains next year to hit 90s. Happy trading !! not a financial advice.

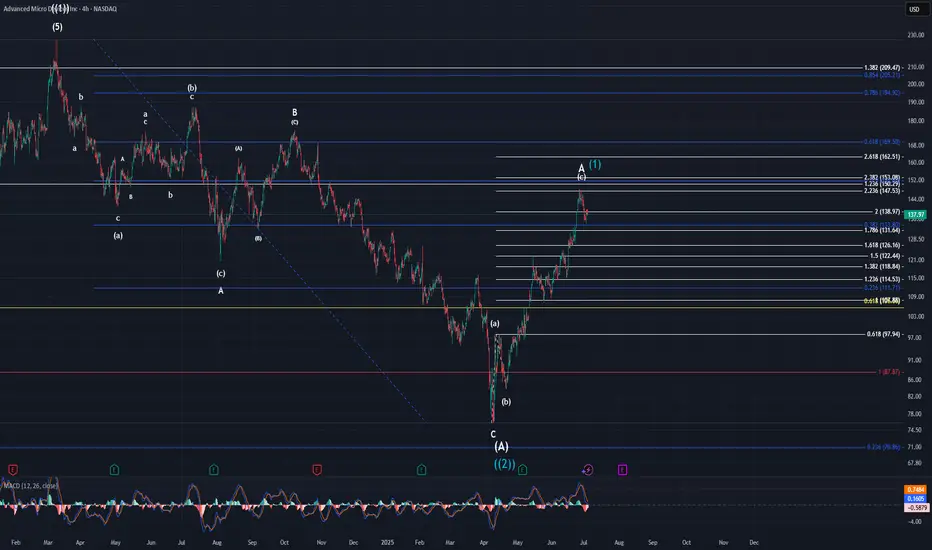
AMD UpdateAs I have mentioned, this move higher is either an extended minor A wave, or it is the beginning of another bull run. I side with the extended A wave due to not only the structure of the chart, but also the broader market as a whole. If this is the case, then price will likely drop to the $100-$110 area to complete minor B. Minor C would ideally take us back up to the $170-$190 area completing intermediate (B). I cannot say how long all of this will take us, but intermediate (A) took 13 months to complete. It would not be a stretch to say we still have 8-10+ months before (B) completes.
Let's just take this one step at a time though. That means we need to watch for price to take us to the low $100's for minor B next.
Apple UpdateThe way this pattern has been moving is very indicative of a B wave. It has been complex and very choppy. Needless to say, I have removed the lower target box from the chart and believe we should be headed to the upper larger target box from here. It appears, to my eyes, that price is within the micro-wave 3 of (c) of B. Once B completes, price should be headed to the $150-$110 area to complete minor wave C. This won't happen overnight but will take time. Be patient as these things can take a while.

BAC – Building the Base for a Breakout?Bank of America (BAC) has been consolidating quietly, attracting attention as it sits near a key mid-range level. With a 52-week low of $33.06 and a 52-week high of $48.08, the stock currently trades around $36.92 – roughly 11% above its low and 23% below its high.
This setup could be the calm before the move.
💥 Technical Outlook & Strategy
With financials holding steady and macro headwinds softening, BAC might offer a solid swing trade or medium-term positioning opportunity.
📌 Entry Points to Watch
$36.90 – Market price, if volume picks up near support
$33.30 – Prior breakout area and potential pullback support
$30.50 – Strong support and near the 52-week low for aggressive buyers
🎯 Target Levels
$39.80 – Short-term resistance; previous rejection zone
$43.50 – Fib retracement from the high, medium-term target
$47.50–48.00 – 52-week high retest, bullish scenario
🧠 Narrative to Watch
With potential Fed pauses on rate hikes, improving margins, and relative stability in U.S. banks, BAC could be positioning for a slow grind higher. Watch for earnings momentum and bond yield trends.
⚠️ Disclaimer
This analysis is for informational and educational purposes only and does not constitute financial advice. Always do your own research or consult with a licensed financial advisor before making trading decisions.

Is Citigroup (C) the Most Undervalued Big Bank Right Now?🔥Let’s talk numbers:
🧮 P/E: 9.78x
💸 P/S: 0.66x
That’s deep value — Wall Street’s sleeping on this one. While everyone's chasing AI, Citigroup is trading at garage sale prices.
🧠 The Setup:
If you're into swing plays with strong R/R and macro upside, C is worth a look.
🔑 Entry Zones: 1️⃣ Market price — for early bulls
2️⃣ $55 — breakout confirmation
3️⃣ $48 — bargain bin steal
🎯 Targets:
TP1: $70 🟢
TP2: $78 🚀
TP3: $84 💰
💬 Why it matters:
Citi has been lagging behind peers like JPM, but it’s still a beast. If the Fed holds or cuts, banks could catch a serious bid — and this one’s ready to pop from a value base.
📌 Watching volume at $55 and any macro shifts as catalysts.
👀 Don’t ignore this one just because it’s not trending. That’s where smart money hides.
📢 Disclaimer:
This is not financial advice. Just sharing ideas and setups I’m watching. Always do your own research and manage your risk.
#Citigroup #C #Undervalu
#Citigroup #C #UndervaluedStocks #SwingTrade #TradingSetup #DeepValue #Banking #PEratio #SmartMoneyMoves #StockMarket #Financials #Watchlist

TSLA – Calm Before the Storm or Just Another Dip Buy?Tesla (TSLA) is trading around $315, bouncing off recent lows, but this isn’t just a clean technical setup. With Elon Musk’s political drama escalating (hello, “America Party”) and ongoing tension with Trump, TSLA is becoming a battleground stock with serious volatility.
As swing traders, that’s exactly where we thrive.
📍 Entry Plan
✅ Entry #1 – $315
✅ Entry #2 – $300
• Previous breakout zone — ideal for dip buyers
✅ Entry #3 – $265
• Strong macro support; only activated if market correction deepens.
🎯 Profit Targets
• TP1: $335
• TP2: $355
• TP3: 400+ – if sentiment + volume align with narrative momentum (think: Robotaxi or AI catalyst)
If $265 gets hit, I’m not panicking, I’m preparing for high-reward setups.
⚠️ Disclaimer: This is not financial advice. I’m just sharing my plan and technical zones. Always do your own research and manage your risk.
📌 Follow for more ideas based on price, narrative, and timing. Trade smart — not loud. 🧭📈

4-Dimensional Investing: Evolving Beyond News, Charts, and Math 📚 4-Dimensional Investing: Evolving Beyond News, Charts, and Math
Most people start learning about stocks in a 1-dimensional way — by following the news.
But news is noisy.
Some is fake, some is "buy the rumor, sell the fact", and sometimes the price moves the opposite of what the news suggests. So, many give up on news and turn to...
📊 2D: Technical Analysis (TA)
TA has been around since the 1980s, when personal computers went mainstream. It's visual and intuitive — charts, lines, indicators. You see price action unfold on-screen and feel like you're deciphering the market in real time.
Some traders even build entire systems off indicators like RSI, MACD, or moving averages. They think:
"Aha! The chart did this, so next time I’ll do that."
But often, "next time" doesn't work the same.
TA is fundamentally historical — it's about pattern recognition and hoping history repeats.
It’s like counting the color of every fallen leaf, trying to predict the next one.
We needed something better. So the institutions turned to…
🧠 3D: Quantitative Modeling
Enter the quants — physicists, mathematicians, engineers. They model the markets like rocket science using multi-dimensional equations. Think LTCM (Long-Term Capital Management), led by Nobel Prize winners.
Quant models are more sophisticated than charts — they simulate human behavior with precision. But there's a problem: humans change.
A model may work… until people start behaving differently.
Markets are not just math. They’re psychology, emotion, fear, greed.
Which brings us to the new frontier…
🤖 4D: AI-Powered, Language-Driven Investing
This is where LLMs (Large Language Models) enter the game.
People often ask me:
“Why use LLMs for trading? Why not traditional ML like LSTM?”
Here’s my answer: Markets are made of humans, and humans communicate through language.
Not numbers. Not charts. Not just price.
Now, with LLMs, we can:
Analyze any human-created document (news, filings, tweets, speeches)
Understand sentiment in real context
Capture nuance — the stuff traditional models miss
LLMs don’t just convert text to numbers. They learn meaning.
This adds a fourth dimension to our trading models: language + reasoning + context + behavior.
Underneath, it’s still powered by classic ML and deep learning. But now the machine can think more like a human — with intuition, memory, and adaptability.
---
🌐 The Future Is 4D Investing
We're not saying this is the final answer to markets. But it’s a major leap forward.
Trading is one of the hardest prediction problems in the world.
And now we have a tool that bridges the gap between math and human behavior.
Welcome to the era of 4D investing —
Where the future of trading is built with language, context, and AI.
Let’s explore it together in 📖qs-academy. 🚀

Long Champion HomesThis is a trend channel of Champion Homes ( NYSE:SKY ). Its a trend channel and lower channel line because of a breakdown.

TSLA : A lot of whipsawingThis has been a very volatile stock to hold. However for those who are bullish on this name long term, I can see this expand and impulse out into a larger 3rd wave. A smaller retracement still fits in this narrative to complete the wave 2 bottom. Let's see how earnings play out.

Higher end consumption has officially broken downThe charts of Lululemon, Louis Vuitton, Restoration Hardware & Target are showing significant signs of weakness as all of them have broken important 3M closing support lows. Regardless of what you hear, these charts show that the high end consumer has been slowing consumption for quite some time and with the June 30, 2025 quarter close all of them have broken below key 3M support zones.
Could we see a break down failure this quarter in which these charts reverse directions and go UP? Only time will tell but if they don't watch out below as the next areas of major support for some of these charts are much lower.
Although all of these are very strong companies with strong balance sheets, I will not go long these charts until I see confirmation of a breakdown failure and a 3M closing above the key support areas.

7/3/25 - NOAH: new SELL mechanical trading signal.7/3/25 - NOAH: new SELL signal chosen by a rules based, mechanical trading system.
NOAH - SELL SHORT
Stop Loss @ 12.59
Entry SELL SHORT @ 11.25
Target Profit @ 9.13
Analysis:
Higher timeframe: Prices have stayed below the upper channel line of the ATR (Average True Range) Keltner Channel and reversed.
Higher timeframe: Victor Sperandeo's (Trader Vic) classic 1-2-3/2B SELL pattern...where the current highest top breakout price is less or only slightly peaking higher than the preceding top price.

$MELI: Long term trend activeThe dominant e-commerce and fintech player in Latin America, MercadoLibre, has demonstrated robust growth in the first quarter of 2025.
With a significant increase in gross merchandise volume and total payment volume, the company is capitalizing on the region's digital transformation.
Key metrics to watch include user growth on its platform and the performance of its credit and asset management services.
Time at mode and valuation analysis paint a solid picture here, with ample relative strength against the broad market in all timeframes overall as well.
Best of luck!
Cheers,
Ivan Labrie.

NVIDIA NVIDIA (NVDA) CORP IS LEADING IN AI CHIPS
NVIDIA closed the week in a massive green candle at $159.34 , marking a new all-time high.
NVIDIA’s market capitalization is approximately $3.89 trillion, making it the world’s most valuable publicly traded company as of July 2025.
Financial Performance
Q1 Fiscal 2026 (ended April 27, 2025):
Revenue: $44.1 billion (up 12% quarter-over-quarter, up 69% year-over-year)
GAAP EPS: $0.76; Non-GAAP EPS: $0.81
Gross Margin: 60.5% (61.0% non-GAAP), impacted by a $4.5 billion charge related to US export restrictions to China
Fiscal 2025 (ended January 2025):
Revenue: $130.5 billion (up 114% year-over-year)
GAAP EPS: $2.94 (up 147% year-over-year)
Non-GAAP EPS: $2.99 (up 130% year-over-year)
Business Highlights
AI and Data Center Leadership:
NVIDIA’s explosive growth is driven by surging demand for its AI chips, especially in data centers. The company’s Hopper and Blackwell GPU platforms are in high demand, with Blackwell samples now shipping to partners and customers.
Robotics and Automotive Expansion:
Robotics is emerging as a major growth area. NVIDIA’s robotics and automotive division generated $1.7 billion in revenue last year, with projections to exceed $7.5 billion by the early 2030s. The company recently unveiled the AEON humanoid robot and continues to invest in platforms for autonomous vehicles and industrial automation.
Product Innovation:
At Computex 2025, NVIDIA announced new AI infrastructure technologies, including NVLink Fusion and the Isaac GR00T-Dreams platform for robotics. The company is also expanding into custom AI server solutions and ARM-based CPUs for PCs and servers.
NVIDIA remains moderately bullish, the Bullish scenarios/probability could potentially reclaim $200–$250 per share in 2025 if AI demand accelerates and China market headwinds ease.
Growth Drivers:
Continued AI adoption across industries
Expansion in robotics, automotive, and cloud infrastructure
Strategic partnerships and global supply chain investments
Recent News
Market Leadership:
NVIDIA briefly surpassed Microsoft and Apple to become the most valuable company in history, with a market cap nearing $3.92 trillion.
Dividend:
The next quarterly cash dividend of $0.01 per share was paid on July 3, 2025.
Summary Table
Metric Value (July 2025)
Stock Price $159.34
Market Cap $3.89 trillion
Q1 FY26 Revenue $44.1 billion
Q1 FY26 EPS $0.76 (GAAP), $0.81 (non-GAAP)
Fiscal 2025 Revenue $130.5 billion
Fiscal 2025 EPS $2.94 (GAAP), $2.99 (non-GAAP)
Dividend (Quarterly) $0.01/share
NVIDIA remains the global leader in AI and accelerated computing, with record financial results, a dominant market position, and ambitious expansion into robotics and next-generation computing platforms.
#NVIDIA #AI #STOCKS

$NASDAQ:INSGNASDAQ:INSG
The stock moved in an impulse wave
Now in the fourth wave
A triangle is expected
We watch

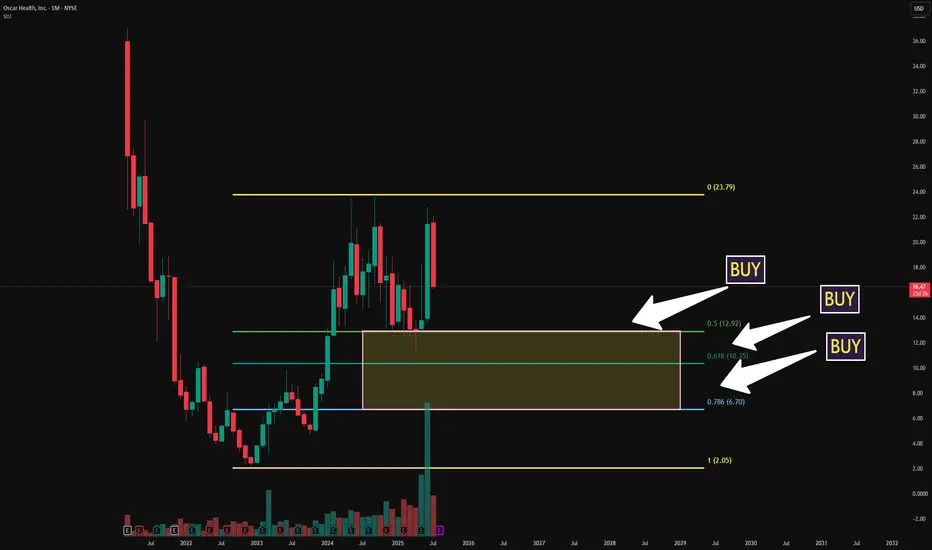
$OSCR ONCE IN A LIFETIME Fibonacci Pyramid Long Term PlanNYSE:OSCR ONCE IN A LIFETIME Fibonacci Pyramid Long Term Plan
Buys: 12.92 10.35 6.70 Target 30🎯
When I posted these pull backs people thought I was crazy now be ready
I plan to LAYER OPTIONS and SHARES
Drop a LIKE if ur DOWN!
IBM: SHA-ttering ExpectationsAs we move through 2024, NYSE:IBM continues to demonstrate its strength as a technology powerhouse, particularly in cloud computing, AI, and cybersecurity. With a legacy rooted in innovation, IBM's deep history in encryption technologies and its forward-looking strategies make it a compelling buy for investors aiming to capitalize on the next wave of tech advancements.
Financial Performance:
Revenue Growth: IBM reported a 5% year-over-year increase in revenue for Q2 2024, driven primarily by its hybrid cloud and AI segments, which saw a combined growth of 12%.
Earnings Beat: The company beat analyst expectations with an EPS of $3.15, outperforming the consensus estimate of $2.98. This marks IBM’s fourth consecutive quarter of earnings beats, underscoring its operational efficiency and strong market positioning.
Cash Flow: IBM’s free cash flow improved to $9.5 billion for the first half of 2024, reflecting a 7% increase compared to the same period last year, providing ample liquidity for continued investment in innovation and shareholder returns.
Quantum Computing and AI Leadership:
Quantum Breakthroughs: In 2024, IBM announced a significant breakthrough in quantum computing with its 127-qubit 'Eagle' processor, which is expected to accelerate quantum application developments in fields such as cryptography, materials science, and financial modeling.
AI Advancements: IBM’s AI platform, WatsonX, continues to gain traction in the enterprise space, with a 15% increase in new customer adoption in 2024. The platform’s integration with IBM’s hybrid cloud solutions positions it as a leader in the AI-driven transformation of industries.
Acquisitions: IBM’s strategic acquisition of ReaQta in late 2023 is already paying dividends in 2024. This cybersecurity firm enhances IBM’s X-Force Threat Management services, making IBM a more formidable player in the fast-growing cybersecurity market.
Partnerships: The expansion of IBM’s partnership with SAP in 2024 is set to deliver joint cloud and AI solutions that address the needs of global enterprises, further cementing IBM’s role as a key technology enabler.
Technical Potential:
Stock Performance: As of August 2024, IBM’s stock is trading at $190 per share, up 25% year-to-date, but still trading at a forward P/E ratio of 12.5x, which is below the industry average. This suggests the stock is undervalued relative to its peers, providing a buying opportunity.
Price Target: Analysts are bullish on IBM’s growth prospects, with a consensus price target of $250, representing a potential upside over the next 12 months. This target is supported by expected continued growth in IBM’s high-margin cloud and AI businesses.
Dividend Yield: IBM continues to offer a robust dividend yield of 4.7%, providing an attractive income stream while investors wait for the company’s growth initiatives to further drive stock price appreciation.
- Q3 2024 Earnings: October 23, 2024 (preliminary)
- Q4 2024 Earnings: January 22, 2025 (measurable)
Did IBM develop Bitcoin? Goodluck.
$194.75 NYSE:IBM

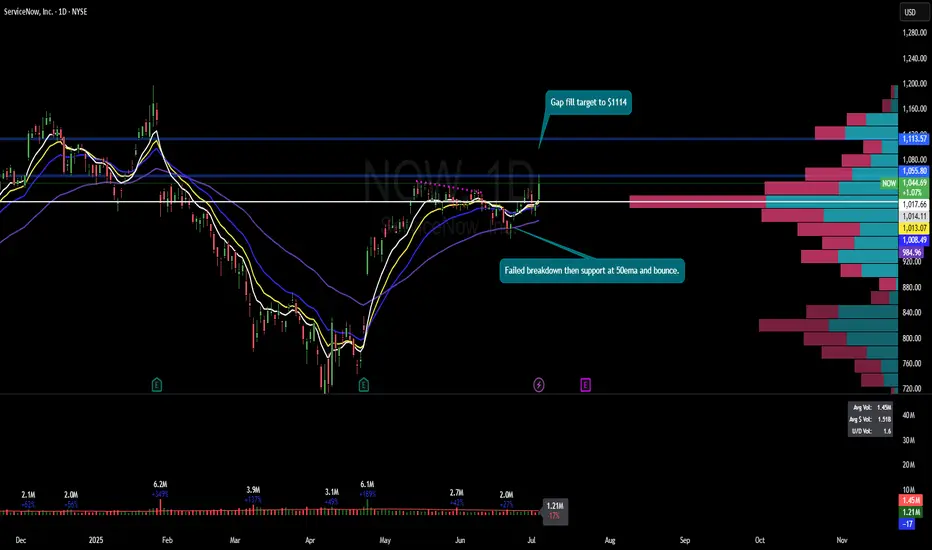
$NOW $1114 pt?NYSE:NOW had failed breakdown then bounce at 50ema on daily and it had recaptured 8ema and 21ema on daily. Gap fill target remains to $1114.
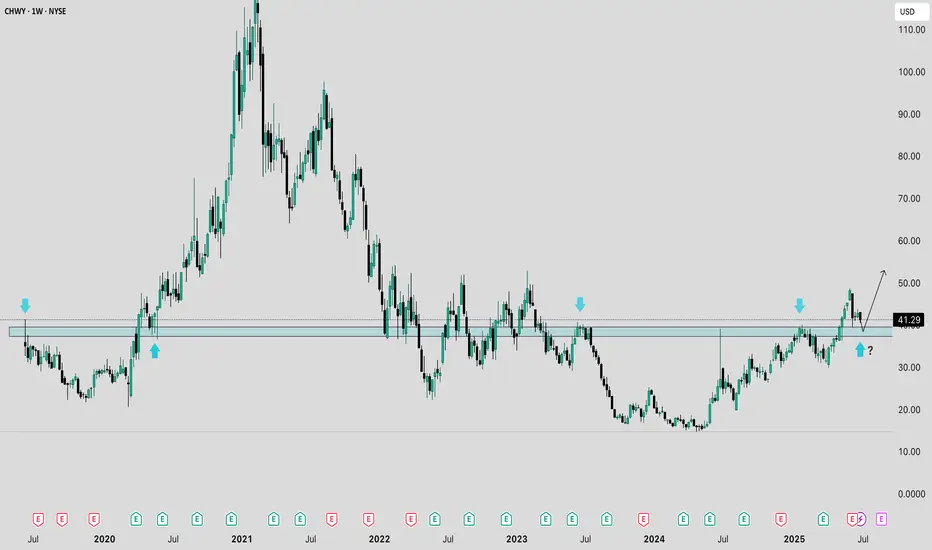
Can $CHWY momentum continue?NYSE:CHWY is pulling back to a potential flip zone after a significant move up. If the price holds this zone, it may see the next leg higher.
NVDA Support and Resistance Lines Valid from July 1 to 31st 2025Overview:
These purple lines act as Support and resistance lines when the price moves into these lines from the bottom or the top direction. Based on the direction of the price movement, one can take long or short entries.
Trading Timeframes
I usually use 30min candlesticks to swing trade options by holding 2-3 days max. Anyone can also use 3hr or 4hrs to do 2 weeks max swing trades for massive up or down movements.
I post these 1st week of every month and they are valid till the end of the month.

$MSTR ONCE IN A LIFETIMEINSIDE MONTH BREAKOUT is here
Long above 417 targeting 500+
LOW RISK setup HIGH REWARD potential I will alert ALL HERE NO CHARGE all I ask is DROP A LIKE

Rivian seems bottomed outTrump proposes 25 % tariffs on all imported vehicles and parts, plus a tax deduction for interest on loans for U.S.-made cars.

Apple Is Climbing the Fibonacci Channel Ladder – Step 5 Ahead?On the monthly chart, Apple (AAPL) is steadily moving within a well-defined ascending Fibonacci channel, like climbing a ladder — step by step.
The price is currently testing Step 4 , a zone that has acted as a strong resistance barrier.
Despite the pressure here, the structure still appears bullish, and even a minor pullback might simply be a pause before the next move.
If momentum picks up, we could soon see a breakout toward the next step — targeting 234 at Step 5.
The trend remains technically intact unless the channel is broken, and the overall formation still leans toward continuation.
