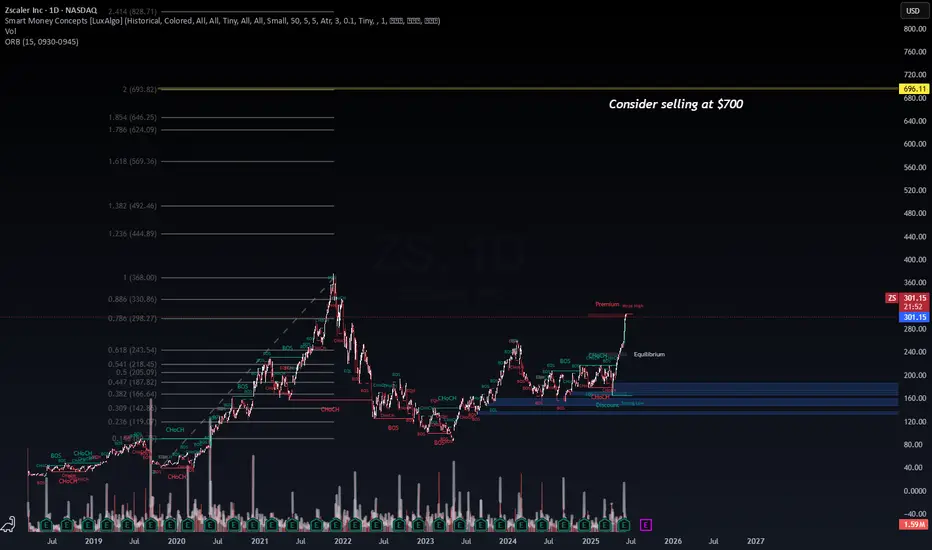
Zscaler Inc. (ZS) – Multi-Year Breakout with Target at $700📅 1D Chart | Smart Money Concepts | Fibonacci Extensions | Volume Profile
Price: $301.19 | Volume: 1.59M
ZS has officially broken through its prior consolidation structure and is now trading firmly in premium territory. With the 0.786 Fib level at $298.27 now reclaimed, momentum traders are eyeing a run toward higher extensions.
🔍 Key Technical Zones:
✅ Breakout Confirmed: Structure shifted after reclaiming $250–$275
🟨 Premium Zone Begins: $300+
📈 Major Fib Extensions:
1.236: $444.89
1.618: $569.36
2.0: $693.82
🟡 Suggested Exit Zone: ~$696–700 (historical extension confluence)
🧠 Smart Money Context:
Clean Break of Structure (BOS) after a long accumulation phase
Volume supports breakout behavior
Weekly CHoCH + BOS align with institutional positioning
Little resistance until the $440–700 range based on past structure gaps
💡 Trade Plan (Probabilistic):
Upside Continuation (70%): Strong bullish conviction, targeting $444 then $569
Pullback Re-entry (30%): Retest of breakout near $270–$298 may offer a second-chance entry
🛡 Risk Management:
Entry: Current levels or on pullback to $298
TP1: $444
TP2: $569
TP3: $696–700 (consider reducing exposure)
SL: Close below $280 (invalidates breakout thesis)
📌 Conclusion:
ZS is in an extended markup phase. As long as macro conditions remain favorable, a long ride toward $700 is technically plausible. Watch volume and institutional behavior closely as we climb into uncharted premium zones.
#ZS #Zscaler #BreakoutStocks #Fibonacci #SmartMoneyConcepts #TechnicalAnalysis #PremiumZone #TradingView #EquityMomentum
DELL eyes on $116.10: Golden Genesis fib will determine TrendDELL has been a sleepy stock with mixed earnings.
Now testing a proven Golden Genesis at $116.01
Look for a Break-and-Retest to start an Uptrend.
.
See "Related Publications" for other plots ---------------------->>>>>>>
This one in particular is caught the BOTTOM exaclty:
===================================================
.

WC: 29.58 Target: 1800-2400 MOASS: 47k-100K: Week Of 06/09Ok this is my last video on Gamestop
You will see less frequent posts going forward and they will be at the MACRO level and focused almost exclusively on the daily charts
Its been a ride covering this over the past year or so
True to my posting intention (I'm only here to help people trade better) this video is educational in nature
Its not hopium fueled at all...this is me, one last time...TEACHING YOU HOW TO FISH
First half of the video is setting your charts up for the squeeze
Second half of the video is showing you some new stuff around the 20 Week Cycle that you havent seen before
But yeah..no hype...just TA and some rambling..because as my Tagline on my X profile says i'm:
"Just a guy who likes to draw Elliott Waves on stock charts and ramble on about markets."
GOOD TRADING TO YOU ALL...SEE YOU ON THE OTHER SIDE!

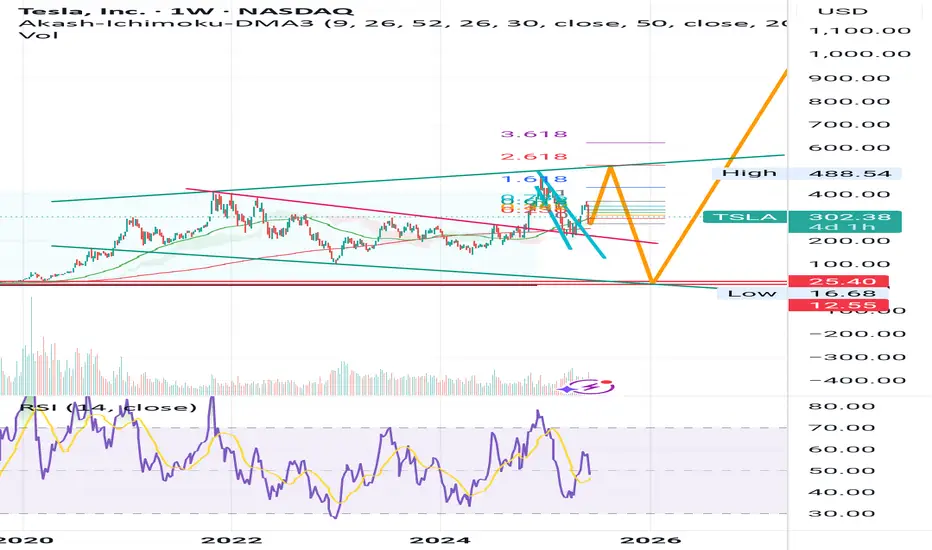
TSLA road to $526... to $10... to da mooo00nHaters gonna hate, but these patterns need to complete, nevermind most of the holders bought in at 10 usd, and that's where the support is.
Not financial advice, not funancial either badum tss
$CCJ - short Been following this stock a long time. It follows the megaphone pattern for a significant amount of time, now. Played the long, now it's time for the short. Will it continue to honor the pattern?

FUTU SL hitLoss Taken on NASDAQ:FUTU – SL Hit 📉
Stopped out on my FUTU trade today. It’s part of the game — we’re not always going to be right. What matters most is how we respond.
👉 Took the loss.
👉 Reviewed the setup.
👉 Learning and improving with every trade.
Losing trades are just part of the cost of doing business. Stick to the process, follow your rules, and growth will follow. 💪
#FUTU #TradingLoss #StopLossHit #TradingMindset #LearnAndImprove #TradeSmart #TraderLife #DisciplineOverEmotion #RiskManagement

Potential ABCD patternStrong upside right now because of news that the CFO bought shares.
There is a potential ABCD pattern and fundamentally I think with the trump administration green hydrogen will have a few hard years, there are funding cuts for hydrogen project and more emphasis on oil and gas.

PLTR SL hitLoss Locked on NASDAQ:PLTR — Part of the Game 💸
I closed out a position on Palantir today for a loss. Why?
I listened to a gut feeling that the broader market was about to roll over… but it never did. The market proved me wrong, and I paid the price. That’s trading.
Key takeaway:
Stick to the plan, not the gut. Emotions can’t beat a well-tested strategy.
Losses are tuition. Review the trade, log the lesson, and keep grinding forward. On to the next setup. 💪
#PLTR #TradingJourney #LossesAreLessons #TraderMindset #StickToThePlan #RiskManagement #KeepGrinding #DisciplineOverEmotion

Plug Prints a Smile Face. Up 70%Plug Power - an Electrolyser Company has burnt Investors Capital to Date.
The initial idea was to use renewable Energy to convert pure water to Oxygen and Hydrogen using Electrolysis.
Initially the market got Sold on this Idea, and the stock was over bought.
But the market came back to reality in that you never get more out than you put in, and there was a TANK.
However, just IMO, the end use of H2 if made efficiently can be a viable use when generated by Solar or other means.
Whilst early for now, this one can still offer a further X3 from here but will remain speculative.
Only the Brave get Rewarded.

IBM heads up at $273: Serious Resistance may give a Dip-to-Buy IBM has been flying to new All Time Highs (finally)
Now testing a serious resistance at $272.98-273.65
It may need to retest support zone $267.46-267.86
.
Previous Analysis that caught the EXACT BOTTOM:
Hit the BOOST and FOLLOW to encourage more such PRECISE ideas.
==========================================================
.

Buying opportunity for COINSince the news on May 13, COIN has slumped with the rest of the crypto market. It appears to be consolidating and has shown promise since the large drop last Thursday. With Bitcoin appearing to approach the highs once again after retracing to the 0.3 level, there is a good chance COIN may reach the 350 level or beyond in the near future.

#META - 80 POINTS MOVE ON RADAR | $740 OR $554 ?Date: 19-05-2025
#META
Current Price: 640.34
Mid-Point: 647.57
Upside Targets: 682.50, 700.81, 720.78 and 740.74
Downside Targets: 612.71, 594.33, 574.37 and 554.40
Support: 631.09
Resistance: 664.18
#METAChartAnalysis
#METAChartPatterns

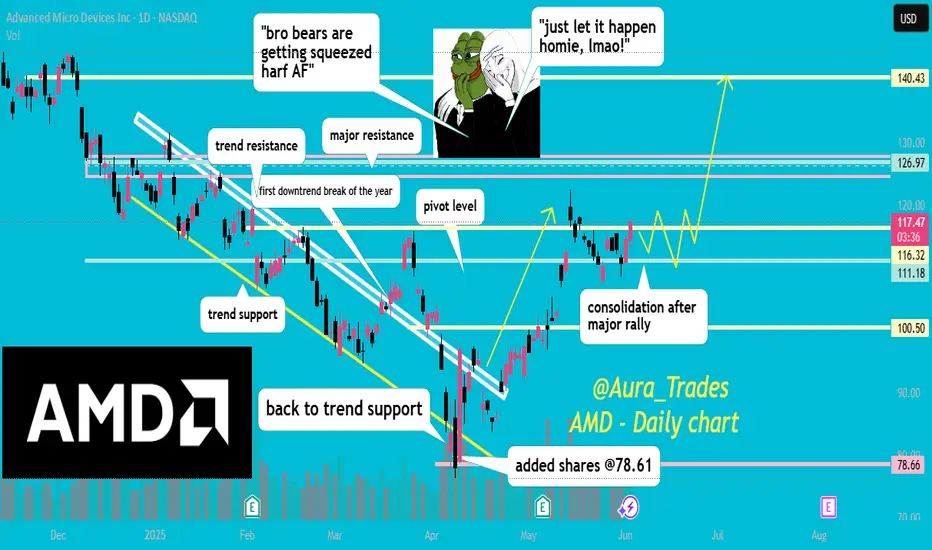
guess whos back? ;) boost and follow for more! 💖 congrats to anyone else who got AMD around 80, massive short trap below trend support and we finally got a break of trend resistance that has held!
I expect a bit of consolidation or maybe even a bit of profit taking, but after thats done a push higher to 126-140 will follow in my opinion.
side note: sorry for being so inactive this year, I've been going through a lot.. but I will try to post more often :)
keep an eye on 144.80 !boost and follow for more!💖
NVDA is hitting my bullish targets a mentioned in my last update from early April🎯, now watching my final short term price target of 144.80, if this can break and hold this week then a rally to new ATH/175-200 should follow.
if we reject here then a dip to 124-132 should come before the upside continues.

UPS eyes on $98.xx: Double Golden fib zone KEY to End DownTrendUPS feels to have been dropping forever because it HAS :(
Currently testing Double Golden fib zone at $98.38-98.99
Hoping for consolidation in the zone then a big break out.

Digital Turbine inc Ending Diagonal wave, Target prices zone between 6.12$ - 6.30$
Technically has to reach that Zone by Tomorrow.
Stock is a High Ranking by Nasdaq.
Highly recommended for Buying now from present level 👌

CCJ eyes on $45.37: semi-major Fib may dip to $42 for long entryCCJ trying to recover from the nuclear bubble burst.
Currently testing a semi-major Covid fib at $43.37
If it dips then watch the support zone $42.31-42.91

OKLO - ShortChart pattern : double top testing the neckline at $~49.5
Enter Put when it rejects the neck line at $48
Stoploss at ~$50.2
PT1 :~$42.85
PT2: ~$38.25
PT3: ~33.11 - possible PT because it might finish at PT2. considering taking profit at PT2.
Period to reach PT is 1-2 weeks.

Tesla - Short Term Chart, Bullish BreakoutTesla is surging after a significant pullback. Could this be a turning point? I'm optimistic about Tesla's long-term potential and have been holding for the long haul, anticipating new highs in the future.

Eli Lillly $LLYNYSE:LLY – Long Setup Ahead of June FOMC
Eli Lilly remains fundamentally strong, with robust growth in revenue (+45% YoY), driven by weight-loss and diabetes drugs like Mounjaro and Zepbound. Despite this, the stock saw a recent pullback after a lowered FY25 profit outlook.
Technical View:
LLY is trading near a key support zone around $710. The setup offers a favorable 1:5 risk/reward ratio, with a stop at $700.86 and a target near $768. Bollinger Bands are tightening, indicating a potential breakout.
This decline could be partially driven by market caution ahead of the upcoming FOMC meeting in June. If support holds, we may see a bounce toward the $760–770 area.
Plan:
Entry: ~$710
Target: ~$768
Stop: ~$700.86
Risk/Reward: 1:5
Watching price action closely near the lower Bollinger band.

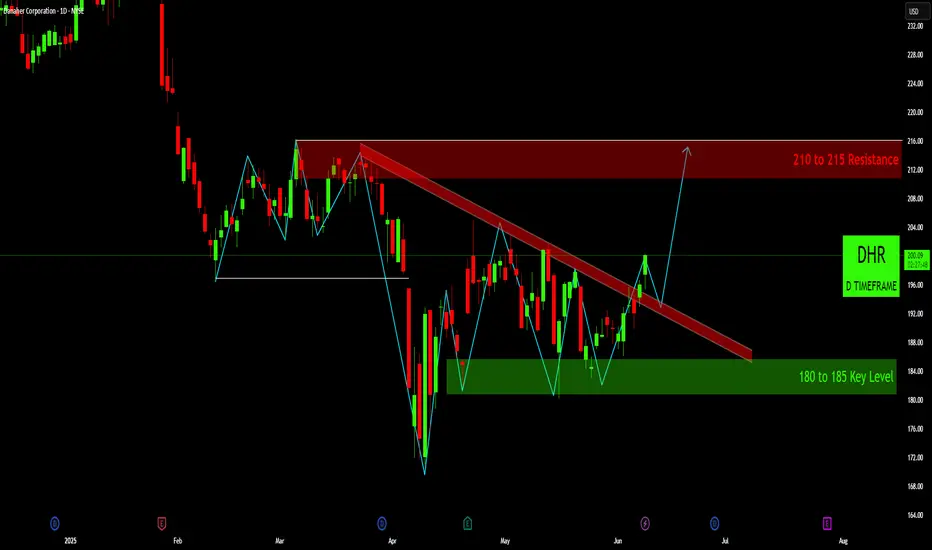
DHR: Bullish Breakout from Descending TrendlineOverview: Danaher Corporation (DHR) on the daily chart appears to have undergone a significant bearish pattern followed by a period of consolidation. The recent price action suggests a potential bullish reversal, as the stock has now broken above a key descending trendline, signaling a shift in momentum.
Context & Price History:
Prior Topping Pattern: From roughly February to April, DHR exhibited classic signs of a topping formation. The price repeatedly failed to break above the 210 to 215 Resistance zone (red shaded area), indicating strong supply in this region. The price action leading to the sharp April decline could be interpreted as a Head and Shoulders pattern or a triple top, with the white horizontal line around 196- 197 acting as a critical "neckline" or support level.
Sharp Decline & Key Support: Following the breakdown from the neckline in April, DHR experienced a significant sell-off, finding strong demand and bottoming out within the 180 to 185 Key Level support zone (green shaded area). This zone has proven to be a robust area of buyer interest.
Consolidation & Descending Trend: Since the April lows, DHR has been trading within a range, largely constrained by a descending trendline (thick red diagonal line) acting as dynamic resistance, while finding support at the 180-185 key level. This price action formed a descending triangle or wedge-like pattern.
Key Levels & Patterns:
Major Resistance (210 to 215): A strong supply zone where sellers have repeatedly stepped in. This will be the primary upside target if the current bullish momentum sustains.
Key Support (180 to 185): A critical demand zone that has held up well, providing a strong foundation for the recent recovery.
Descending Trendline (Red): This dynamic resistance has capped rallies since March/April. A decisive break above it is a bullish signal.
Pivotal Level (~196-197, White Line): This level acted as prior support (neckline) before the April drop. Now, it serves as a minor horizontal resistance that the price has recently overcome, potentially flipping to support on a retest.
Current Situation (As of Analysis):
DHR is currently trading around $200. Critically, the price has made a strong move above the long-standing descending trendline. This breakout suggests that bullish sentiment is gaining control after a prolonged period of consolidation.
Potential Scenarios:
Bullish Continuation (Primary Indication on Chart):
Confirmation: The chart's projection anticipates a retest of the broken descending trendline (which now acts as support) or the ~
196=197 pivotal level, followed by a bounce and continuation higher.
First Target: Upon a successful retest and bounce, the immediate target for buyers would be the 210 to 215 Resistance zone.
Why: A confirmed breakout from a multi-month descending trendline, especially after holding strong key support, is a strong bullish reversal signal.
Bearish Rejection / Fakeout:
Confirmation: If DHR fails to hold above the broken descending trendline and closes convincingly back below it (and potentially below the ~196-197 level), it would suggest that the breakout was a "fakeout."
Downside Potential: In such a scenario, the price could re-enter the consolidation range and potentially retest the 180 to 185 Key Level.
Confirmation & Invalidations:
Bullish Confirmation: A successful retest of the descending trendline (now support) with a clear bounce, or a sustained daily close above the ~196-197 level, preferably with increasing volume.
Invalidation of Bullish Setup: A decisive daily close back below the descending trendline and the ~ 196-197 pivotal level would suggest that the bullish momentum has faltered and the current breakout might be false.
Conclusion:
DHR has presented a compelling technical setup with a breakout from a significant descending trendline. This breakout, combined with the stock holding firm at the 180-185 key support, suggests a potential shift in trend from bearish consolidation to a renewed bullish advance. Traders should look for confirmation of the breakout (e.g., a successful retest and bounce) before targeting the 210-215 resistance zone.
Disclaimer:
The information provided in this chart is for educational and informational purposes only and should not be considered as investment advice. Trading and investing involve substantial risk and are not suitable for every investor. You should carefully consider your financial situation and consult with a financial advisor before making any investment decisions. The creator of this chart does not guarantee any specific outcome or profit and is not responsible for any losses incurred as a result of using this information. Past performance is not indicative of future results. Use this information at your own risk. This chart has been created for my own improvement in Trading and Investment Analysis. Please do your own analysis before any investments.
$ELV, Long, TP>10-15%NYSE:ELV , Long, TP>10-15%
Fundamentally the stock is good.
Choose an entry point and do not forget about a protective order if you are trading with leverage.
Don't risk it if you're not sure.
Good luck to everyone.

McDonald (MCD): Near Critical Trendline Support Overview: McDonald's (MCD) on the daily chart has been consolidating within a broad range after a significant uptrend. The stock is currently trading at a pivotal point, testing a long-standing ascending trendline that has supported its bullish movement. Bearish pressure is evident from repeated rejections at a key resistance zone, suggesting a potential shift in market sentiment.
Context & Price History:
Ascending Trend: From approximately July 2024, MCD embarked on a strong uptrend, consistently finding support along the depicted blue ascending trendline. This indicates underlying bullish momentum and buyers stepping in on dips.
Major Resistance Zone (317 - 323): Since late 2024, MCD has repeatedly faced strong selling pressure in the 317 to 323 range, labeled as "320". This area has acted as a formidable ceiling, preventing further upward progression. We can observe what appears to be a multi-peak formation (potentially a triple top) at this resistance, a classic bearish reversal pattern.
Consolidation: Following the initial uptrend, the price action has entered a consolidation phase, oscillating between the "320" resistance and the rising trendline support.
Key Levels & Patterns:
Ascending Trendline (Blue Line): This is the primary support for the current market structure. A break below this line would signal a significant shift in the trend.
Major Resistance Zone (Red Shaded Area): Strong supply zone between $317 and $323. Multiple rejections here indicate significant selling interest.
Immediate Support Zone (Green Shaded Area): Around $290, this level represents the next key horizontal support below the trendline.
Key Level Support (Deep Green Shaded Area): A broader support range between $270 and $280. This area could provide strong demand if the stock experiences a deeper correction.
Minor Resistance/Bounce Point (Labelled 310): While not a strong horizontal support currently, the "310" label aligns with potential prior horizontal action and is shown as a retest point in the projected bearish scenario.
Current Situation: MCD is currently trading around $303.21. It has seen a sharp decline from the 317-323 resistance zone and is now directly approaching the confluence of the ascending trendline and recent lows. The highlighted blue circle indicates this critical area.
Potential Scenarios:
Bearish Breakdown (Primary Indication on Chart):
Breakdown Confirmation: If MCD fails to hold the ascending trendline support and closes convincingly below it (e.g., below $300), especially with increased volume, it would confirm a bearish breakdown.
First Target: The immediate target for bears would be the $290 horizontal support zone.
Second Target: If 290 fails to hold, the price could then move lower towards 270 to $280.
Bullish Reversal / Trendline Hold:
Reversal Confirmation: If MCD finds strong buying pressure at the current trendline support, we could see a bullish reversal candlestick pattern (e.g., a hammer, bullish engulfing, or morning star).
Upside Potential: A successful bounce could lead to a retest of prior minor resistance around the
310 and then towards 320
Trend Continuation: A decisive break above the $323 resistance would invalidate the current bearish pressure and signal a continuation of the broader uptrend.
Conclusion:
MCD is at a crucial juncture. The repeated rejections at the 317-323 resistance zone and the current approach to the ascending trendline indicate a potential for a significant directional move. Traders should closely monitor price action around the trendline. A break below opens the door for a move to 290 and potentially 270-280, while a strong bounce could see a retest of the higher resistance levels.
Disclaimer:
The information provided in this chart is for educational and informational purposes only and should not be considered as investment advice. Trading and investing involve substantial risk and are not suitable for every investor. You should carefully consider your financial situation and consult with a financial advisor before making any investment decisions. The creator of this chart does not guarantee any specific outcome or profit and is not responsible for any losses incurred as a result of using this information. Past performance is not indicative of future results. Use this information at your own risk. This chart has been created for my own improvement in Trading and Investment Analysis. Please do your own analysis before any investments.
