POWL energy expansion playPowl I just discovered and after reviewing the chart it looks very bullish. I have also reviewed the company website and fundamentals both look great. They have expanding margins and earnings this is likely to tariff related backlogs of electrical switchboards and other products. Given that Powell Energy is American made, this is a tailwind for them. Energy expansion is currently my number one thesis, followed closely by a secular Ai like wave in robotics. I am looking at this play for a near-term 300$ target.
My plan:
I need to research more, but might get my foot wet with a few shares and some CSP

TsmEdged up to the top of resistance here.
Expecting a correction back to 176-185 area here
1hour chart
Here's the uptrend since april..
The support would now be around 227.
I expect a pullback to that area this week and if support holds price could bounce back and tag weekly resistance around 240 but I don't think price will linger long above 230. A correction is coming for tsm

UBER long-term gemOn the monthly chart, Uber broke out from a massive ascending triangle and successfully retested the upper resistance, flipping it into support. You’re not ready for what’s coming!

NVIDIANVIDIA is due for correction, anytime it can start. This week probably would be a good week to start the correction.
Disclosure: We are part of Trade Nation's Influencer program and receive a monthly fee for using their TradingView charts in our analysis.

NVDA, AMZN, META AND NFLX 4HS CHARTNASDAQ:NVDA SUP: 157 | RES: 159.7 – Triangle forming.
NASDAQ:AMZN SUP: 220 | RES: 224 – Compression zone.
NASDAQ:META SUP: 700 | RES: 739 – Needs reclaim to recover.
NASDAQ:NFLX SUP: 1279 | RES: 1302 – Bullish dip hold.
#trading #stocks #technicalanalysis #optionsflow #NVDA #AMZN #META #NFLX

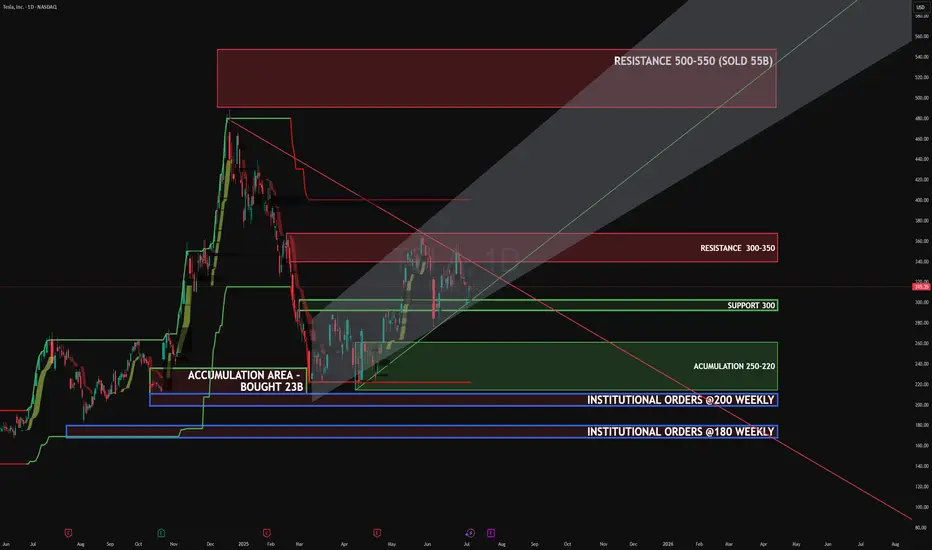
TeslaTSLA
Compression forming inside rising channel
Symmetrical triangle = explosive breakout setup
SUP: 300 / 250–220 (institutions bought $23B)
RES: 350 / 500
Target: 500
#TSLA #Tesla #Breakout #Stocks #Trading #OptionsFlow #PriceAction
APPLE Massive Short! SELL!
My dear friends,
Please, find my technical outlook for APPLE below:
The instrument tests an important psychological level 213.58
Bias - Bearish
Technical Indicators: Supper Trend gives a precise Bearish signal, while Pivot Point HL predicts price changes and potential reversals in the market.
Target - 208.03
About Used Indicators:
Super-trend indicator is more useful in trending markets where there are clear uptrends and downtrends in price.
Disclosure: I am part of Trade Nation's Influencer program and receive a monthly fee for using their TradingView charts in my analysis.
———————————
WISH YOU ALL LUCK

Breakout is just a matter of time. Quantum shows a lot of interest and it looks like the major 3 all are ready to fly. IONQ, RGTI, QBTS

CYBN still holding daily supports - barelyCYBN remains in a choppy pattern after a big volume bull break and then an even bigger volumr 18% sell-off. There's a big range on this that I anticipate will tighten up for a while unless bears show up first thing next week and break 7.30ish and 7.11 supports. In the entire psych sector, this daily chart is the closest one to breaking down and has the most amount of overhead supply.
Entry: 8.35 (approx)
Stop loss: 6.99

Anticipating MNMD bull break, but large overhead supply remainsMNMD is looking good on the daily chart for a bull break from it's currently daily equilibrium, but it still remains far from it's weekly and monthly resistance levels that ATAI has already cleared. I do anticipate MNMD to benefit from the GO signal from ATAI but the additional overhead supply may remain an obstacle until we get through it, either through grinding price action or a news catalyst specific to MNMD.
Entry: 6.77
Stop loss: 6.27

CMPS big 55% bounce after big crash on partial read outCMPS crashed two weeks ago down 50% on market reaction to initial readout for an ongoing trial, and has since bounced 55%. I bought the dip at 2.61 inside an hourly equilibrium with a close by stop and now just letting this position play out, hopefully for months as I anticipate hype to return to the sector now that ATAI gave the GO signal we've been waiting years for.
Entry: 2.61
50% stop loss: 2.55
50% stop loss 2.05

ATAI breaks out of three year channel on massive volumeATAI had a big breakout last week on positive market reaction to news, and is trading at the highest levels in 3 years. This is the first monthly trend change in the history of this stock (and maybe even the psych sector!) and I'm anticipating this to continue playing out as hype slowly returns to the sector. this is a small cap and a little volume on this can go a long way. Entry: 2.15, stop loss 1.95

Cup & Handle Formation on Bigger tf.ABT Analysis
CMP 134.44 (06-07-2025)
Cup & Handle Formation on Bigger tf.
Currently Near Resistance Zone.
Crossing & Sustaining 135 - 135.20 may
lead it towards 150 & then around 180.
Should not break 121 now.

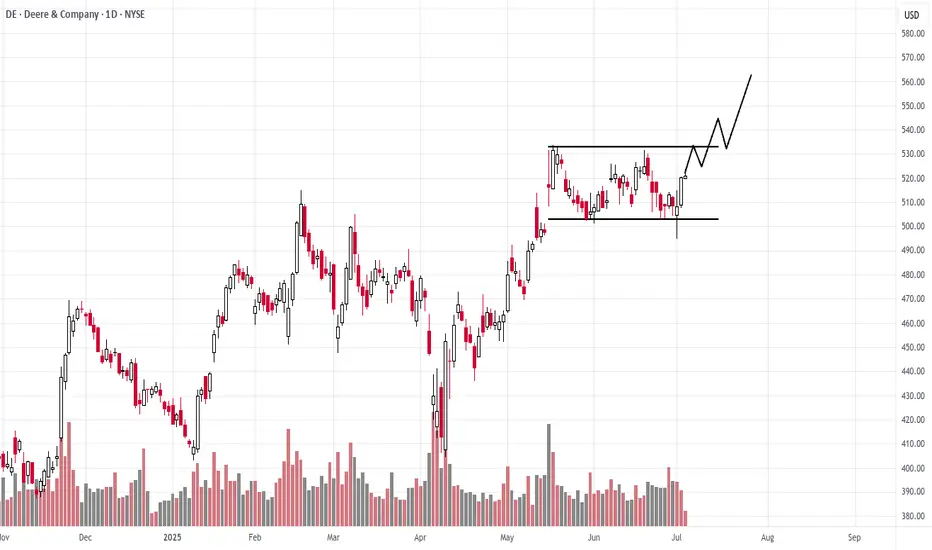
Deere and CompanyNYSE:DE has broken out of a multi-year trading range and is now testing. Possible reaccumulation if we see a strong break through resistance and a test on low volume.
Reddit, how much further?NYSE:RDDT might want to consolidate here and build a flag before launching further
down trendline from ATH is acting as resistance
also there is some supply from 160-180 to go through
forming quite a nice rounding bottom here
could go straight up too... who knows

ULTA what a beautyNASDAQ:ULTA has been frustrating to wait for but might be ready to go
forming a consolidation similar to what it did in end of 2023, and could go way above 500 if it follows through
less taxes on tips means those ladies will have more money to spend on makeup and ULTA will profit from it
stops would be a weekly close below the 9 EMA or 2 daily closes below the 21 EMA

GOOGLE GOLDEN CROSS INCOMINGNASDAQ:GOOGL NASDAQ:GOOG GOLDEN CROSS!
The overhead gap will be filled.
It is inevitable.
-READ THE CHARTS 7/5/25

VISA GAP FILL INCOMING$V overhead gap at $369 ready to be filled.
A weekly candle close over 370 is necessary to see a new all-time high.
A breakout and retest of the top trendline is necessary to see 400+.
The script is written. It is inevitable.
-READ THE CHARTS 7/5/25

GOOGL Breaking Out of Downtrend? July 7🔍 GEX-Based Options Insight (Chart 1)
* Current Price: $179.53
* Highest Positive Gamma Level: $180 — this is the key gamma wall. Price is magnetized toward it and may experience hesitation or consolidation here.
* Call Walls Above:
* $182.5 → 2nd Call Wall
* $185 → 3rd Call Wall (possible extended target if momentum remains bullish)
* Put Walls Below:
* $170, $165 → Both levels suggest downside is well-defended by PUT buyers
* Options Sentiment:
* IVR: 36.2 (fairly elevated)
* IVX > IVR (IV expansion potential)
* Call Bias: 22.9% Call$, GEX bullish (green circles)
* 🔋 Interpretation: Bullish GEX + elevated IV suggests strong upward pressure. Consider buying CALL options near $179–$180, targeting a breakout continuation toward $182.5–$185.
🧠 1-Hour Technical Analysis (Chart 2)
* Structure: GOOGL just broke a local CHoCH → BOS, reclaiming short-term EMA support.
* Trendline Breakout: Clean break above descending trendline + break of BOS = bullish confirmation.
* Support Zones:
* $178.85 (minor support)
* $175.70 and $173.50 (stronger demand)
* Next Resistance Levels:
* $181.61 → matches GEX wall
* $185.0 → next key area to watch if breakout sustains
* Volume: Bullish breakout accompanied by rising volume = healthy momentum
* Bias: Leaning bullish, but needs to hold $178.85 zone to stay valid.
✅ Trade Plan Suggestion
Call Entry Idea:
* 📍 Entry: $179–$180 (on pullback or breakout)
* 🎯 Target: $182.5 → $185
* ⛔️ Stop-loss: Below $178.50
* 📆 Contract: 1–2 weeks out (due to IV and potential expansion)
Note: If it fails to hold $178.50–$175.70 zone, re-evaluate for PUTs or wait for new structure confirmation.
This analysis is for educational purposes only and does not constitute financial advice. Always manage risk and trade with a plan.

AMZN Gamma Setups + Trade Plan for July 7📡 GEX-Based Option Trading Analysis
Amazon (AMZN) shows bullish option flow into next week. The GEX map highlights the following:
* Highest Net GEX sits at 225, acting as a strong magnetic price level / resistance zone.
* There’s a Call Wall cluster at 225–230, which could cap short-term upside unless we break through with strong momentum.
* IVR: 27.5 — moderately elevated, giving decent premium for calls.
* Calls: 8.8% vs. Puts: neutral – bullish skew with gamma support underneath.
* Support zone: 215–213 (GEX floor + HVL + PUT wall).
* A break above 226 opens doors to a potential squeeze into 230–232.
🟢 Trade Idea for Options:
* Directional Bullish Bias above 223.
* Consider buying July 12th 225C or vertical 223/230C debit spread for a lower risk play.
* Use tight stop if price fades below 219.75.
📈 1-Hour Chart Technical Setup
From the 1H chart:
* AMZN broke structure (BOS) above 223 and reclaimed the trendline.
* Price has broken out of the previous supply zone (highlighted in purple) and is retesting it now.
* 9/21 EMA shows bullish crossover; price holds above trendline with rising volume.
* Strong support confluence around 219–221 from CHoCH, EMA, and structure lows.
* Bias remains bullish continuation as long as price holds 221.60–222.
🧠 Scalping Plan (Intraday):
* Long setup: Look for retest entry at 223.00 or 222.50, stop below 221.50, target 225.60, then 227.50.
* Avoid chasing if price gaps above 226. Wait for retrace back into structure.
* Bearish invalidation only below 219.
🎯 Final Thoughts:
* AMZN is entering a gamma-rich zone. Watch 225 reaction — breakout could spark a run to 230+.
* Options look primed for bullish plays. Chart structure supports a breakout continuation.
* Trade with tight stop-losses, especially ahead of CPI next week.
This analysis is for educational purposes only and does not constitute financial advice. Always manage risk and do your own research.

NVDA GEX Analysis for Options Trading. Jul 7Gamma Exposure (GEX) Insights – July 5, 2025
* 📍Key Gamma Wall (Resistance):
→ 160.98 — Highest positive GEX level (strong call wall / gamma resistance).
→ 162.5 — Next large call wall, acting as a magnet or rejection pivot.
→ 165 / 170 — Thin GEX above = squeeze zone if breakout occurs.
* 🧲 Support Side:
→ 152.5 – 150: HVL + Put Support + GEX pocket.
→ 140: Second PUT wall, deeper support if breakdown worsens.
* 📉 IV Sentiment:
→ IVR: 5.6, IVx avg: 37.9 = Low implied volatility.
→ Current IV crush environment favors debit call spreads or directional long calls with tight risk.
* 📊 Call/Put Flow:
→ Calls: 3.3%, Puts: -0.53%
→ Slight bullish bias but not overcrowded — room for gamma expansion.
🔄 Options Trade Setups Based on GEX
Bullish Gamma Squeeze Setup:
🟢 Trigger: Price breaks and holds above 161.
🧨 Target: 165 → 170 (thin GEX zone could cause sharp move).
🛡️ Strategy: Buy 160C / Sell 165C (debit spread) or long 162.5C with defined stop.
⛔ Stop: If NVDA fails to hold above 158.
Bearish Gamma Rejection Setup:
🔴 Trigger: Rejection at 160.98–162.5 zone with volume fade.
🎯 Target: 156.5 → 152.
🛡️ Strategy: Long 160P / Short 155P (bear put spread) or short 162.5C naked if IV allows.
⛔ Stop: Breakout above 162.5 invalidates this setup.
📈 1-Hour Chart Technical Analysis
Structure & Price Action:
* NVDA is in bullish market structure, forming higher lows with a clean CHoCH → BOS → retest play.
* It reclaimed the 159.20 level and is testing the 160.98–162.5 zone — a key area where momentum traders will engage.
Zones to Watch:
* Support:
→ 156.68 (minor swing support)
→ 153–152 OB zone (valid bullish OB + HVL)
* Resistance:
→ 161–162.5 (GEX resistance + supply)
→ Above 162.5 opens room to 165+
Trend & Volume:
* Strong bullish candle breaking BOS.
* Volume picked up during BOS, but follow-through needs to come with breakout candles or retest hold.
🔍 My Suggestions for Intraday/Swing Traders:
✅ Bullish Setup:
If NVDA holds above 159.20 and reclaims 161, enter on retest of 160.50.
TP1: 162.5
TP2: 165
SL: Below 157.80
❌ Bearish Setup:
If price gets rejected near 162 and breaks below 157.80 → short retracement to 153.
TP1: 156.5
TP2: 152
SL: Above 162.50
My View:
Currently bullish bias but entering a decision zone. Wait for clean breakout with volume, or short rejection if momentum fades. Keep GEX in mind — above 162.5 has little resistance and can rip.
This breakdown is for educational purposes only and not financial advice. Always manage your risk before taking a trade.

BERKSHIRE BOTTOM IS INNYSE:BRK.B chopsticks are getting tight...
Do you see what I see?
The overhead gap at $535 wants to be filled.
Currently at $485.
$50 move incoming.
Do NOT fade Uncle Warren.
- READ THE CHARTS 7/5/2025

BANK OF AMERICA INCOMING BREAKOUTNYSE:BAC weekly cup and handle pattern approaching breakout...
Do you see what I see?
A weekly candle close over $50 can send this to $70.
Keep it on your radar.
-READ THE CHARTS 7/5/2025
