VKTX: Unusual Options Flow & a Breakthrough Weight-Loss DrugIf you haven`t bought CKTX before the recent rally:
Now you need to know that Viking Therapeutics (VKTX) is a speculative biotech stock in the GLP-1/GIP agonist space, aiming to challenge market leaders like Eli Lilly and Novo Nordisk. Recently, I noticed unusual options flow — specifically, Jan 16, 2026 $60 strike calls
Key Bullish Points
1) Riding the Obesity Drug Boom
VK2735 is Viking’s dual agonist candidate showing promising early weight-loss efficacy, with potential overlap benefits in NASH (liver disease). The obesity treatment space is expected to exceed $100B by 2030—huge upside if their trials continue positively.
2) Options Flow Tells a Story
Those Jan 2026 $60 calls caught my attention precisely because the stock currently trades in the mid-$60s. These aren’t cheap lottery plays—they’re strategically timed wrt trial readouts, partnerships, or acquisition interest. Essentially, someone anticipates meaningful upside in the near future.
3) Descending Wedge — Chart Looks Bullish
VKTX peaked near $100, then pulled back into a well-defined descending wedge. If it breaks out above $70–$72 with volume, that could kick off a classic reversal trade.
Smart Money Options Flow — Near-Term Bet:
Recently, I spotted unusual open interest in $60 strike calls expiring Jan 16, 2026 — that’s only about 7 months away.
This means someone is positioning for a big upside move relatively soon, likely betting on positive Phase 2b/3 data, a partnership deal, or even buyout chatter within the next few quarters.
Short-dated, out-of-the-money call flow like this often hints at near-term news — not just a long-dated hedge.

BABA: Testing Daily 200 SMA on Falling Wedge; Gimme Bounce Here!Baba is approaching the key level of the 200 SMA, a zone where price has respected and bounced sharply off in the past! What's crucial to note is this is occurring off of a falling wedge pattern, and RSI in the 30s showing oversold conditions.
- Calling 108 as an interim bottom here
- Looking for 117.7ish as the next leg towards where price is headed
P.S: This name is very undervalued financially with many analysts placing a fair value of around 145 or so, BABA is buying back shares, and inking new customer centric deals/partnerships
I like the risk to reward of going long here!

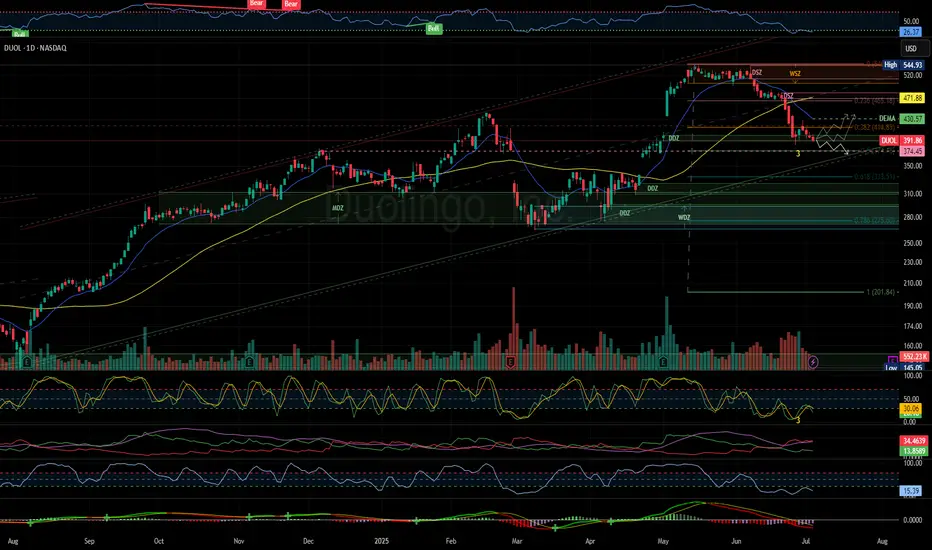
DUOL probable continues bearish for CCSDUOL 1D: at mid DDZ which coincides with FibR- 0.382. Just below price gap.
There is no sign of a reversal yet. Early next week , expect to confirm this to determine potential CCS.
Just covered a price gap with Fib-R 0.382 and likely bo would test 0.5 FibR, just before lower price-gap. BO here likely cover gap to test 0.618 typically high probability of demand side increasing.
Bo would test 0.786 for a deep correction which c
Potential target is DDZ above WDZ or DDZ in WDZ.
Why IonQ (IONQ) Could Be the NVDA of Quantum ComputingIf you haven`t bought IONQ before the rally:
Now you need to know that IonQ isn’t just another speculative quantum stock — The company is building a robust ecosystem around its best‑in‑class trapped‑ion architecture and targeting fault‑tolerant, networked quantum systems. With record bookings, major acquisitions, and a strong balance sheet, IonQ could emerge as the NVIDIA equivalent for quantum infrastructure.
Key Bullish Arguments
1) Superior Quantum Tech – Trapped‑Ion Advantage
IonQ’s trapped-ion processors boast 99.9% two-qubit fidelity, demonstrating higher accuracy and scalability than superconducting alternatives
These systems also operate at room temperature, meaning simpler deployment and lower costs
2) Ecosystem Strategy & Acquisitions
The $1.08B acquisition of Oxford Ionics (expected close in 2025) expands IonQ’s qubit control tech, pushing toward planned 80,000 logical‑qubit systems by decade’s end
Combined with ID Quantique and Lightsynq, IonQ is building a full-stack quantum and networking offering
3) Strong Revenue Growth & Cash Runway
Revenue soared from $22M in 2023 to $43.1M in 2024, with bookings of $95.6M
. Q1 2025 saw $7.6M revenue and EPS –$0.14, beating expectations; cash reserves near $697M provide years of runway
4) Real Commercial Deployments
IonQ sold its Forte Enterprise quantum system to EPB ($22M deal) for hybrid compute and networking, marking real-world commercial applications
5) AI & Quantum Synergy
Involvement in NVIDIA’s Quantum Day and hybrid quantum‑classical AI demos (e.g., blood pump simulation with Ansys, ~12 % faster) indicates strategic synergy and positions IonQ as a critical piece in the future AI stack
Recent Catalysts:
Texas Quantum Initiative passes – positions IonQ at forefront of U.S. state-backed innovation
Oxford Ionics acquisition pending – major expansion in qubit scale & tech
Barron’s analyst buys – industry analysts see long-term potential; IonQ among top quantum picks
Broader quantum optimism – McKinsey & Morgan Stanley forecasts highlight synergy between quantum and AI, benefiting IonQ

CRSP Could Crack the Holy Grails of Medicine: Cancer & AlzheimerWhen Tesla (TSLA) started, few believed a scrappy EV startup could transform the entire auto industry and ignite a green energy revolution. But it did.
Today, CRISPR Therapeutics (NASDAQ: CRSP) is quietly doing something similar for medicine — and if you squint, its upside might be even bigger than Tesla’s.
Gene Editing: The Next Industrial Revolution — For Your Cells
CRISPR/Cas9 gene editing is like biological software. It gives scientists the power to cut, delete, or rewrite genes — the source code of life — with surgical precision.
CRISPR Therapeutics was co-founded by Dr. Emmanuelle Charpentier, a Nobel Prize winner who helped pioneer this breakthrough. The company’s lead therapy, exa-cel — just FDA approved in the U.S. — is the first-ever CRISPR-based gene-editing treatment to hit the market.
First up: curing devastating blood disorders like sickle cell disease and beta-thalassemia — a $10 billion+ opportunity. But that’s only the start.
Aging: The Ultimate Disease
What if we treated aging itself as a disease?
Many scientists now argue that growing old is the result of accumulated genetic errors, cellular damage, and mutations — processes that can be slowed or even reversed.
Gene editing holds the promise to repair DNA damage, reprogram cells, and treat the root causes of age-related decline. If successful, it could extend healthy human lifespan by decades.
Think about that: Tesla made cars last longer and burn cleaner. CRSP could make you last longer and live healthier.
The Two Holy Grails: Cancer and Alzheimer’s
Beyond blood disorders, CRISPR Therapeutics is working on a pipeline targeting solid tumors, diabetes, and more. But the real game-changers are cancer and Alzheimer’s disease — the twin mountains every biotech company dreams of conquering.
With gene editing, we could one day rewrite the genetic mutations that fuel cancer growth or remove the faulty proteins that clog the brain in Alzheimer’s. These are trillion-dollar problems — and the company that cracks them will reshape human history.
Built for Scale — Like Tesla
CRSP isn’t going at it alone. Partnerships with Vertex, Bayer, and ViaCyte help spread risk and amplify impact. With over $2 billion in cash, it has the runway to execute — just as Tesla used capital to build factories and charging networks at scale.
The market still underestimates that this is a platform company — not a single-drug biotech. If Tesla went from cars to batteries, solar, and AI, CRSP could go from blood disorders to rewriting the code for life itself.
Bottom Line
Aging. Cancer. Alzheimer’s. These are the holy grails of medicine.
If you missed Tesla at $20 a share, CRISPR Therapeutics could be your second chance — the TSLA of Gene Editing.
Because the greatest disruption of all is not electric cars. It’s the chance that, one day, growing old will be optional.

$META Braces for Market HeadwindsWhile the NASDAQ is flirting with putting a double-top in, technology companies like NASDAQ:MSFT NASDAQ:GOOGL and NASDAQ:META are increasing CapEx spend for future Ai infrastructure. Margin compression is likely to result with a smaller hit from energy costs - estimated at about 1% of revenue - as energy demand for compute continues to leap forward and future executive action from the Trump administration threatens to kneecap the ITC with modified "placed-in-service" dates and onerous FEOC requirements, eliminating targeted tax subsidies on solar and redistributing the costs to energy more broadly. NASDAQ:META will not likely see the benefits of its CapEx spend anytime soon.
The ratio continues to widen between the NASDAQ:NDX and AMEX:SPY , indicating a higher probability of mean-reverting behavior. While QE and open-market operations have tended to be steepening for technology companies after the dotcom bust and beginning during the GFC, the segment is likely exhausted. We have not yet seen a larger retrace since unprecedented yield inversions starting in '22.
If we see a large market correction, a markdown in share price and any drop in advertising - META's largest revenue driver - will likely compound bearish sentiment. Tariff effects have yet to reported meaningfully in economic data and the job market is cooling. Inflation is likely to stick at 3%. Stagflation is on the table.
What a time to be alive.
~s

Brilliant buy time for QBTS?Is it brilliant buy time for QBTS? I'd say so.. $30 in a very close reach, positive news all over.

JPMorgan Chase Wave Analysis – 3 July 2025- JPMorgan broke key resistance level 280.00
- Likely to rise to resistance level 300.00
JPMorgan recently broke above the key resistance level 280.00 (which stopped the earlier sharp upward impulse wave (5) in February).
The breakout of the resistance level 280.00 accelerated the active impulse wave 3 of the medium-term impulse wave (5) from May.
Given the clear daily uptrend, JPMorgan can be expected to rise to the next round resistance level 300.00 (target price for the completion of the active impulse wave 3).

battle of patentGiven the robust claims of Spruce's US Patent No. 11,344,557 and Neurocrine's stock chart performance, the patent's invalidation would likely be both challenging and detrimental to the plaintiff.

Intel - The rally starts!Intel - NASDAQ:INTC - creates a major bottom:
(click chart above to see the in depth analysis👆🏻)
For approximately a full year, Intel has not been moving anywhere. Furthermore Intel now trades at the exact same level as it was a decade ago. However price is forming a solid bottom formation at a key support level. Thus we can expect a significant move higher.
Levels to watch: $25.0
Keep your long term vision!
Philip (BasicTrading)

LULU LongMarket Structure Analysis
Break of Structure (BOS): A clean BOS was confirmed following a strong bullish impulse off the low at $219. This suggests a transition from a bearish trend into potential accumulation.
Higher Lows and Re-accumulation: After the BOS, price is forming a clear series of higher lows, indicating sustained demand and institutional interest. Each retracement is being absorbed, suggesting buyers are active.
Short-Term Bullish Target: The current structure points toward a bullish continuation toward the $260–262 zone, where previous structural inefficiencies and distribution events occurred.
Internal Pullbacks: Shallow pullbacks are developing within clean structural ranges, showing signs of controlled re-entries rather than panic-driven profit-taking.
🔹 Liquidity Landscape
Sell-side Liquidity Cleared: The deep wick near $219 represents a liquidity sweep, likely engineered to remove weak longs and activate institutional buy programs.
Buy-side Liquidity Above: There’s a dense cluster of untapped liquidity between $258–262, likely to be targeted before any major shift occurs. These levels also align with where many participants were previously trapped.
Trap Zones Below: The green areas highlight zones where retail might look for reversals. Smart money often uses these zones for re-accumulation or inducement.
🔹 Risk Management Considerations
Entry: Long positions are best taken on confirmation within higher low pullbacks. Avoid chasing price into premium zones.
Stop Placement: Beneath the most recent higher low or liquidity sweep to avoid being taken out by engineered wicks.
Targeting: Conservative traders may target $258; aggressive bias can push toward $262 zone.
Position Sizing: Maintain strict risk control as price approaches higher timeframe zones where momentum may shift.

Closing upward channel on BN. Breakout or snooze fest?BN has been rejecting off support and resistance since time began.
TA aside,
With Carney being a major player in BN and Prime minister of Canada AND putting legislation in place for major infrastructure projects, I'm bullish. I think BN will get a major stake in the upcoming Canadian projects.

Setups don't get a lot better than this for me - long at 107.83I'll start with BJ itself. Historically, it is top 50 in my universe of over 2000 stocks in terms of per day returns on trades, at .257% (6x the market avg per day). Its record is perfect at 189-0 with an average return of 1.8% in 7 days. The new filter I recently added, however, bumps that per day held return up to .363% (around 90% annualized).
On top of that, it currently sits RIGHT ON a double bottom support (almost triple bottom) that is reinforced by the previous high, and KISSED, but did not break, its 1 year regression channel before rebounding intraday. It is a stock respecting its technical support here.
That said, there are no guarantees in trading, and I've had plenty of similar stocks tank on me in similar situations, but trading is about playing the odds. And while I may face a bad beat, good traders play the odds and they are decidedly in my favor here.
The exit target is not fixed, but I will not be using FPC close unless the return is outlandish or protracted. I think you've all seen enough of my trades to know what I'm expecting, though - a profit above the average daily return of the market. Just a side note, FPC CAN be used. It isn't broken, and fairly frequently outperforms what I'm doing now on a per day held basis. I'm just looking for a little bit fatter win. The risk there, though, is a longer holding period. Sometimes a lot longer. Nothing in the market comes for free, and that's the tradeoff.
As always - this is intended as "edutainment" and my perspective on what I am or would be doing, not a recommendation for you to buy or sell. Act accordingly and invest at your own risk. DYOR and only make investments that make good financial sense for you in your current situation.

$PYPL - The time has come!NASDAQ:PYPL - The time has come! 🚀
Undervalued and breaking out.
Measured Move is $94 before November 🎯


RVYL updated outlook...ULTRA BULLISH month ahead!Both weekly & monthly timeframes indicating bullish inverted hammer. This is a bullish reversal signal based on technicals alone.
Near term buy-side technical target is just above the wick on daily candle from 6/2.
Take note of June's price action remaining predominantly within the consolidation range of the daily candle body from 6/5. The current retracement to gap fill levels on 4 hr tf is seen as an immense discount buy opportunity.
Rate cut narrative is also strongly bullish for small caps in general. Rates are to stock prices as gravity is to physics. Lower rates relieve downward pressure on stock prices, as future earnings projections are more optimistic amidst less growth-restrictive conditions.
Long term buy-side target into 2027-2028 remains 8$ range. Near term, we have at least a couple multi-bagger setups left for 2025.

Japanese pharmaceutical companyJapanese pharmaceutical company Windtree Therapeutics stock price could rise to the top of the valuable region due to the acceptance of a patent for a new cancer-fighting drug

NuScale Power strong setup formingI believe SMR is set for long rise as strong impulse will continue. This idea, of course, will take some time before we see double and triple price from now ($36). I expect swings up and down within a few weeks before trend up resumes.
Now to EW analysis. Price completed purple wave (3) of green (1) which is a part of black wave (iii). So now I expect it to go down around 38% to 68% of purple (3) and will accumulate.
Then is shall take some time for green (1) and then (2) to complete. Here we might have significant price drop with the count invalidation level at around $11.2. I don't expect this however EW rules allow to have it. Once green wave (2) is completed, the stock will fly.
SMR is an innovative manufacturer of small nuclear modular reactors. It is the only one which got the license from US nuclear authorities in this field. They do much work to install first reactors by 2030 for the first customers.
In general, data centres and progressing AI boom will be in need for energy and together with policies being shifted away from solar/wind as the only green clean energy, reliable energy sources might be long-term winners.
Currently, the company holds strong balance sheet and makes little money however work towards strengthen legal position and get contracts.
I plan to accumulate sizeable amount during upcoming volatility to build long position.

TLRY Trade Update – Island Reversal in Play?🚨 TLRY Trade Update – Island Reversal in Play? 🚨
I’ve been tracking Tilray (TLRY) for a while now. While the company has struggled, it’s now trading well below book value and showing some life on the charts. Here’s what I’m seeing — and how I’m positioned.
My Position:
50 contracts Jan 2026 $0.50 Calls @ $0.11
50 contracts Jan 2027 $0.50 Calls @ $0.18
Defined risk, big potential. I’m playing both the short-term breakout and the long-term value thesis.
Why I Entered When I Did:
When I watch stocks, I’m always focused on the chart, not just the price. I zoom out — monthly, weekly, daily — then zoom in: hourly, even 5–10 min on high-volume names.
On June 25th, TLRY broke above the hourly trendline. That was a key technical shift. From there, it began forming a bullish flag-like pattern — right after hitting new lows. That setup caught my attention.
I debated buying shares or options. I chose long-dated calls to fully define my risk and selected a strike that I believed could end up in the money. Ultimately, I went out to 2026 and 2027 to give the pattern — and potential catalyst flow — time to work.
Because in the end:
👉 Time is more important than price.
📊 Technical Breakdown:
1-Hour Chart:
Clean breakout above $0.41–$0.44
Targeting a test of $0.64 (prior breakdown zone)
Solid momentum and volume
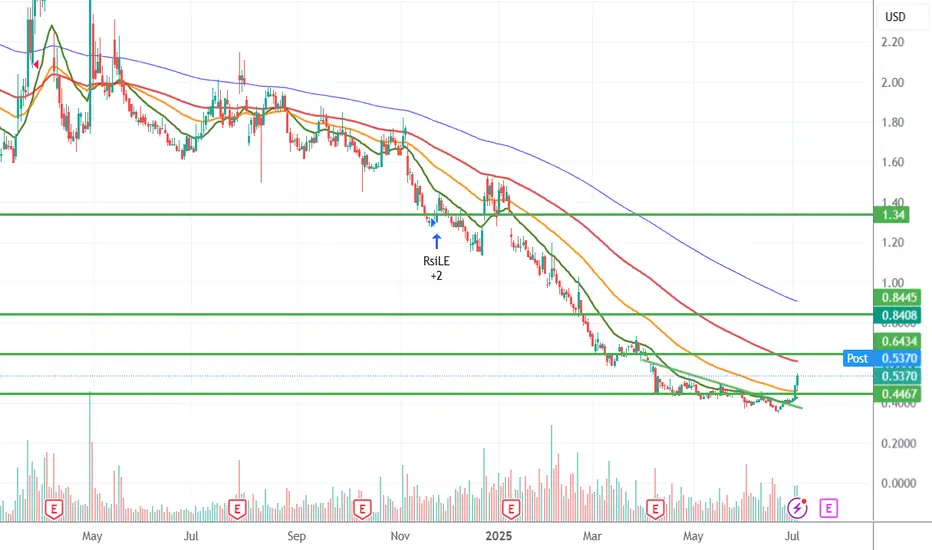
Daily Chart:
Potential island reversal forming
Gap fill potential to $1.34
Confluence with moving averages turning up
Fundamentals:
Trading at ~$0.48 with book value near $2.80
Market cap under $500M
Exposure to cannabis, beverages, CBD, and European growth
Possible M&A or policy tailwinds still on the table
🎯 TLRY Price Targets:
$0.64
Retest of breakdown zone
Short-term (1–2 weeks)
$0.80–$0.90
Previous consolidation/resistance
Medium-term (1–2 months)
$1.34
Gap fill zone
Long-term (3–6 months)
$2.80+
Return to book value
Tail event (6–18 months)
Risk is defined. Structure is forming. If price and fundamentals align, TLRY could have room to run. Keep an eye on volume at each level and how it handles the $0.64 test.
Let’s see if the reversal holds 🔄
P.S. Since writing this breakdown, TLRY has continued its move and closed strong. While short-term price action may vary, the core thesis remains intact: the structure, volume, and breakout levels are all part of the bigger setup I'm tracking. This is a long-term swing with defined risk, and I’ll continue to post updates as the trade unfolds.
Solaredge!! Ready for a rebound?Solar stocks have taken quite a hit. There are several reasons for that, the biggest is high interest rates. Solar companies (installers) often sell solar by having the end-customer finance the up front cost of the system. When interest rates sky-rocketed post-covid, that made it a lot harder to sell solar for many solar companies, the ones who built their entire business model around financed solar. Several solar companies went belly up who owed Solaredge a lot of money. This pushed the stock down even further.
Solaredge is #1 or #2 in many market segments GLOBALLY. They make a good product and are constantly improving it.
If the US removes the tax credit for residential solar, which it looks like it will, the stock will take another tumble but I do not expect it'll ever go below $16/share again.
My best guess would be that the stock is strong the rest of 2025, while there's a huge rush the get as much residential solar installed as possible before the U.S. residential tax credit (25D) expires, then 2026 will be a slow year, then democrats take over Congress and re-enact the solar tax credit which would send the stock back into the $300/share range. We'll see :)

Watch OutIf it breaks the 214 supply zone the next one to break is the 224 zone. I know most people would put stop loss around 193. However, that's where my smart money friend places his huge buy orders. He calls it the demand zone. Not financial advice.

VISA Further Downside
I am expecting further downside for V, based on:
Bearish RSI divergence on recent top (on 4H and Daily timeframes)
Lack of Bullish RSI divergence on recent low
Strong volume on downside, smaller volume on upside
The 1st target is green support zone around 320.

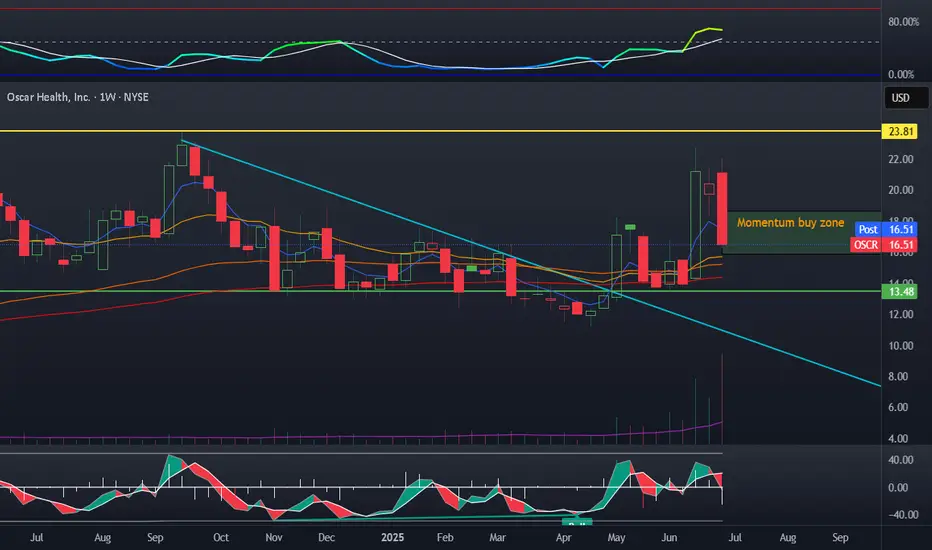
OSCR a buy OSCR I have added to the position after the correction. Ive had a few rounds of covered calls collected. We note a nice FUD based correction on the stock, this will allow stochastic to fall alongside volatility. This will also allow the moving averages time to catch up.
My plan:
Sold 16$ CSP, bought shares around 16$, sold covered calls when price was higher, today I also bought 20$ September calls.