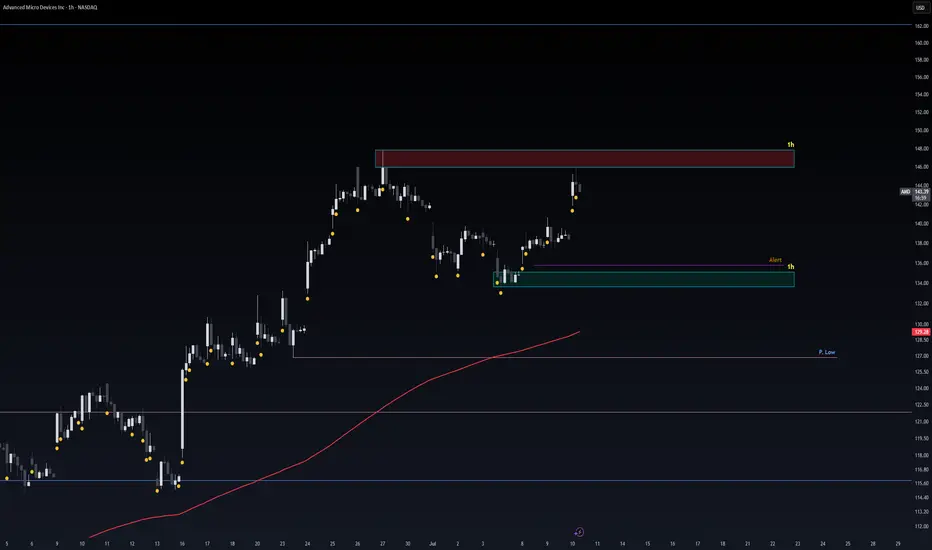
Safe Entry Zone AMDPrice Rejected From Resistance.
Safe Entry Green Zone.
Target after that 162$ price level.
Note: 1- Potentional of Strong Buying Zone:
We have two scenarios must happen at The Mentioned Zone:
Scenarios One: strong buying volume with reversal Candle.
Scenarios Two: Fake Break-Out of The Buying Zone.
Both indicate buyers stepping in strongly. NEVER Join in unless one showed up.
2- How to Buy Stock (safe way):
On 1H TF when Marubozu/Doji Candle show up which indicate strong buyers stepping-in.
Buy on 0.5 Fibo Level of the Marubozu/Doji Candle, because price will always and always re-test the
Take Care & Watch OUT !
NVDA Daily Chart – Rising Wedge Alert!Just analyzed this NVDA setup. We’re seeing a clear rising wedge forming near the top of a strong run-up — typically a bearish reversal pattern. Price tagged $167.89 and pulled back slightly, closing at $164.92.
If this breaks down, watch the $148.67 - 151.31 area, and below that $125 as a key level. Bulls want to see a strong hold and breakout above $168 to invalidate the wedge.
#NVDA #NVIDIA

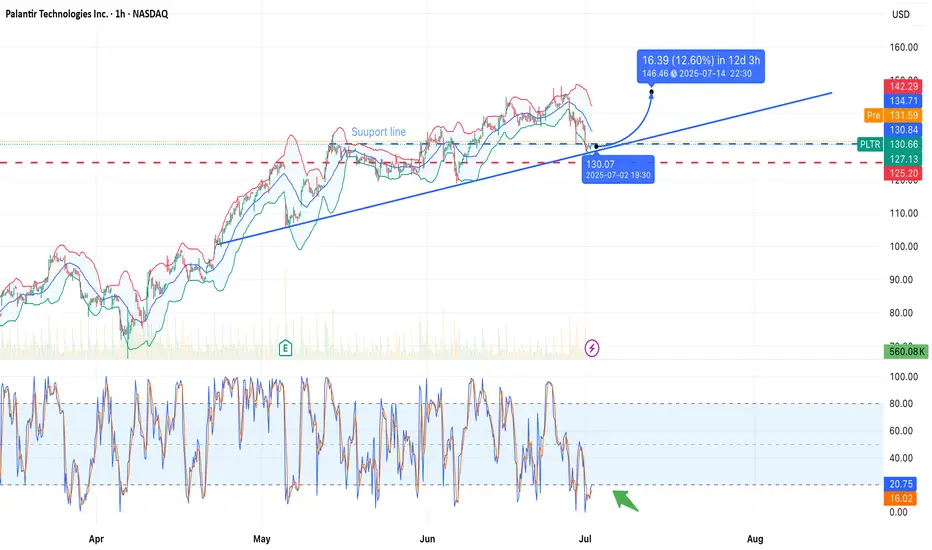
Palantir Technologies (PLTR) — Bounce in Progress?NASDAQ:PLTR is testing a long-term ascending trendline near the $128.79 level, which also aligns with a horizontal support zone. A potential rebound is forming with a projected move toward $145.94 — a +13.32% gain in 12 days.
Technical Highlights:
• Support zone: $128.79 (trendline touch + horizontal level).
• Stochastic Oscillator: Deep in oversold territory — bullish crossover forming (green arrow).
• Bollinger Bands: Price pierced lower band — reversion to the mean is likely.
• Volume: Stable, with room for momentum pickup.
Targets:
• First resistance: $134.71
• Primary target: $145.94
• Stop level: below $127 (to invalidate bullish thesis)
$7.73 to $76.00 in 1 day! Another 800% runner $INKTAGAIN? Another 800% runner in a day? 🚀 Such massive moves became a daily thing these days? 😲 NASDAQ:INKT
Can't wait to see new one in the morning!

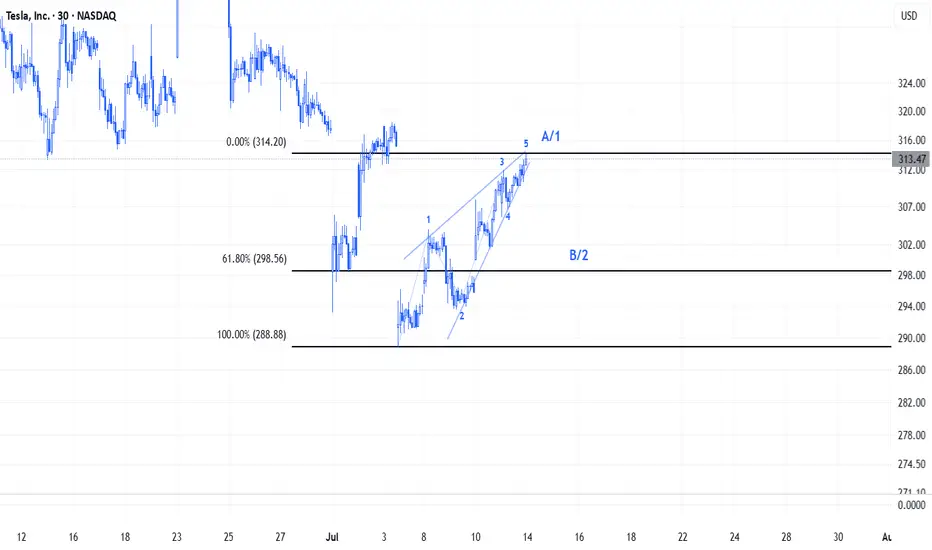
TSLA Elliott Waves We can clearly see that a Leading Diagonal is formed on TSLA's chart.Leading Diagonal usually occurs on Wave A or Wave 1.After this chart pattern, a correction often follows reaching nearly the 61,2% fib levels of the Diagonal
SMR heads up at $40.78: Golden Genesis fib may cause a DIPSMR got a strong spike with all nuclear stocks.
It has just hit a Golden Genesis fib at $40.78.
Look for a Dip-to-Fib or Break-n-Retest for longs.
.
See "Related Publications" for previous plots including this BOTTOM CALL:
===========================================
.

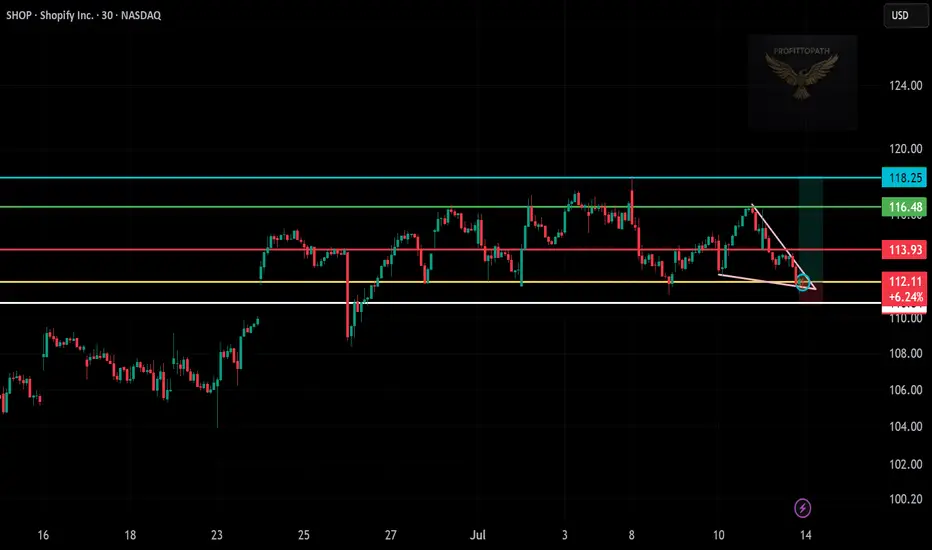
Trade Setup: Long on SHOP!📊
🕒 Timeframe:
30-minute chart
📍 Technical Overview:
Falling wedge breakout detected ✅
Support zone: $111.50–$112 (held well)
Breakout confirmation near $113
Target zones:
TP1 🎯: $116.48 (green resistance)
TP2 🎯: $118.25 (major resistance)
🔐 Risk Management:
Stop loss: Below $111.50 (white support)
Risk–Reward Ratio: Over 2:1 ✅
📈 Trade Plan Summary:
Entry: $113.00–$113.50 (breakout zone)
Target: $116.48 → $118.25
Stop loss: Below $111.50
META | Accumulation Zone Identified — Road to $990?🧠 META | Accumulation Zone Identified — Road to $990?
📊 Ticker: META (Meta Platforms Inc.)
🕒 Timeframe: 1H
📍 Current Price: $717.36
📈 Bias: Bullish accumulation → Expansion
🔍 WaverVanir DSS Thesis
Our system has flagged a liquidity harvesting and accumulation phase between $676–$740. Institutional behavior suggests price is returning to equilibrium before a potential reaccumulation and markup.
🔑 Key SMC Zones:
🔺 Premium Zone: $729–$740 — recent rejection + liquidity engineered
🔻 Discount Zone: $676–$696 — ideal accumulation range
🔵 Equilibrium Pivot: ~$705
🟦 Volume Cluster: $716–$718 → short-term magnet and likely chop area
📐 Fibonacci Confluence:
0.786 Fib = $729.37 (converging with premium zone)
1.272–1.618 extensions → Targets = $870, $990+
0.618 retracement = $676.60 — deep discount level
🚨 VolanX Execution Logic:
Wait for sweep + displacement below $700
Watch for internal BOS + higher low formation
Confirmed entry above $729 = breakout of accumulation
Scale-out zone: $870 → $990+
🧬 Trade Strategy:
Leg Action Level Risk
A Accumulate $680–$705 Low
B Confirm Break $729+ Medium
C Profit Zone $870 / $990 High reward
⚡ Alpha Outlook: META is in a controlled markup with engineered pullbacks. This is where narratives shift, and the smart money loads. VolanX signals strong alignment with SMC zones — this may be a high-conviction multileg long.
#WaverVanir #VolanX #META #SmartMoney #TradingAlpha #SMC #Accumulation #Gamma #OptionsFlow #LSTM #DSS #AITrading #TechStocks #GrowthEquity #Fibonacci #TradingView

Very DangerousCarvana back near all time highs while in an expanding triangle formation. These happen at times where volatility is increasing and swings have become more wild. It can be a sign a lower liquidity causing small dollar amounts to change the stock's price more drastically.
A daily close under $330 is a giant sell signal for me. Advising extreme caution for those long this stock. I believe there are plenty of better investments out there with far less risk.

Micron Technology - Another +50% rally will follow!Micron Technology - NASDAQ:MU - will rally another +50%:
(click chart above to see the in depth analysis👆🏻)
About two months ago Micron Technology perfectly retested a confluence of support. This retest was followed by bullish confirmation, nicely indicating a reversal. So far we saw a rally of +100%, but looking at the channel pattern and previous cycles, another +50% will follow.
Levels to watch: $200
Philip (BasicTrading)
#LONGTERMVISION

MARA supply and demand; swing tradeI'm looking at the weekly chart here, we have an interesting zone between 14.00$ and 14.68$. We've had decent amount of price action correlating to the areas going back to December of 2020. I set my trade idea with a stop loss at 12.95$ just in case of a liquidity flush , we're still getting at least a 3.5 to 1 ratio, with 2 other targets. This could take till May 2026 to conclude, would consider this a swing trade so could take months or more.

Why MARA Stock Could Rally Now as Bitcoin Eyes Its Next Leg UpWith Bitcoin regaining momentum, MARA Holdings (MARA) is showing technical signs that could signal a strong rally ahead. Here’s why the chart supports a bullish case:
1. Bullish Technical Breakout
Golden Cross Signal: On the 15-minute chart, MARA has just seen its shorter-term moving average (blue) cross above the longer-term moving average (yellow), highlighted by the red circle. This “golden cross” is often seen as a bullish momentum signal, indicating a potential trend reversal to the upside.
Strong Volume: The recent surge is accompanied by a spike in green volume bars, confirming strong buying interest and supporting the breakout.
2. Clear Upside Target
Target Set at $17.50: The chart highlights a target price of $17.50, which represents a significant upside from the current level around $14.95. This target aligns with previous resistance and could be reached quickly if momentum continues.
3. Bitcoin’s Influence
Crypto Correlation: MARA is highly sensitive to Bitcoin’s price movements. With BTC back on track and showing signs of starting its next leg up, MARA typically amplifies those moves, often rallying harder than Bitcoin itself.
4. Momentum Shift
Breaking Above Resistance: MARA has broken above short-term resistance levels and key moving averages, shifting the momentum from bearish to bullish in the short term.
Room to Run: The next major resistance is near the $16.50–$17.50 zone, giving the stock room for a continued rally if buying pressure persists.
Bottom Line:
MARA’s chart is flashing bullish signals just as Bitcoin is setting up for another potential rally. With a technical breakout, strong volume, and a clear upside target, MARA could be poised for a significant move higher if the crypto market continues to recover.

COIN Breakout Loading: Smart Money Reclaim Underway | WaverVanir🚀 COIN Breakout Loading: Smart Money Reclaim Underway | WaverVanir Alpha Alert
NASDAQ:COIN just tapped a deep discount zone, rebounded from the 0.5–0.618 retracement band, and is now reloading liquidity under the previous high.
⚙️ Technical Breakdown:
✅ Fibonacci Golden Pocket (0.618 at $384.67) was respected with strong wick rejections.
🧠 Volume compression hints at algorithmic absorption under $388.
🔴 Red Supply Block @ $393.91–$395.80 is next liquidity target.
🟡 EMA ribbon acting as dynamic support, stabilizing at $381–$382.
🎯 Target Structure:
🚀 Break $388 → blast through $393.91 (1.236) → ignite options gamma toward $400.19
🔥 Your move, institutions. This is the last discount before markup.
💰 Trade Thesis:
Holding 7/11 $387.5C @ 0.71 – Target Sell @ $1,000 per contract.
Time is short. But so is volatility.
One wick above $393.91 can detonate open interest.
🧠 If this reclaims $388 with a strong candle and volume surge, expect FOMO to carry this into the gamma squeeze zone by EOD.
📍 Posted by WaverVanir International LLC – Quant-Fueled Liquidity Engine | VolanX Protocol Alpha Layer
#COIN #Coinbase NASDAQ:COIN #OptionsFlow #GammaSqueeze #LiquidityRaid #SmartMoney #TradingStrategy #SMC #QuantEdge #FibLevel #WaverVanirAlpha #VolanX #BreakoutTrade #VolumeProfile #BuyTheDip #HighConvictionTrade

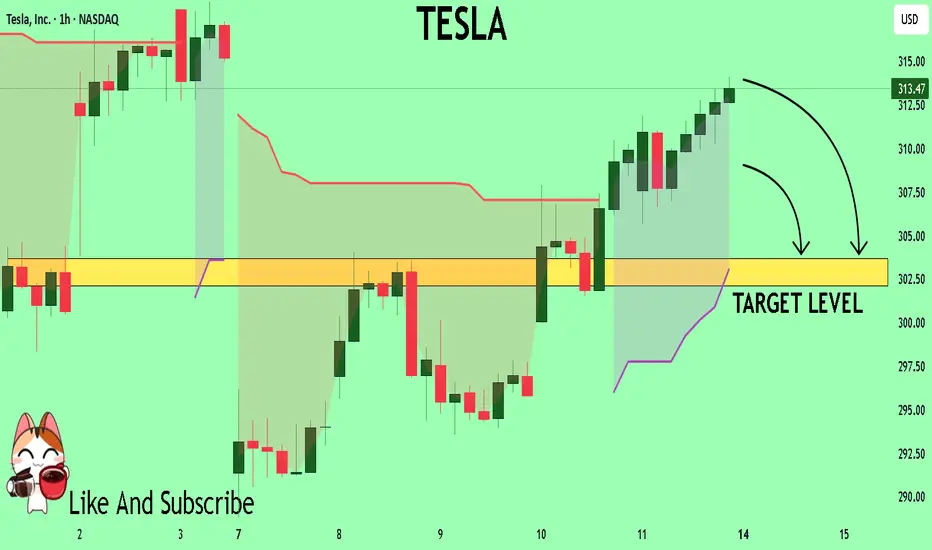
TESLA My Opinion! SELL!
My dear friends,
Please, find my technical outlook for TESLA below:
The price is coiling around a solid key level - 313.47
Bias - Bearish
Technical Indicators: Pivot Points Low anticipates a potential price reversal.
Super trend shows a clear sell, giving a perfect indicators' convergence.
Goal - 303.67
About Used Indicators:
The pivot point itself is simply the average of the high, low and closing prices from the previous trading day.
Disclosure: I am part of Trade Nation's Influencer program and receive a monthly fee for using their TradingView charts in my analysis.
———————————
WISH YOU ALL LUCK
MicroStrategy Bitcoin FOMOIs it time to sell? In percentage terms, MicroStrategy has significantly outperformed its underlying asset, Bitcoin. It's concerning to watch Michael Saylor's FOMO (fear of missing out) into Bitcoin over the past year, as this could ultimately do more harm than good for Bitcoin. MicroStrategy's stock seems massively overvalued compared to its Bitcoin holdings. As the saying goes, "when the tide goes out, we see who is swimming naked."
Over the same period Bitcoin has gained 674%, while MicroStrategy has gained 2831%, making the situation quite clear. When comparing past bull runs, the percentage gains between Bitcoin and MicroStrategy have typically matched more closely, with both assets trending up together. So, what's different this time? Media exposure and FOMO.
Proceed with caution; this is starting to look like a bubble. Is it time to short?

DELL eyes on $116.10: Golden Genesis fib will determine TrendDELL has been a sleepy stock with mixed earnings.
Now testing a proven Golden Genesis at $116.01
Look for a Break-and-Retest to start an Uptrend.
.
See "Related Publications" for other plots ---------------------->>>>>>>
This one in particular is caught the BOTTOM exaclty:
===================================================
.

Mean Reversion Trade: MA1. RSI in oversold region
2. Price likely to rebound back the the mean
Trade Rules:
Entry Trigger - RSI has cross below oversold region, enter limit buy at close price
Exit Trigger - Close at market when close price cross above exit trigger (Red step line)

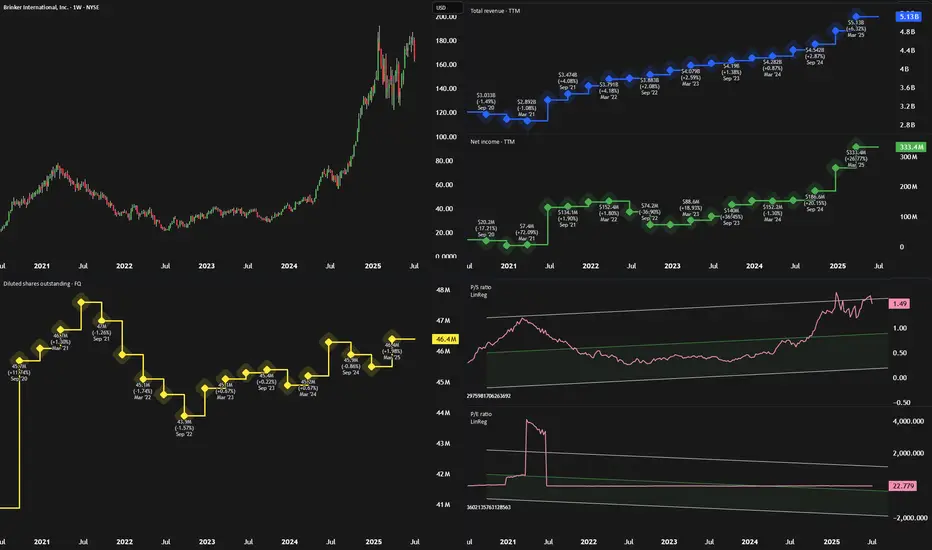
Chili's: Still Cheap, Still Ignored, Still A Strong BuyCasual dining has been in limbo post-pandemic—too pricey for impulse meals, not fancy enough to feel special. But Brinker International (EAT), parent of Chili’s and Maggiano’s, is proving there's still a winning formula if you get the execution right.
🛠️ Operational Overhaul at Chili’s
Chili’s has quietly transformed itself. A deep operational review led to smarter kitchen processes and a slimmed-down menu. These changes boosted both food quality and efficiency. By simplifying things like wing sauces and adding real-time kitchen tools, Chili’s improved service speed and cut costs—freeing up staff to focus on core offerings like burgers and margaritas.
As management put it: "Marketing brings guests in, operations bring them back."
📣 Marketing That Works
Chili’s is also nailing the branding. Viral TikToks and a more relaxed, value-focused message have resonated with consumers—both old fans and new. Unlike competitors chasing trends or discounts, Chili’s has leaned into what it does best: an affordable, comfortable dining experience.
The strategy is working. Traffic is up, and customers are coming back—not just for the hype, but for the value.
📊 Financials and Growth Potential
Analysts expect revenue growth of 21%, 5%, and 5.5% over the next three years, with EPS potentially growing more than 11% annually. However, we believe these estimates undervalue Chili’s long-term growth, especially as margins improve and brand momentum continues.
At just 11x cash flow and a PEG ratio of 0.47, EAT is significantly cheaper than peers like Darden (2.1) and Shake Shack (3.8). That discount suggests the market hasn’t fully priced in Brinker’s turnaround.
⚠️ Risks to Watch
Slowing improvements: Much of the "low-hanging fruit" in operations may already be picked, so future gains could taper off.
Debt load: With $430M in long-term debt, a business slowdown could raise financial pressure, despite recent earnings strength.
✅ Bottom Line: Strong Buy
Chili’s turnaround is more than a viral blip—it’s a smart reinvention. Combined with solid execution at Maggiano’s, Brinker International is proving that casual dining can still thrive.
With strong fundamentals, smart leadership, and a discounted valuation, EAT stock looks like a compelling 'Strong Buy' for the next 12 months.
MP Materials Options Ahead of EarningsIf you haven`t bought MP before the previuos earnings:
Now analyzing the options chain and the chart patterns of MP Materials prior to the earnings report this week,
I would consider purchasing the 25usd strike price Calls with
an expiration date of 2025-6-20,
for a premium of approximately $2.97.
If these options prove to be profitable prior to the earnings release, I would sell at least half of them.

ADOBE MONEY SNATCH! High-Reward Long Setup (Police Trap Alert!)🚨 ADOBE HEIST ALERT: Bullish Bank Robbery Plan! (High-Risk, High-Reward Loot) 🚨
🌟 ATTENTION, MARKET PIRATES & MONEY SNATCHERS! 🌟
(Hola! Bonjour! Marhaba! Hallo!)
🔥 THIEF TRADING STRATEGY 🔥 – ADOBE INC. (ADBE) is primed for a bullish heist! Time to steal profits like a pro!
🔓 ENTRY POINT: "BREAK THE VAULT!"
"The loot is unguarded!" – Go LONG at any price, but for smarter robbers:
Set Buy Limit orders (15m/30m recent swing levels).
ALERT UP! Don’t miss the heist signal!
🛑 STOP-LOSS: "ESCAPE ROUTE!"
Thief SL: Nearest 2H nearest Swing Low (Adjust based on your risk tolerance & lot size).
Police (Bears) are lurking – Don’t get caught!
🎯 TARGET: 440.00 (OR BAIL BEFORE THE COPS ARRIVE!)
Scalpers: Stick to LONG side only!
Big Bankroll? Charge in! Small stack? Join the swing robbers!
Trailing SL = Your Getaway Car!
📢 WHY ADOBE Inc?
🐂 Bullish momentum + Overbought but greedy!
🚨 High-risk Red Zone – Trend reversal? Police trap? Bears are strong here!
💸 "Take profits & TREAT YOURSELF – You earned this loot!"
📡 STAY SHARP, THIEF!
Fundamentals, News, COT Reports, Geopolitics – CHECK THEM! (Linkkss ☝👉👆👉).
Market shifts FAST! Adapt or get caught holding bags!
⚠️ WARNING: NEWS = VOLATILITY TRAP!
Avoid new trades during news!
Trailing stops = Your bulletproof vest!
💥 BOOST THIS HEIST! 💥
"Like & Boost = Stronger Robbery Crew!"
💰 More boosts = More profit heists! 🚀
Stay tuned… Next heist coming soon! 🏴☠️🤑


META Platforms Long Setup – Ready for the Next Move?💣 META Masterplan: Bullish Break-In Activated! 💼📈
🌟Hi! Hola! Ola! Bonjour! Hallo!🌟
Dear Money Makers & Silent Strategists, 🤑💰💸✈️
We’ve locked in on our next high-value digital vault: META Platforms Inc.
Built on our signature Thief Trading Style™ — where fundamentals meet stealth technical precision — this is your map to the bullish jackpot.
📍 ENTRY PLAN – Door’s Unlocked!
✅ Enter at any level — this heist is already in motion.
OR
🎯 Set your Buy Limit on a 15m/30m swing low or high — classic pullback infiltration.
🛑 STOP LOSS – Your Exit Route
Before breakout? Hold the line.
After breakout? Drop your SL at the recent 4H swing low – and size it to your risk appetite.
This isn’t luck — it’s calculated theft. 🔐
🎯 TARGET ZONE – Grab & Vanish
🎯 Aim: 770.00
But if the cops (aka sellers) show up early, get out with your loot — no shame in a clean getaway.
“Profit is the win. Perfection is fantasy.”
⚡ SCALPERS' TIPS – Quick In & Out
💵 Big wallet? Enter now.
💳 Tight budget? Follow the swing team.
Either way — longs only, and trailing SL is your safety rope.
📊 WHY META? – Intel Behind the Mission
🔍 This plan is reinforced by:
🔥 Strong Fundamentals
📈 Sentiment Signals
🧠 Quantitative + Macro Flow
💼 COT Data
🌐 Intermarket Correlations
It’s all aligning — the pressure’s building, and the breakout door is creaking open...
🚨 TRADING ALERT – Stay Outta Trouble
💥 Avoid placing new trades during major news drops.
🎯 Use trailing SL to protect and lock profits — your getaway vehicle must be ready.
💖 Support the Heist? Smash Boost!
Fuel the mission — every Boost empowers the crew.
This is Thief Trading Style — we don’t chase, we plan, strike, and vanish with the win. 🏆💪🐱👤
📡 Another breakout mission incoming. Stay hidden. Stay profitable. 🤑🚀

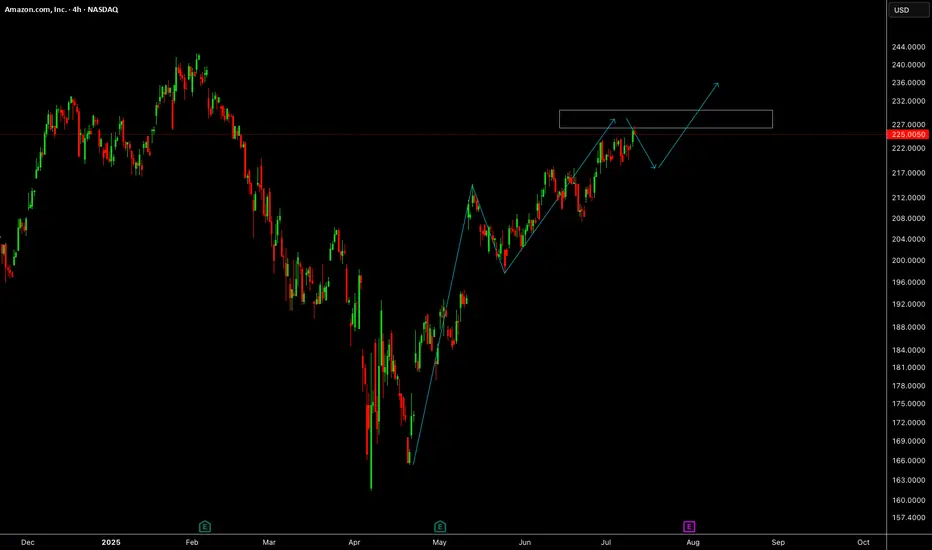
AmazonAmazon needs small correction and further push up towards 235 level.
Disclosure: We are part of Trade Nation's Influencer program and receive a monthly fee for using their TradingView charts in our analysis.