A Cheeky ScalpLet's see if the Bart pattern moves all the way down, keeping a tight stop loss below the barely holding support
ServiceNow Is Up Some 55% Since April. What Might Happen Next?ServiceNow NYSE:NOW has risen nearly 55% in the past three months as the AI-focused business-management firm and member of the S&P 500 SP:SPX gained ground ahead of and following its well-received Q1 earnings. With Q2 earnings due out later this month, what does the stock's fundamental and technical analysis say now?
Let's take a look:
ServiceNow's Fundamental Analysis
For those unfamiliar with NOW, the company sells an AI-powered platform that links clients' workers and devices to a firm's work processes and data. This helps increase productivity, improve efficiency and maximize business outcomes.
ServiceNow's cloud-based platform helps businesses digitize workflows, manage client relationships and reimagine customer experience.
The company said on Wednesday that it will report Q2 results on July 23, which could be a key date for the stock. After all, NOW rose 15.5% on heavy volume the day after management released Q1 earnings on April 23 after the bell.
As for Q2, the Street is looking for NOW to post $3.57 of adjusted earnings per share on $3.12 billion of revenue. That would compare well to the $3.13 in adjusted EPS and $2.6 billion of revenue that ServiceNow reported in the same quarter last year.
Perhaps most importantly, NOW had $10.3 billion of performance obligations as of Q1's end. That was good for 22% year-over-year growth, which bodes well for the company's future.
That said, 24 of the 35 sell-side analysts that I found who cover NOW have lowered their Q2 earnings estimates since the quarter began, while only 11 have raised their outlooks. That's typically bearish.
ServiceNow's Technical Analysis
Now let's check out NOW's chart going back to January and running through earlier this week:
image]https://www.tradingview.com/x/T9PMI1X8/
Readers will see that ServiceNow hit an $1,198.09 all-time intraday high in late January, then went into what appears to be a fairly standard "cup-with-handle" pattern from there. That's generally considered a bullish set-up.
Another bullish consideration is the so-called "golden cross" that the stock saw in late June. That's when ServiceNow's 50-day Simple Moving Average (or "SMA," marked with a blue line) crossed above the stock's 200-day SMA (denoted with a red line) at the chart's right.
Lastly, the bulls might point to a still-unfilled gap that NOW has from late January. Stocks don't always fill in such gaps, but historically, most eventually do.
However, let's now look at the other side of the coin -- the potentially bearish signals that the above chart is showing.
First, the "handle" part of NOW's "cup-with-handle" pattern has flattened out somewhat and really is rather shallow. Some technicians feel that the deeper the handle, the stronger the rally that follows. So, some might see ServiceNow's shallower handle in this pattern as not especially bullish.
Meanwhile, NOW's Relative Strength Index (the gray line at the chart's top) is neutral, but appears to be weakening.
Similarly, the stock's daily Moving Average Convergence Divergence indicator (or "MACD," marked with black and gold lines and blue bars at the chart's bottom) looks slightly bearish here.
The histogram of the ServiceNow's 9-day Exponential Moving Average (or "EMA," denoted by blue field) is below zero and has been since late May. This can typically be seen as bearish.
On top of that, the stock's 12-day EMA (the black line) and its 26-day EMA (the gold line) appear to be wrestling for the upper hand, although they both remain in positive territory.
The bulls will be rooting for the 12-day EMA to win out, while the bears will be cheering for the 26-day EMA.
Add it all up and ServiceNow looks like it's well-positioned to go ... somewhere. The question is where.
The stock's upside pivot stands at $1,046 in the chart above, having been created by the cup-with-handle pattern. That's somewhat below the $1,052.77 that ServiceNow was trading at intraday Thursday, but the stock hasn't yet held that level.
NOW's downside pivot would be its 200-day SMA (around $969 in the chart above). Losing that support line would likely force portfolio managers who are invested in the name to reduce their long-side exposure.
(Moomoo Technologies Inc. Markets Commentator Stephen “Sarge” Guilfoyle had no position in NOW at the time of writing this column.)
This article discusses technical analysis, other approaches, including fundamental analysis, may offer very different views. The examples provided are for illustrative purposes only and are not intended to be reflective of the results you can expect to achieve. Specific security charts used are for illustrative purposes only and are not a recommendation, offer to sell, or a solicitation of an offer to buy any security. Past investment performance does not indicate or guarantee future success. Returns will vary, and all investments carry risks, including loss of principal. This content is also not a research report and is not intended to serve as the basis for any investment decision. The information contained in this article does not purport to be a complete description of the securities, markets, or developments referred to in this material. Moomoo and its affiliates make no representation or warranty as to the article's adequacy, completeness, accuracy or timeliness for any particular purpose of the above content. Furthermore, there is no guarantee that any statements, estimates, price targets, opinions or forecasts provided herein will prove to be correct.
Moomoo is a financial information and trading app offered by Moomoo Technologies Inc. In the U.S., investment products and services on Moomoo are offered by Moomoo Financial Inc., Member FINRA/SIPC.
TradingView is an independent third party not affiliated with Moomoo Financial Inc., Moomoo Technologies Inc., or its affiliates. Moomoo Financial Inc. and its affiliates do not endorse, represent or warrant the completeness and accuracy of the data and information available on the TradingView platform and are not responsible for any services provided by the third-party platform.

Fortune MineralsI'm showing you a strong overhead that has been tested many times, and is now breaking out. It's kind of an IQ test, and the bears are failing it. There is little to no incentive to sell here, when we're about to "snap-to" $.25. Why would anybody sell here?
And that's why the price has seen thirteen up days in a row if you don't count one negative .64% day.
The log overhead is around $2. That's the pump which you should be here for. The bears can't explain to you why they're here. You never hear from them, do you?

SMCI: The Monthly Chart says it ALL
Stochastic is way oversold.
MACD is converging.
RSI is converging back up.
Would not be surprised to see this soar back towards the CRT value of $65, then take on new challenges back towards it previous ATH of $122.90 in March, 2024.
Regards,
Terrapins

Rising wedge with bearish divergenceI can see Whales unloading on the 2hr chart, with peak volatility, and rsi stalling. Im break the trade down over several charts..

TMCWhat a trade TMC has been for us. First learned of the company in a recent book i read 'Material World' by Ed Conway. The although we closed our option a while back our purchase of the underlying has now doubled. Will be trimming 80% of this allocation and taking profit.
I still believe the company has a strong future but want to reduce my allocation here as we already have strong gains.

$ZM Swing Setup – Fib Expansion + Recovery Arc🔍 NASDAQ:ZM Swing Setup – Fib Expansion + Recovery Arc
Zoom is entering a Fibonacci golden arc setup, bouncing off key support ($75.60) and aiming for a multi-leg move back toward structural targets.
Trade Thesis: A successful reclaim of $85–88 range can propel NASDAQ:ZM to $105–109 with a final fib target of $122 if volume confirms.
Risk: Break below $72 invalidates the recovery arc.
🧠 WaverVanir DSS Score: 7.4/10
📌 Targets:
TP1: $85.00 (safe swing exit)
TP2: $96.24 (measured move)
TP3: $108.99–$122.53 (macro extension targets)
⚠️ SL: $72.30 | RR: 3.5:1 | Timeline: 30–60 days
#Zoom #ZM #Fibonacci #WaverVanir #Options #SwingTrade #AIQuant #TradingView
🔍 Chart Overview
Ticker: ZM (Zoom Video Communications, Inc.)
Timeframe: Daily
Chart Tools: Fibonacci retracement & extension levels, projected Elliott-style wave structure
📊 Current Price
Current Price: $77.57
Key Support:
$75.60 → Previous pivot low (likely acting as short-term support)
$72.30 → Golden Pocket zone (high probability bounce area)
Key Resistance Zones:
$85.00 → 1.0 Fib retracement (former high)
$88.35 → 61.8% retracement of previous drop
$96.24 → Full 100% retracement
$105.78 → 1.272 extension (strong resistance)
$109.01 → 1.618 Fib extension
🧠 Technical Structure & Path Forecast
A potential ABC impulse wave is drawn in red:
Leg A → Target ~$92–96 range (50–100% retracement zone)
Pullback (leg B) → ~$88–90 support retest
Leg C rally → Major resistance at $108.99, possibly extending to $116.91 or $122.53 in a blow-off top
Confluence Targets:
$105.78 (1.272 extension) aligns with a major Fib cluster and resistance zone
$109.01 (1.618 extension) also aligns with previous structural highs
Final target ~$122.53 (2.272 extension) is ambitious but possible under bullish macro conditions
⚠️ Risk Management
Stop-Loss (short-term): $72.30 (loss of this level invalidates the bullish thesis short-term)
Entry Zones:
Swing long: $75.60–$77.50 (ideal accumulation range)
Momentum entry: above $85.00 (break of structure)
Downside Risks:
Break below $72.30 opens the path to $67.00 and possibly lower
📈 Probabilities (Based on WaverVanir DSS)
Target Level Type Probability
$85.00 Local resistance 80%
$96.24 Measured move 100% 68%
$105.78 1.272 Fib extension 55%
$109.01 1.618 Fib extension 45%
$122.53 2.272 Fib extension 25%

7/3/25 - $sym - Crackhead central7/3/25 :: VROCKSTAR :: NASDAQ:SYM
Crackhead central
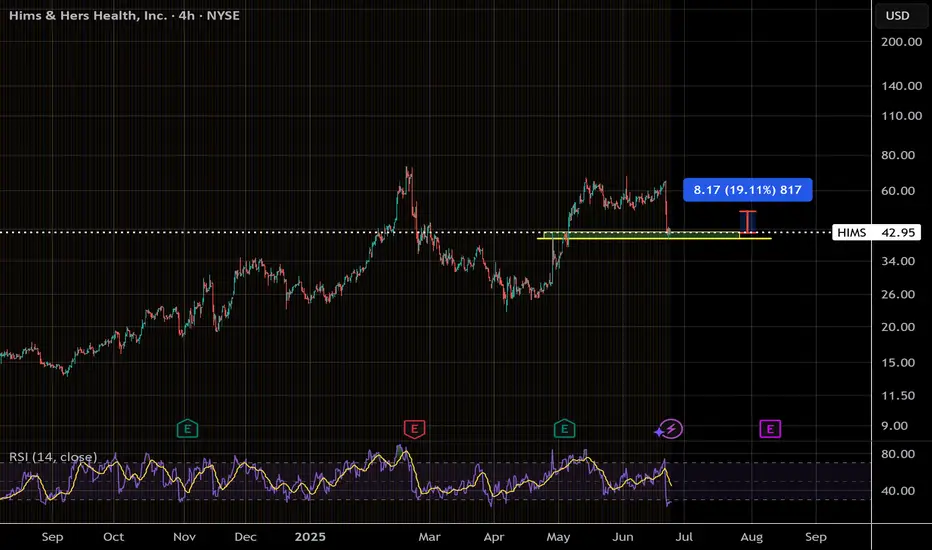
- it's almost laughable that i'm hedging my "risky" BTC, NXT, GAMB and OSCR/HIMS positions with
- the most crackheaded stocks, QUBT, now SYM, CVNA
- i'm really not sure if the chart bros will win this one
- but given the risk/ reward merits stepping up a position here in an effort to offset any change in mkt beta... where the magnification is likely 5-10x to 1... consider me interested
- for those of you who are interested in the "fundamentals" i think the only one that's driving this stock is softbank's involvement - kind of like a PE shop - but worse
- so enjoy it while it lasts
- but this stock is ultimately going to sub $10. you can bet on it. in the meanwhile... who knows. 50% 100% 1000% higher? i'm not the one to ask. ask one of these high fiving chart "investors"
- i'm just here playing the long game
- and just warning you... the real robotics company worth owning is NASDAQ:TSLA , even if it's worth a heck of a lot more (for a reason)
V

NewtekOne | NEWT | Long at $10.92NewtekOne NASDAQ:NEWT is a financial holding company providing business and financial solutions to small- and medium-sized businesses across the U.S. Services include Newtek Bank, business lending, SBA loans, electronic payment processing, payroll and benefits, insurance, and technology solutions. While the stock has taken a major hit recently, insiders have scooped up over $1 million in shares with an average price of $11.70. Currently trading at a P/E of 5.6x, forward P/E of 6.6x, and near book value, the stock may be poised for a move up soon with the anticipation of interest rates dropping. Revenue is up 24.93% from $271.15M (2023) to $338.73M (2024) and earnings are forecast to grow 11.63% per year, but the company does have a high debt-to-equity ratio (over 5x).
Tariffs could indirectly impact NASDAQ:NEWT by increasing costs for its small- and medium-sized business clients, particularly in industries reliant on imports (e.g., manufacturing, retail). Higher costs may reduce client profitability, increasing loan default risks or reducing demand for Newtek’s lending and payment processing services. But an interest rate reversal may greatly limit the impact (longer-term).
So, at $10.92, NASDAQ:NEWT is in a personal buy zone.
Targets into 2027:
$12.00 (+9.9%)
$14.00 (+28.2%)

WOW $4 to $74 Big 1,655% in just 2 daysGet ready for new power runners to emerge from this AMEX:BMNR move

WBA LongLong triggered at 11.4 even tho I'm not happy with the volume,
a pullback to 11.2 is probably and would be a better entry point
SL at 10
TP at 15

Long $BABA - NYSE:BABA is testing 200 SMA
- NYSE:BABA moves are explodes higher then cools then retest support then explodes higher than the last high. It's called trading with higher wavelength
-> Move 1: Started April 2024 when the trend reversal started. $68 -> $89 with around +30% then retraced $90 -> $72 ( -20% )
-> Move 2: July 2024, $72 -> $116 (+61%) then retraced $116 -> $80 ( -31% )
-> Move 3: Jan 2025, $80 -> $146 (+ 82.5%) then retraced $146 -> $108?? ( correction underway ) ~ -26% so far
-> Move 4: Likely from $100-105 to $180-200

Safe Entry Zone IONQStock Movement Up.
1H Green Zone is Safe Entry Zone.
Blue Lines Are Previous Highs Consider As Good Resistances.
Red Zone is Strongest Resistance.
Watch out for any selling pressure and reversal candles at these Resistances to Secure Profit
Note: 1- Potentional of Strong Buying Zone:
We have two scenarios must happen at The Mentioned Zone:
Scenarios One: strong buying volume with reversal Candle.
Scenarios Two: Fake Break-Out of The Buying Zone.
Both indicate buyers stepping in strongly. NEVER Join in unless one showed up.
2- How to Buy Stock:
On 1H TF when Marubozu/PinBar Candle show up which indicate strong buyers stepping-in.
Buy on 0.5 Fibo Level of the Marubozu Candle, because price will always and always re-test the imbalance.

BULL | Robinhood Copy TradeWebull Corporation displays explosive momentum after breaking through former resistance levels, positioning itself for a potential run to higher targets. The stock mirrors Robinhood's exceptional performance, suggesting investors may view it as a strong fintech play-along opportunity.
Key Technical Signals:
Decisive breakout from extended consolidation base
Former resistance now acting as new support
Parabolic price acceleration with strong volume
Clear pathway toward upper resistance zone around $21-24
Trading Opportunity:
The breakout setup suggests continued upside potential as the stock follows the projected bullish path. Market sentiment around fintech stocks remains elevated, providing fundamental tailwinds.
Risk Management:
Overextended RSI levels indicate possible short-term pullback
Profit-taking likely near psychological resistance levels
Stop-loss below the green support zone to protect against reversal
The comparison to Robinhood's success adds conviction to the bullish thesis, but traders should remain disciplined given the stock's parabolic nature and manage position sizes accordingly.

NEM - Cup and Handle - to 85Classic look. Strong despite weakening gold price. As S&P continues into new high territory, time for the laggards to pick up the pace.

$AAL – Turbulence Over? Prepping for Altitude Reclaim (13.76+ Ta✈️ 📅 Date: July 3, 2025 | 🧠 Source: VolanX Hybrid Predictor + SMC Confluence
📍 WaverVanir International LLC
🧭 Macro Backdrop
Fed on Pause, Dollar Cooling → Creates tailwinds for airlines by lowering hedging costs and boosting consumer demand.
Jet Fuel Prices Stable → Crude hovering under $85 keeps operating costs from spiking.
Summer Travel Boom → TSA throughput at 2024 highs, with international and premium segments driving demand. Domestic may lag, but offset by credit card spend rev share.
🧾 Fundamentals
✅ Q1 2025 Net Income Beat: $1.7B FCF, strong card-linked revenue via Barclays/Citi partnerships.
🔁 Deleveraging Story: Reduced net debt, capital discipline post-2023 downcycle.
🧮 P/E Compression Reversal: At 4.9x forward earnings, upside mean reversion likely.
📊 Credit Upgrade Watch: S&P hinted at revision if cash flow stabilizes above 3 quarters.
💬 Sentiment + VolanX Model
🤖 LSTM-GRU Hybrid Predictor: Signals an accelerating uptrend toward $13.70+ by early August.
📈 Model Stats: 50 Epochs | Batch 16 | 100 LSTM / 80 GRU Units | Dropout 0.3
🧠 Sentiment Score: +0.10 → Reflects mildly bullish tone from media & institutional coverage.
🧮 SMC + Fibonacci Confluence
📉 Breakout Confirmed above descending trendline & prior CHoCH zone at $11.70–11.86.
🔥 Liquidity Sweep Complete below $10.30 – smart money accumulation evident.
🎯 Next Zones:
Fibo 1.0 → $12.45
Fibo 1.236 → $13.27
🔱 Equilibrium Zone → $13.76 (main target)
Fibo 1.382 → $13.78 = institutional exit likely
🎯 Trade Plan – Probabilistic Setup
Element Value
Entry Zone $11.75–11.90
SL Below $11.10 (2.5% risk)
TP1 $12.45
TP2 $13.27
TP3 $13.76 (equilibrium)
RR Ratio ~3.8R (high-conviction)
Confidence 🔵 76% short-term uptrend probability (VolanX LSTM)
🛡️ Risk Management
Size for 0.5–1% capital risk if SL triggered.
Avoid overleveraging due to geopolitical/airline sensitivity.
Reduce exposure if $12.05 rejects on volume.
📌 Summary
AAL is breaking out of a multi-month compression with fuel prices in check, debt reduced, and passenger volume growing. VolanX AI expects a move to $13.76 with high probability—if confirmed, this trade offers strong asymmetric upside into late July / early August.
📉 Disclaimer: Not financial advice. Educational use only.
🏛 WaverVanir International LLC | AI-Driven Institutional Strategy
🔗 Follow for SMC + AI-backed trading intelligence.

Light at the end of the Tunnel for AAPLI have been tracking this pattern that NASDAQ:AAPL started forming in April for some time now.
This is a classic symmetrical triangle formation with significant consolidation in the last trading sessions. This patterns typically lead to a breakout in either direction, and since price is near the apex, a breakout is imminent within 1–3 trading sessions.
Current Price: $201.60 (slightly above the key $201 support/resistance zone).
Key Support: $198.62 (recent higher low).
Major Support: $189.10 (multi-month low).
Resistance Zone: $202.30 (pre-market), then $210.45 (EMA 200/50 convergence).
EMA 50/200 Cross: Both EMAs are converging at ~$210.45, which has become a significant resistance ceiling.
Typically, this is bearish when price is below both 50 and 200 EMA. However, the MACD and RSI indicators both support an imminent bullish move forming with an increase in volume.
With headwinds from antitrust issues in the EU and U.S. I wont be surprised if this breaks out significantly upwards with some positive news acting as the catalyst.
The conservative trader will place a straddle aiming for $210.45 (EMA resistance) upside and but $192–194 (prior demand zone) downside.
The riskier and probably more rewarding bet would be to place a call aiming for the $218-$224 resistance zone after this breaks $202.30

TSLA: Agentic and real world AIThe "this is a just a car company" crowd, as usual, continues to point at the valuation as a reason to short. Not realizing that the valuation has always been high. It's been apart of Tesla's DNA for many years. Like a trend line, you must consider it in your thesis along with everything else.
We will remain on trend. Money printer is running again. Don't get left behind. Don't be a hater because the stock will move the way it wants regardless of how you feel about it.
I'm not a trader.

RIVN still on trackSame as prior charts, still like this one for long term personally.
Will we bounce before $11

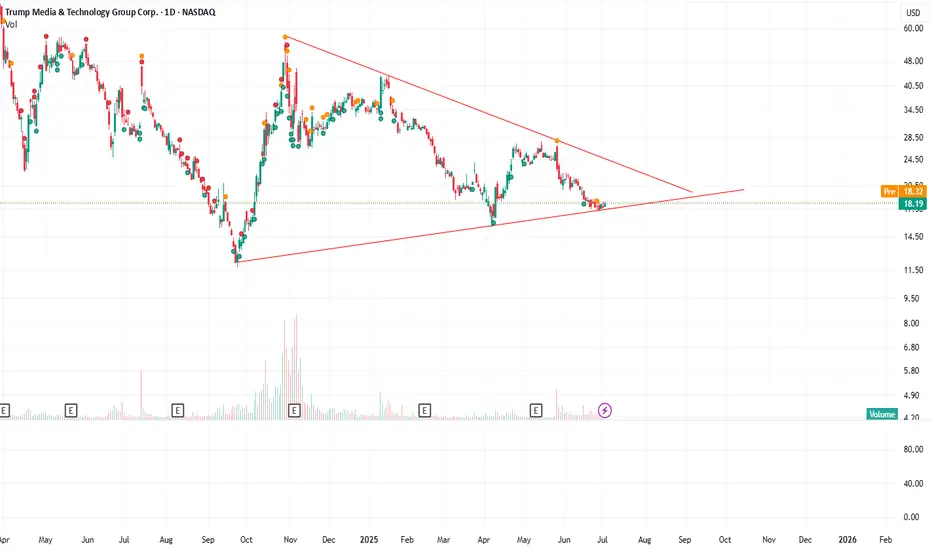
Be ready to rideUpside Potential:
Expansion plans for TMTG+ streaming and crypto partnership, though still early stage
Considerable Risks:
Extremely low revenue with heavy losses; profitability is far off
Share dilution potential: a Trump family trust controlling ~52% could dump ~$2 billion shares via SEC registration
Regulatory and competition uncertainty in social media, crypto, and streaming sectors
Sentiment-driven trading and potentially loud meme-stock swings
✅ Summary Takeaway
DJT is best characterized as a high-risk, speculative play tied closely to political momentum rather than traditional financial fundamentals. While it has deep losses, minimal revenue, and a lofty valuation, it generates volatility based on headlines. Its solvency profile is solid, thanks largely to cash reserves, but intrinsic value models suggest it is significantly overvalued.
Ulta consolidation. Wait for breakULTA is in a consolidation phase post-Q1 2025 earnings, trading between $421.79 (support) and $465.48 (resistance). To identify a breakout:
Price Levels: Watch for a daily/weekly close above $465.48 (bullish, targeting $480–$510) or below $421.79 (bearish, targeting $367.76–$338).
Moving Averages: Monitor the 200-day MA ($442.22, ~40-week MA) for support; a break above $465.48 (50-day MA) is bullish, below $442.22 is bearish.
RSI: Look for RSI >60 (bullish) or <50 (bearish) to confirm momentum.
MACD: A strengthening bullish crossover above $465.48 or bearish crossover below $421.79 signals direction.
Volume: Confirm breakouts with volume >1.5M shares.
Patterns: An inverse head and shoulders breakout above $465.48 is bullish; a head and shoulders breakdown below $315 is bearish.
Fibonacci: Watch $400.45 (50% retracement) for bearish targets, $448.66 (23.6%) for bullish.
ATR: Expect ±$10.98 daily moves; set alerts at $469.25 (bullish) and $447.29 (bearish).
On TradingView, set a custom layout with these indicators, disable “Auto (Fits Data to Screen),” and save to persist zoom. Set alerts at $465.48, $421.79, and $442.22. In your Trading 212 ISA, ULTA’s gains are UK tax-free, but monitor USD conversion fees.

AAPL // I used Fibonacci numbers. 144 is our ema support point. Let's look for closings above the green line for the trend.

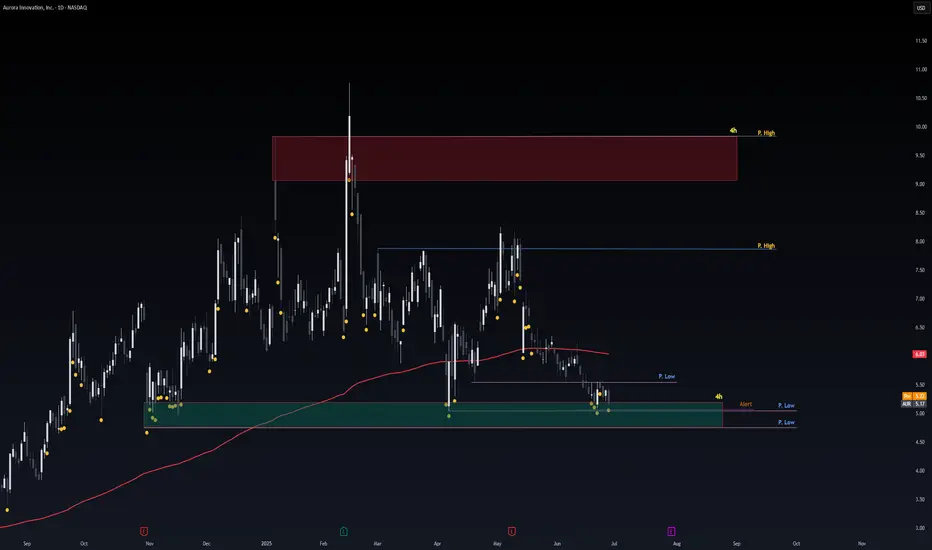
Safe Entry Zone AURStock Current Movement Up.
despite the Ranging movement AUR still in Up-Movement unless Break Down the current 4h Green Zone Which act as last hope for
AUR to still be in Up Direction Movement.
Current 4h Green Zone is Strongest Support level AUR Has Only thing waiting for at current Zone is Strong Buyer to Step-in.
P.Low & P.High (Previous Low & Previous High) Acts as good Support and Resistance levels watch out for any buying/selling pressure at these lines to secure profit.
AUR Target 4h Red Zone.
Note: 1- Potentional of Strong Buying Zone:
We have two scenarios must happen at The Mentioned Zone:
Scenarios One: strong buying volume with reversal Candle.
Scenarios Two: Fake Break-Out of The Buying Zone.
Both indicate buyers stepping in strongly. NEVER Join in unless one showed up.
2- How to Buy Stock:
On 15M TF when Marubozu Candle show up which indicate strong buyers stepping-in.
Buy on 0.5 Fibo Level of the Marubozu Candle, because price will always and always re-test the