Could TSLA rebound after a weaker decrease than expected deliverTesla Q2 2025 Delivery fell, but could it rebound in 2H?
Key Figures
Q2 2025 Deliveries: 384,122 vehicles
Year-over-Year Change: Down approximately 13–14% from Q2 2024
Wall Street Expectations: Around 385,000–387,000 vehicles
Production vs. Deliveries: 410,244 vehicles produced, indicating a build-up in inventory
Fundamental analyst
Sales Decline: This marks the second consecutive quarter of declining deliveries for Tesla, reflecting intensifying competition, especially from Chinese EV makers like BYD and legacy automakers such as General Motors, who have gained significant market share.
Aging Product Line: Tesla’s current lineup is considered to be aging, with no major new models launched recently, while competitors continue to introduce fresh, competitively priced vehicles.
Brand and Leadership Impact: Tesla’s brand image and CEO Elon Musk’s public controversies and political activity have contributed to softer demand in some markets.
Inventory Build-Up: Production exceeded deliveries by about 26,000 vehicles, suggesting demand-side challenges rather than supply constraints.
Stock Market Reaction: Despite the delivery decline, Tesla’s stock price rose by about 4–5% after the report, as actual results were better than the most pessimistic forecasts (340,000–360,000 deliveries). The markets are expecting the decreasing trend to be slower.
Techincal Analyst
TSLA has rebounded strongly from its 2023 lows, forming a clear upward channel since late 2024. The stock is currently trading near the lower end of this ascending channel, indicating a key support area.
If TSLA sustains above the $300–$310 zone, the uptrend could resume, targeting $350 and potentially $400.
A breakdown below $300 could trigger further declines toward $275 or lower, especially if accompanied by high volume.
TSLA is at a technically important level. Holding above $300–$310 keeps the bullish channel alive, while a break below could signal a deeper correction. For the next directional move, watch for volume spikes and price action near these key levels.
By Van Ha Trinh - Financial Market Analyst from Exness

Dwsn Potential flag herein my humble opinion
With potential hidden bullish divergence
With stochastics in favor.
Happy 4th of July

SbetPotential hidden bullish divergence for Sbet
68%
Chance
Also falling wedge that broke out potentially

Quick View : LNTHBearish flag in play.
Daily chart still below EMA50 — momentum remains weak.
Hourly pushing into key area between $75–$83. Breakdown possible if rejection confirms.

Bears vs the Bulls the ongoing battleI know the Bulls are hoping this is a fake out and the Bears are hoping this is the beginning. Price has close slightly below the 50 EMA and MACD(Chris Moody) made a bearish cross and RSI dropped slightly lower. Bulls need price to reclaim the 50 EMA(blue curve) and have a bullish breakout out of the golden zone 13.83. Bears want a fully developed bearish MACD and lower RSI and price to move below the 50 EMA.

Alibaba (BABA) Shares Fall to Lowest Level in 2.5 MonthsAlibaba (BABA) Shares Fall to Lowest Level in 2.5 Months
Yesterday, Alibaba (BABA) shares dropped to their lowest level since late April. The decline followed the company’s announcement of a planned bond issuance totalling approximately $1.53 billion, with a maturity date set for 2032. The funds will be used to support the development of Alibaba's cloud infrastructure and expansion of its international e-commerce business.
The market’s negative reaction may stem from concerns over rising debt levels and the potential return on these investments.
Technical Analysis of Alibaba (BABA) Share Price
When analysing the price movements of BABA shares in 2025, two key trading ranges stand out:
→ $126–145: This range originates from the long bullish candle on 20 February, following the release of a strong quarterly report;
→ $96–103: This zone was established in late April, as supply and demand stabilised around the psychologically significant $100 level.
The upper range has since acted as a resistance zone, with the price reversing from it in mid-May. The lower range has served as a support area, particularly in early April when the stock came under pressure after tariff-related headlines.
The current price action is notable in that Alibaba shares have:
→ Broken through the June support level at approximately $111.92;
→ Formed a bearish A-B-C structure, marked by lower highs and lower lows.
Using Fibonacci extension analysis, we can reasonably assume:
→ The $111.92 level is now likely to act as resistance;
→ The next potential target for the ongoing downtrend (leg C→D) lies at the 1 Fibonacci level ($100.55) — aligning closely with the previously identified support zone.
This article represents the opinion of the Companies operating under the FXOpen brand only. It is not to be construed as an offer, solicitation, or recommendation with respect to products and services provided by the Companies operating under the FXOpen brand, nor is it to be considered financial advice.

Big Bounce or Breakdown? Tesla at the edgeTesla is at crossroads right now, where the next move will define its near-term trajectory.
After an extended correction phase, TSLA is reaching a key zone around the $300 level, one that held price well during recent pullbacks.
Although recent tax news caused a decline in the price, belief in Tesla’s longer-term trajectory remains strong among many investors.
At the same time, many investors are carefully monitoring the support near $215 to $230, another important zone. This level has acted as a reliable level during past pullbacks, as it suggests the stock has a solid base, despite short-term ups and downs. For these investors, maintaining their positions through consolidation is a test of patience and belief in Tesla’s longer-term trajectory. If Tesla breaks below the $230 support zone, some investors may view this as an opportunity to take advantage once again.
Given the current setup, it’s best to be cautious and wait for confirmation before looking to get involved.

Diamond Reversal Forming On Tesla ($TSLA)This pattern on TSLA fits the outline for a diamond reversal that is referenced on Investopedia.
It has all the "classical" facets of a diamond reversal which is a high (A), a low (C) a higher-high.
Furthermore, this is happening alongside a very similar pattern on NFLX and some bearish patterns on many other stocks.
Similar forms also occurred on SPX in 2021-2222 and Bitcoin in 2021.
The move up from the 2023 lows has the form of an ABC up... which suggests another 5 wave downmove on-par with or even exceeding the previous downmove is on the way.
The move off the highs was a whole 75% so even presuming a moderate 1:1 ratio, the next wave down could be very aggressive which means that an excellent short could be lining up.
Trade safe and be careful out there.

Duolingo’s Language Learning Boom: A Profitable EdTech PlayDuolingo, the language-learning app that took the world by storm, has evolved from a free tool into a powerhouse since its 2021 IPO. With a market cap nearing $11 billion and its stock quadrupling in value, the company stands out as a rare profitable player in the edtech space. But what fuels its success, and what challenges could temper its rise? Here’s an in-depth look at Duolingo’s journey and prospects.
From Free App to IPO Success: Duolingo’s Rise
Founded in 2011 in Pittsburgh, Pennsylvania, by Guatemalan programmer Luis von Ahn and his Carnegie Mellon student Severin Hacker, Duolingo started as a free language-learning platform. Von Ahn, known for creating CAPTCHA and reCAPTCHA (later sold to Google), used those proceeds to launch the app. Its beta version debuted in 2012, offering languages like Spanish, French, German, and English. By 2013, it became the top educational app on the App Store, and its growth accelerated with the 2021 IPO on NASDAQ, raising its valuation past $3 billion. Since then, its stock has soared from $102 to $410, a fourfold increase in four years.
The Business: Learning Reimagined
Today, Duolingo is the world’s largest language-learning platform, boasting over 90 million monthly users and supporting more than 40 languages—including even such quirky options like Klingon from Star Trek movie. Its mobile app blends gamification with AI-driven lessons, making learning addictive and accessible. Beyond languages, Duolingo has expanded into math (Duolingo Math) and music (Duolingo Music), while its Duolingo English Test serves as a cost-effective alternative to TOEFL or IELTS, accepted by universities worldwide. The premium Duolingo Max subscription leverages GPT for personalized feedback, and Tiny Cards offers flashcard-based learning.
Financial Snapshot: Profitability Meets Growth
Duolingo’s financials are pretty impressive. In 2024, revenue hit $640 million (according to a different source , its $748 mln), up 40% from the previous year, with net profit reaching $30 million—a stark contrast to many growth-stage peers. Of its 90 million users, 7 million pay for premium features, driving a gross margin above 70% that reflects a lean, scalable model. The company reinvests 25% of its revenue into R&D, fostering innovation, while maintaining a debt-to-asset ratio of just 4%, signaling financial health. With a P/E ratio of 95 and a market cap of $18.6 billion, Duolingo NASDAQ:DUOL trades as a high-growth stock with solid earnings.
Market Opportunity: Scalable and Viral
Duolingo’s edge lies in its scalability and viral appeal. Its gamified approach and AI enhancements, like virtual tutors, keep users engaged, while its reputation draws new learners organically. The global language-learning market is valued in the billions, and Duolingo’s expansion into math and music broadens its TAM further. With a low monetization rate (its just 7% of users that pay), there’s ample room to convert free users to subscribers, especially as it taps into emerging markets.
Risks to Notice
Despite its wingspan, Duolingo faces headwinds. Competitors like Babbel and Rosetta Stone, alongside free YouTube content and ChatGPT, challenge its dominance. Its 7% paid-user rate highlights monetization struggles, and reliance on App Store and Google Play commissions could squeeze margins. Regulatory risks around data privacy or educational standards also loom as the app grows globally.
A Language-Learning Leader with Upside
Trading at $410, Duolingo’s stock has some space to fly, with analysts bullish on its potential. Morgan Stanley targets $515, Davidson predicts $600, and UBS and JP Morgan see $500 and $580, respectively, with a consensus around $500—offering a 22% upside. For investors, Duolingo combines profitability, a sticky user base, and innovative tech in a growing sector. While competition and monetization pose risks, its track record and expansion make it a compelling pick for growth-focused portfolios.

Newmont showing an extremely positive outlookSome notes which can be used as arguments to the bullish outlook:
The stock is above the 200D and even the 200W EMA.
Large inverted head and shoulders structure which presents an opportunity leading up to 80$ which also turns out to be the resistance level tested in 1987 and 2022.
Locally looks like someone has been accumulating.
Gold's bullish price into price discovery, geo-political uncertainty only re-affirms the thesis.
My expectation are that by the end of this year if not by middle of next year that the 80$ price target will be reached. There is a small stop at 65$ but I am highly doubtful we will stay a lot of time there.

ONCYONCY's movement stops on the bearish trendline with the maximum at around 0.96, the breakout of this level would be an important reversal signal, otherwise a return to lower levels

Cup & HandleI'm tracking a weekly chart that shows signs of a potential cup and handle pattern. While the structure is broadly intact, it's not a textbook formation. Recent market action has been noisy, and that’s reflected in the price and volume behavior.
The cup is well-formed: a rounded bottom following a downtrend and a steady climb back to previous highs.
The handle is messier than ideal – high volume and increased volatility suggest a false breakout attempt, likely driven by early positioning, profit taking, and possibly broader geopolitical or macro-driven factors.
This kind of “imperfect” handle isn't uncommon in real markets but does require more caution.
Breakout zone: Around ~6
Cup bottom: ~2.75
Depth: 6 – 2.75 = 3.25
Measured move target: ~9.25
This is a potential target, not a certainty — confirmation is key.

AXP | New All-Time High BreakoutAmerican Express (AXP) just broke above its previous all-time high, pushing into uncharted territory with strong bullish momentum.

ABCL — Bullish Breakout with Upside PotentialAbCellera Biologics Inc. (ABCL) has recently confirmed a breakout above a long-term descending trendline, followed by a successful retest of both the trendline and previous local highs. This technical development increases the probability of a sustained upward move.
The first target stands around $5.70, with a potential medium-term extension toward $13.20, offering attractive risk-to-reward parameters.
The company operates in the biotechnology and healthcare innovation sector — one of the most promising and rapidly advancing industries. While such stocks often face increased volatility due to news-driven events, the potential for high returns makes them compelling for both swing traders and long-term investors.

$BULL from $HOOD charting for maximum gains. 50$ reclaim this is a great risk to take here and i beleive can benefit alot of beginner traders to increase there first bag!
bag dad

HROW is breaking a resistance🧱 1. Pattern Identification: "Double or Triple Bottom"
🔍 At the bottom of the chart (March – May 2025), we can spot a double/triple bottom pattern.
This pattern forms when the price hits a low area multiple times without breaking lower. It suggests the price is struggling to fall further and might be ready to move upward.
🔧 It’s considered a bullish reversal pattern, meaning the downtrend could be ending, and a trend change to the upside may be starting.
💵 2. Buy Zone ("Buy price")
✅ Once the price breaks above the blue line (previous resistance), it triggers a "Buy price" signal.
This breakout shows that buyers are gaining control, and it can be a good point to enter the trade.
📈 3. Profit Targets (TP1 and TP2)
The analysis sets two potential take-profit levels:
TP1: +17% – A first target where traders might consider taking partial profits.
TP2: +30% – A second, more ambitious target if the rally continues strong.
These are marked in blue and represent areas where the price might slow down or reverse.
🛑 4. Stop Loss (SL 13%)
🛡️ The Stop Loss (SL) is set at a level with a 13% risk.
This acts as a safety net — if the price drops to this point, the trade is closed to limit losses.
📦 5. High Volume Zone
📊 On the right, there’s a colored bar chart (yellow and blue) called a Volume Profile.
It shows at which price levels the most trading activity happened.
🔸 The area marked as "High volume zone" indicates strong interest and could act as a future resistance level.
✅ Quick Summary
A triple bottom has formed — a pattern that often leads to a price increase.
A breakout above resistance triggered a buy signal.
Two profit targets are set at +17% and +30%.
A 13% stop loss helps manage risk.
A high-volume area might act as resistance or a pause point for the price.

Lemonade, Inc. (LMND) – AI-Driven Disruption in InsuranceCompany Snapshot:
Lemonade NYSE:LMND is a tech-forward insurer reinventing traditional insurance through AI, data science, and a mobile-first experience across renters, homeowners, auto, pet, and life products.
Key Catalysts:
AI + OpenAI Integration 🚀
Collaborations with OpenAI are powering Lemonade’s RealTime API and AI voice agents, improving claims automation and customer support.
Enhances scalability and reduces overhead, key to long-term margin expansion.
Operational Resilience 🔥
Despite a $22M wildfire loss in California, Lemonade met Q1 guidance—thanks to robust reinsurance and effective risk management, underscoring operational maturity.
Auto Insurance Momentum 🚗
Car insurance was the top growth driver in Q1 2025, tapping into a multi-billion-dollar market where Lemonade still holds early-stage penetration.
AI-powered underwriting gives it an edge over legacy incumbents.
Investment Outlook:
Bullish Entry Zone: Above $38.00–$39.00
Upside Target: $65.00–$70.00, supported by AI innovation, product diversification, and scalable infrastructure.
🧠 Lemonade is not just selling insurance—it’s rewriting the rulebook on how it’s delivered, priced, and experienced.
#Lemonade #LMND #Insurtech #AIInsurance #OpenAI #DigitalTransformation #AutoInsurance #TechStocks #GrowthStocks #ClaimsAutomation #Reinsurance #Fintech #CustomerExperience

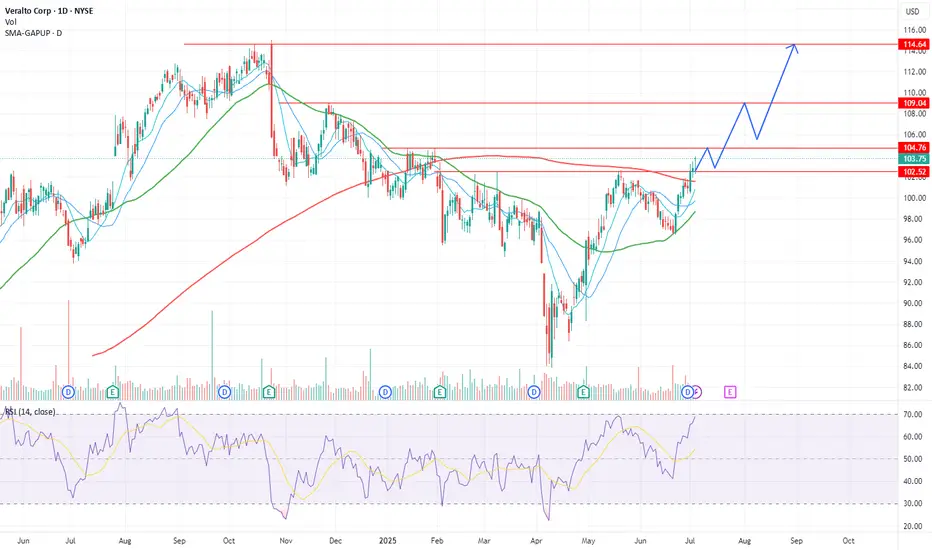
Veralto broke above 200 MANYSE:VLTO is now trading above 50 and 200 MA for the first time since 8 months and is expected to continue trending higher! Price action and targets are shown on the chart, stop loss daily close below 20MA.
PS. My views only, not financial advice!
Harrow Inc. price action is bullishNASDAQ:HROW is coiling nicely and about to breakout, the stock will face the 200MA upon breakout which is expected to cause the stock to pullback. Anticipated price action and targets are shown on the chart, stop loss daily close below 29.5$
PS. My views only, not financial advice!

DELL : Bullish after correctionwithin a 1 or so I expect a Pull back correction (1-2 weeks) than a continuation of Dells bullish momentum , May be an opportunity to add to you position. There no telling exactly how far down a larger scale wave -2 correction may go , ( Best case 105/ Worst case 85 ), . Need to wait and analyze the wave structure as it corrects.

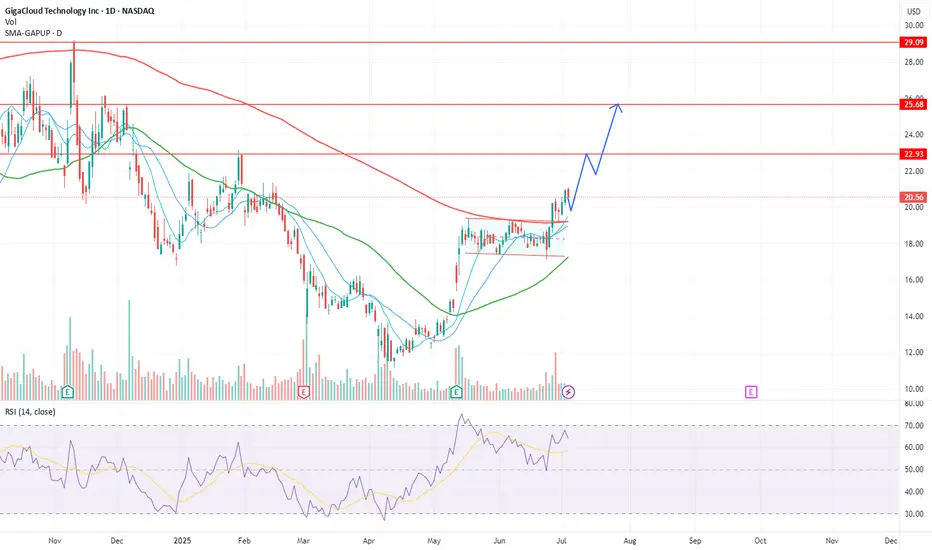
Gigacloud broke out of the flag patternNASDAQ:GCT broke out of the flag pattern and to ready to post more gains. If it hold above the 200 MA and bounce back, long to target the levels on the chart. Stop loss daily close below 200MA.
PS. My views only, not financial advice!
SMCI bullish setup longSMCI seems well positioned for one of those "face melting' rips in the coming weeks as it normally does. All TA in daily, weekly and monthly timeframes tell thesame tale- Bullish move imminent.
Catalyst- riding on NVDA new Blackwell chip and Tariff news coming in next week, high short interest, VPA show market makers already took a position- all signs pointing north, which looks promising for JULY and early August.

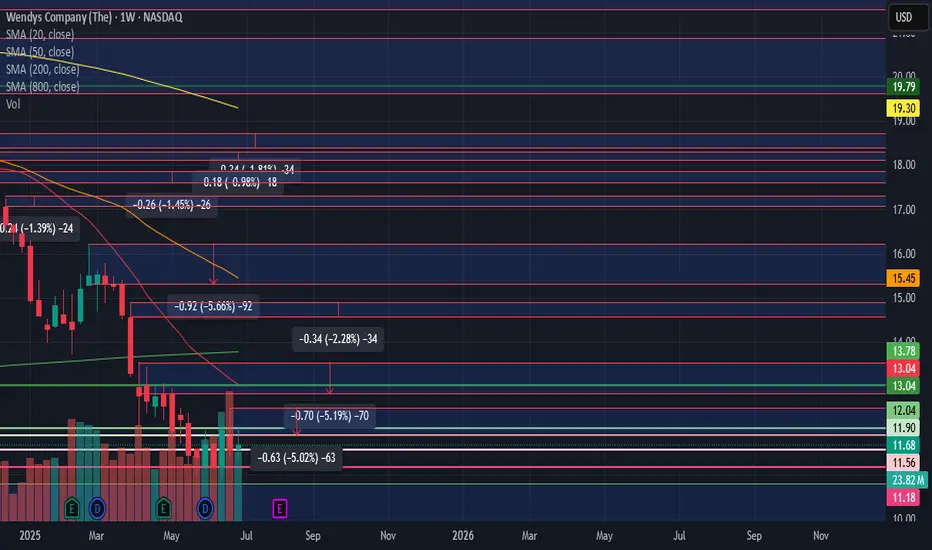
I like Wendy's lolI like Wendy's as a long term investment and here's why...
The fundamentals are pretty solid. They've had a rising EPS for 5 years, and a falling stock price for years. They also have a stable growing dividend. Their debt situation is stable. In the last month there has been a large volume of insider buying, the most notable of which is insider John Mihn, Chief Legal Officer, with a share delta of 328%. Back in may Point 72 dropped a 13F that showed a 108% share delta on their position compared to Blackrock and Trian that are only slightly shaving their positions.
In terms of current price. It is bouncing around its 3 and 5 year lows and there is strong historical buying starting at $8 and ending at around $11. I consider it a big zone of support and the 5 year low is nestled a little above the midpoint of this zone.
In terms of a buying strategy...just DCA it. Buy like a share a week or whatever fits your personal risk.
The price may fall a little further. August is slow for the restaurant industry. I wouldn't expect this to experience the buying it deserves, retail or institutional, until after August. This could also serve as a trade catalyst for people looking for margin or options action. Might come in September when their next earning call drops. I would be prepared to DCA for six months though. That's how I treat all of these situations.